MIMS Analysis Engine GUI User Guide - 1/15/2004
Introduction
Installation
Types of Plots
Selecting Data for Plots
Plot Options
Page Options
Introduction
The MIMS Analysis Engine provides a set of graphing tools for analyzing data.
You can select different data sets and use the different plots to
find relationships in your data. You can output these plots to a
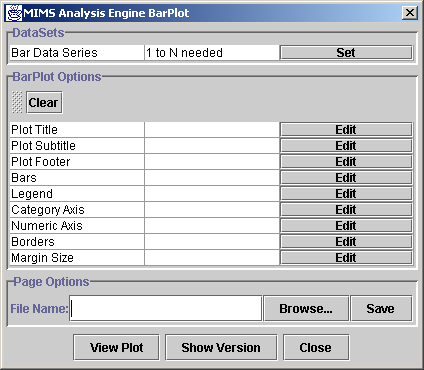
variety of screen, file and printer formats. The main window for the graphical user interface (GUI) for the Analysis Engine is shown in Figure 1. It consists of panels for choosing data sets, editing plot options, and page options, such as saving the plot a file.
Press the Show Version button to see information about the version of the MIMS Analysis Engine you are using.
Once you have selected data sets and customized any plot and page options,
you can see the plot by pressing the View Plot button.
On a PC, plots will appear in Adobe Acrobat. It will speed up subsequent plots to leave
Acrobat running after the first plot. You may wish to configure your Acrobat
display preferences to "Fit in window" so you can see the entire plot
without scrolling.
In addition to the version of this document with linked HTML pages, this document is available in a single file to make printing more convenient. See EntireUserGuideForPrinting.html if you wish to print this document.

Figure 1. Analysis Engine Main Window
Types of Plots
There are six types of plots available. Click on the name below
to view more details about each one.
Data Sets
You must select at least one data set to produce a plot. Some plots
require more than one data set. For example, a Bar Plot only
needs
one or more data sets to produce bars along one axis, and a Scatter Plot
needs both
X and Y data sets to draw the points. Each plot tells you
how many data sets are required for it. For more
information, see the Data
Set
Selector page.
Plot Options
Each plot has a set of options listed in a table. The options vary
for each plot, but might
include a title, legend or a type of axis. You can press the Edit
button next to each option (shown in Figure 1) to edit its properties. The options for each
plot
are detailed for each plot in the Types of
Plots section. Below is a list of all plot options. Note that
many of these options are not found on all plots. For
example, the Bars option applies to a Bar Plot but does not apply to a
Scatter Plot. NOTE: if some parts of an option were not functioning properly
at the time of the release, the features were disabled. You may notice this
when you run the GUI.
Page Options
On all plot windows, there is an area called Page Options.
This allows you to specify the filename in which to
save the plot. If you wish to display your plot to the screen, you
can press the View Plot button at the bottom of the main window.
You may wish to display to the plot to the screen until you are
happy with the settings, and then save it to a file. The
Analysis Engine supports the following file formats:
There are two ways to save a plot:
- You may either type in a directory and filename and press the Save button,
or
- Press the Browse button to use a file browser to specify the directory and file name to which the file should be saved.
The type of file that the plot is saved to is determined by its file
name extension. When using the file browser to select the file,
the file type is chosen using the menu of file types. If you type in the file name, you must
use one of the the following extensions in order to save a plot to a file:
- .jpg produces a JPEG file.
- .png produces a PNG file.
- .pdf produces a PDF file.
- .ps produces a PostScript file.
- .ptx produces a LaTeX picture file.

