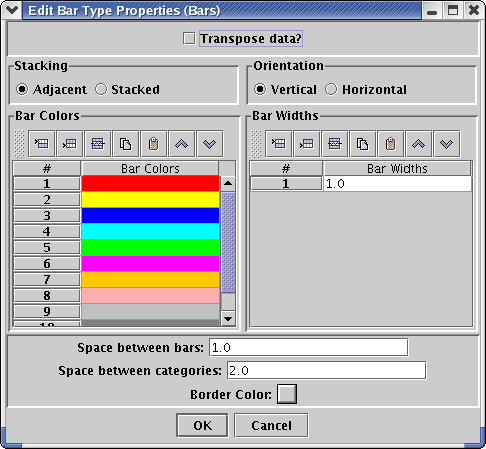
Bars
This window allows you to set the options for how the bars are drawn are
on a bar plot.

Transpose Data?
Check this box if you would like to transpose your data from the
original order. For example, if you have on data set per chemical and
each data set contains data for several source categories, the default
view would be to show chemical names on one axis, and bars for
each source type. If you click "Transpose data?" then the items
on the axis will be the source types and there will be bars for the
chemicals.
Stacking
When multiple data sets are selected, selecting Adjacent will place the
bars next to each other.
while selecting Stacked will place values in one bar stacked on top of
each other. See the Bar Plot page for examples.
Orientation
The Vertical orientation places the bars up and down. When you choose
this orientation, the Category axis is the X axis. The Horizontal
orientation places the bars right and left. When you choose this
orientation, the Category axis is the Y axis.
Bar Colors
These are the colors used for the bars in your data set. If you have
more data than colors, then the Analysis Engine will start over at the
top of the list when choosing bar colors.
Bar Widths
You may specify different bar widths for each bar in your plot.
If you have more bars than bar widths specified, then the
Analysis Engine will start over at the beginning when assigning bar
widths. The default is to have a single bar width set to 1.0.
This is a relative size - the actual width of the bars depends on the number
of bars plotted. A value of 0.5 will cause the bars to be half as
wide as this, while a value of 2.0 will cause them to be twice as wide.
Space Between Bars
This is a relative spacing between each bar in the plot. A size of
1.0 is the default. A value of 0.5 will make the space between
bars half as large, while a value of 2.0 will set the bars twice as far apart.
Space between Categories
This is the relative spacing between categories (or groups of bars) on
the axis. This
helps to differentiate between each category. The default value
is 2.0. A value of 1.0 will place the categories half as close. A
value of 4.0 will place them twice as far apart.
Border Color
This is the color for the borders around each bar.
