Numeric Axis
A Numeric axis is one which plots values as numbers. This is different
from a Time Series axis and a Category axis. A log scale, grid and
custom tick mark spacing are available on this axis.

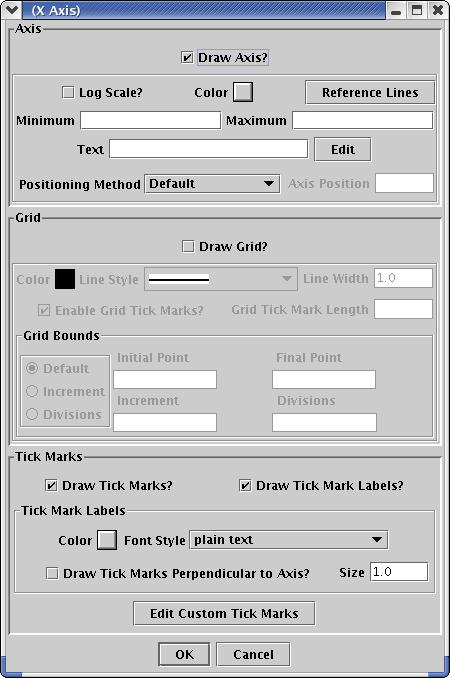
Axis
Draw Axis?
To draw the axis and any associated
grid and tick marks, check this
box. To disable all axis features for this axis, uncheck this box.
Log Scale?
To plot this axis using a log scale,
check this box.
Color
This sets the color of the axis and
tick marks.
Reference Lines
Reference lines allow you to place
lines on the plot at places that you
specify. You could use them to indicate a trend line or upper and lower
control limits in your plot. Reference lines have their own
dialog
and are covered
here.
Minimum and Maximum
Enter values here to specify the axis
minimum and maximum range. These are in the data coordinates of
the axis.
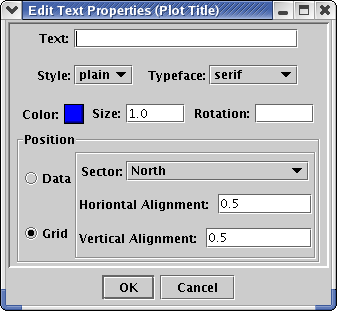
Text
This is the label that describes the
axis. It will normally appear
below or next to the axis. You may enter text and allow the
Analysis Engine to format it by typing in the text box. Press the
Edit button to edit font and positioning features of the
axis text.
Positioning Algorithm
This specifies the method that the
Analysis Engine will use to position
the axis. The default behavior is to place the X axis at the bottom of
the plot and the Y axis on the left side of the plot. Other
positioning methods are:
- Lines Into Margin: When
you select this option, you must enter a value in the Axis Position
text
box. This value is the number of lines to move the axis into the
margin. The X axis will move down this number of lines and the Y
axis will move left this number of lines.
- User Coordinates: This
option allows you to move the axis into the plot area. When you select
this option, you must enter a value in the Axis Position text box. This
value is the coordinate on the other axis where you want this axis
drawn. For example, if you want to place the X axis at a value of 5.0
on
the Y axis instead of 0.0, enter 5.0 in the Axis Position box.
Grid
The grid is a set of lines that are
drawn all the way across the plot.
They allow you to read you data values from the plot more accurately.
Draw Grid?
To draw the grid, check this box. To
turn off all grid drawing, uncheck
this box.
Color
The color to use for the grid lines.
Line Style
The type of line to use for the grid
lines. There are seven line styles
including a blank line.
Enable Grid Tick Marks?
This feature only works with the Log
Scale enabled. Set the Grid
Line Style to a blank line to see this feature. It will draw tick marks
facing into the plot along the axis at each grid point.
Grid Tick Mark Length
This is the relative length of the grid
tick marks. The default size is
1.0. A value of 0.5 makes a line half as long. A value of 2.0
makes a line twice as long.
Grid Bounds
This defines where the grid starts and
stops. You can choose to
draw the grid only on part of the axis.
Default
The default behavior is to draw the
grid all of the way across the axis.
Increment
With the Increment method for grid
spacing, you must specify an Initial
Point in the coordinates of the axis. Then you must specify an
Increment
in the coordinates of the axis. You may optionally choose to specify a
Final Point where grid drawing should stop. For example, to draw
a grid from 1.0 to 2.0 with a grid line at each 0.1 mark, enter 1.0 for
the Initial Point, 2.0 for the Final Point and 0.1 for the Increment.
Divisions
With the Divisions method of grid
spacing, you must enter an Initial and
Final Point where the grid will start and stop. In addition, you must
specify the number of divisions (as an integer) to place between the
Initial and Final Point. For example, if you wish to draw a grid
between
1.0 and 2.0 with 10 evenly spaced divisions, enter 1.0 for the Initial
point, 2.0 for the Final Point and 10 for the Divisions.
Tick Marks
Tick Marks are the small ticks that are
placed along the axis to
indicate where values lie.
Draw Tick Marks?
Check this box to draw tick marks.
Uncheck it to turn of tick mark
drawing.
Draw Tick Mark Labels?
Check this box to draw the tick mark
labels. Uncheck this to
disable all tick mark label features.
Label Color
This sets the tick mark label color.
Font Style
This sets the font style for the tick
mark labels (plain, bold, italic
or bold/italic).
Draw Tick Marks Perpendicular to Axis?
Check this box if you would like the
tick marks to appear perpendicular
to the axis. This is used on the X axis when you have long tick mark
labels or on the Y axis to set the tick mark labels horizontal.
Size
This is the relative of the tick
marks in pixels.
Custom Tick Marks
Custom Tick Marks allow you to set
values and labels on the axis
wherever you choose. They will override the default tick marks.

To use them, press the Edit Custom Tick Marks button. This will
bring up a separate dialog window. On the left is a table where
you can enter the tick mark labels. On the right is a table where
you specify the positions on the axis where the tick marks should be
drawn. To add a line to the table, press the Insert Row button.
You must add the same number of lines to both the left and right
tables.

