Bar Plot
The Bar Plot plots data in a series of bars based on the categories
that are provided. One axis plots the categories and the other axis
plot
the numeric values for each category. The images below show some
of the features of the Bar Plot.
Data Sets
A Bar Plot requires one or more data sets before it can be drawn.
Plot Options
Example plots
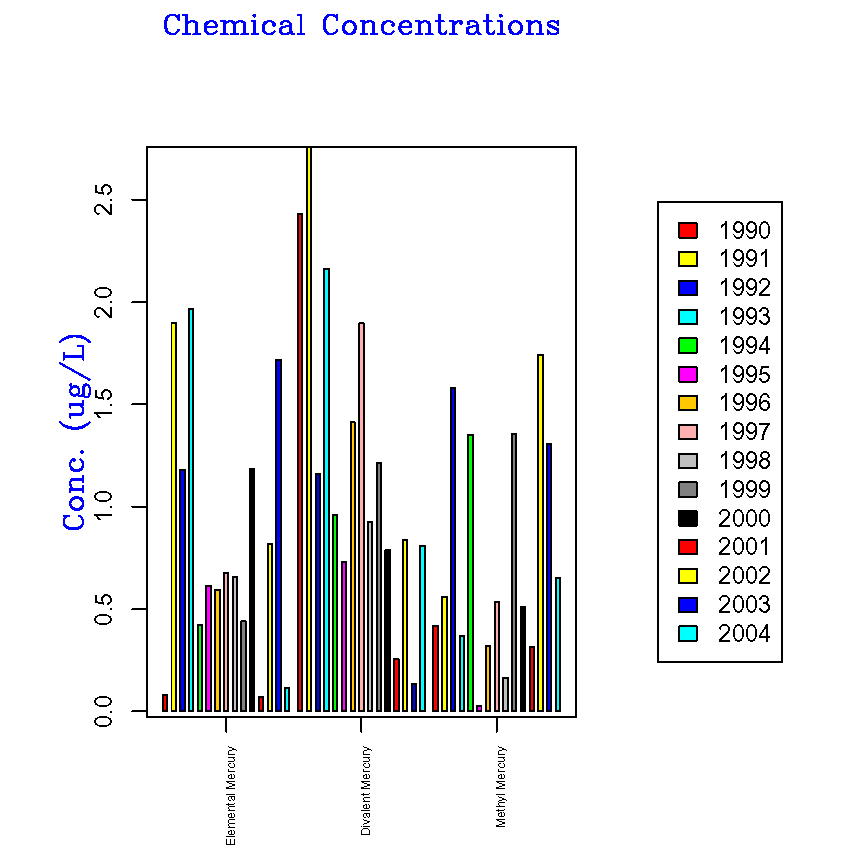
Adjacent bars
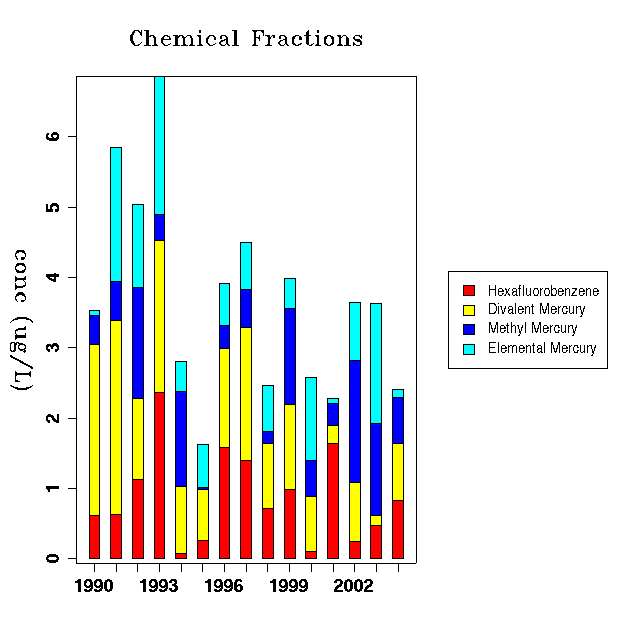
Stacked bars
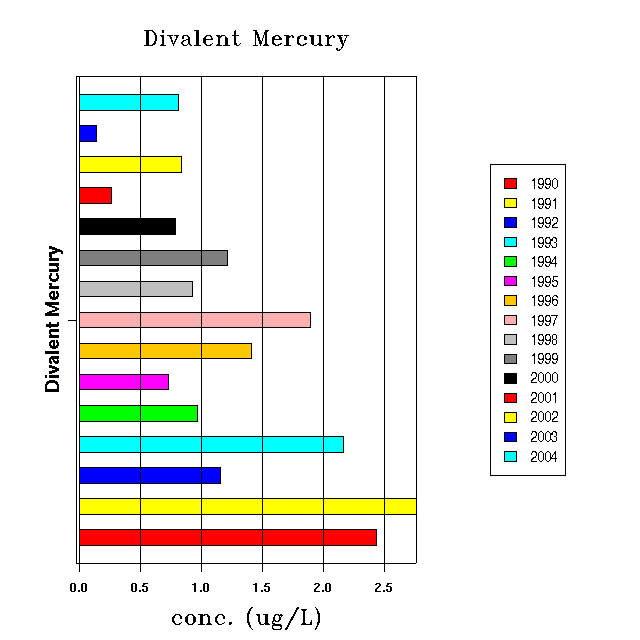
Horizontal bars