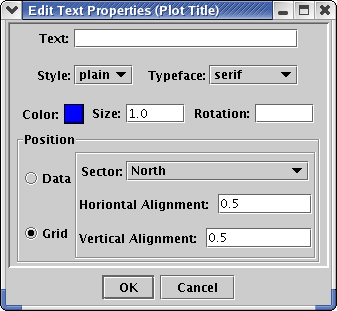
When you select the Absolute
positioning button, you should enter X and
Y coordinates for where the title should appear. These
coordinates
are in the same units a your data. For example, if your Y axis runs
from 0 to 3, then 0 would position the text on the same line as the
'0' tick mark and 3 would position the text on the same line as
the '3' tick mark.
When you select the Grid positioning
button, you should enter a sector
and horizontal and vertical alignment values. The sector is a set
of compass
values (North, South, East, West, etc.) and a center value. These
are sectors in different areas for the Title, Subtitle, Footer, Axis
and Reference Line.
- Title : The sectors are at the top of the screen above the plot.
- Subtitle : The sectors are above the plot, but below the Title
text.
- Footer : The sectors are at the bottom of the screen below the
plot.
- Axis : The sectors are below the X axis and to the left of the Y
axis.
The X and
Y alignment values can be between 0 and 1.0 and indicate where the text
should be placed within the chosen sector. For example, if you chose an
horizontal alignment value of 0, the text would be placed to the left.
If you
chose 1.0, the text would be placed to the right. For vertical
alignment values, 0
indicates the lower part of the sector and 1.0 indicates the top of the
sector.
