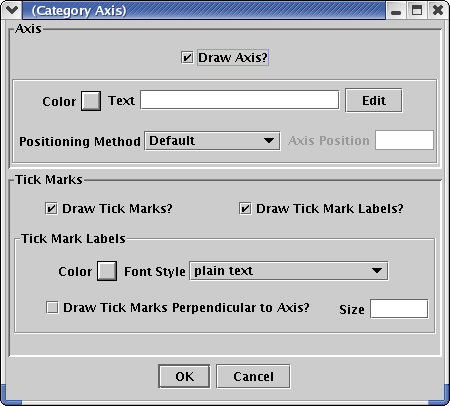
Category Axis
A Category Axis has a series of categories on the axis. These
might be animals in a study, types of industries, emission categories,
or age groups.

Axis
Draw Axis?
To draw the axis and any associated
grid and tick marks, check this
box. To disable all axis features for this axis, uncheck this
box.
Color
This sets the color of the axis and
tick marks.
Minimum and Maximum
Enter values here to specify the axis
minimum and maximum range. These values are in the units of the data on
the axis.
Text
This is the label that describes the
axis. It will normally appear
below or next to the axis. You may enter text and allow the
Analysis Engine to format it by typing in the text box. Press the
Edit button to edit font and positioning features of the
axis text.
Positioning Algorithm
This specifies the method that the
Analysis Engine will use to position
the axis. The default behavior is to place the X axis at the bottom of
the plot and the Y axis on the left side of the plot. Other
positioning methods are:
- Lines Into Margin: When
you select this option, you must enter a value in the Axis Position
text
box. This value is the number of lines to move the axis into the
margin.
The X axis will move down this number of lines and the Y axis
will move left this number of lines.
- User Coordinates: This
option allows you to move the axis into the plot area. When you select
this option, you must enter a value in the Axis Position text box. This
value is the coordinate on the other axis where you want this axis
drawn. For example, if you want to place the X axis at a value of 5.0
on
the Y axis instead of 0.0, enter 5.0 in the Axis Position box.
Tick Marks
Tick Marks are the small ticks that are
placed along the axis to
indicate where values lie.
Draw Tick Marks?
Check this box to draw tick marks.
Uncheck it to turn of tick mark
drawing.
Draw Tick Mark Labels?
Check this box to draw the tick mark
labels. Uncheck this to
disable all tick mark label features.
Label Color
This sets the tick mark label color.
Font Style
This sets the font style for the tick
mark labels (plain, bold, italic
or bold/italic).
Draw Tick Marks Perpendicular to Axis?
Check this box if you would like the
tick marks to appear perpendicular
to the axis. This is used on the X axis when you have long tick mark
labels or on the Y axis to set the tick mark labels horizontal.
Size
This is the size of the tick
marks in pixels.
