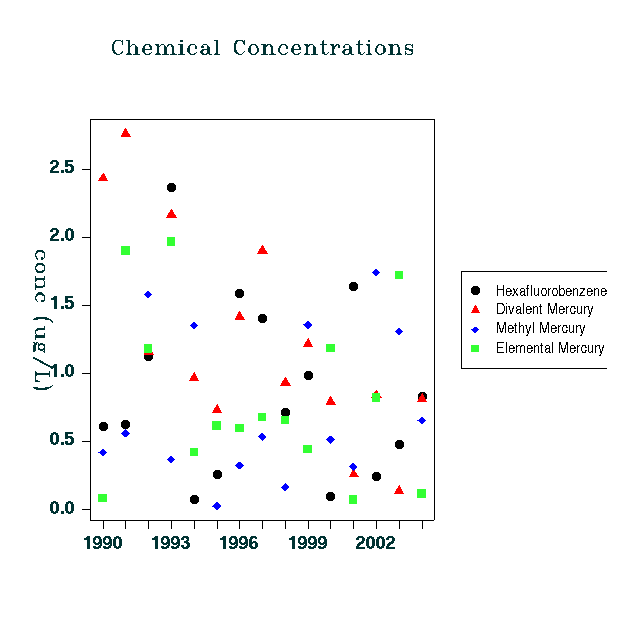
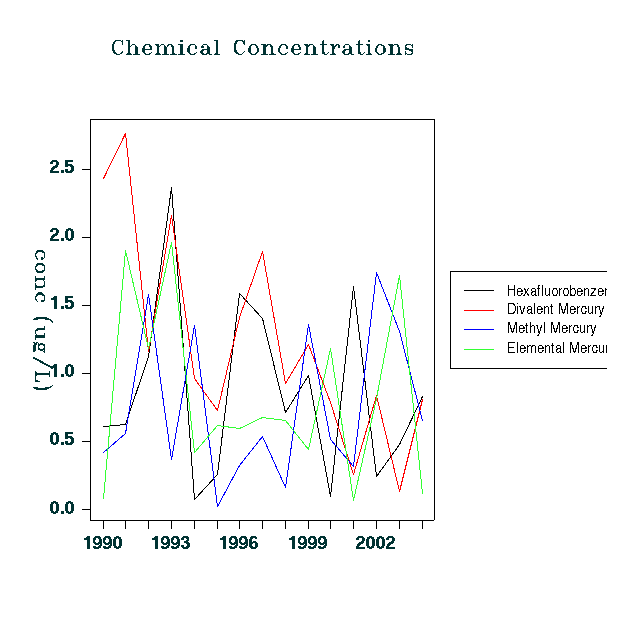
Discrete Category Plot
This plot allows you to plot different categories of data on top of
each other. This plot is useful if you would like to plot values
from different data sets that contain the same categories. Below are
some examples of how the plot might be used.
Data Sets
A Discrete Category Plot requires one or more data sets before it can
be drawn.
Plot Options
Example Plots