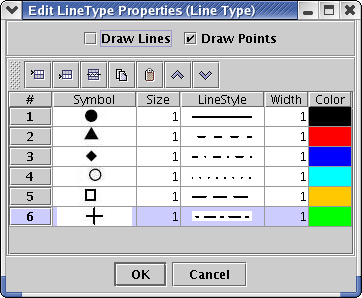
Line Type
The Line Type is used to set the properties (width, style, color, etc.)
for the lines and symbols used to draw data on the plot. To edit any of
the values in the table, double-click on the value. In some cases, you
can edit the value in place and in others, a dialog will appear that
allows you to edit the value.

Draw Points and Lines
If you only wish to use points in your plot, check only the Draw Points
check box. If you only wish to use lines in your plot, check the Draw
Lines check box. If you wish to use both points and line in you plot,
then check both the Draw Lines and Draw Points check boxes.
Symbol
There are 19 different symbols available to differentiate each data set
on the plot. Select one for each data set from the drop down list in
the
table. If you have more data sets than symbols defined, then the
Analysis Engine will start to reuse the same symbols over when it
gets to the end of the defined symbols. If you wish to add more unique
line styles, click one of the two leftmost icons in the toolbar above the
table.
Size
This is the relative size of the symbol. A value of 1.0 is the
default. A value of 0.5 would be half as large. A value of 2.0
would be twice as large.
Line Style
This is the style to use when drawing the line for each data set.
There are 6 available line styles. If you have more than
six
data sets, the Analysis Engine will start over with the first line
style and continue down the list when choosing line styles for the data
sets.
Width
This is the relative width of the lines. A value of 1.0 is
the default. A value of 0.5 would be half as large. A value of
2.0
would be twice as large.
Color
This is the color for the points and line of this data set. If
you have more data sets than colors defined, then the Analysis Engine
will start at the top of the list and use the colors cyclically to
choose colors for the data sets.
