Scatter Plot
A Scatter Plot displays points and lines between an X and Y axis.
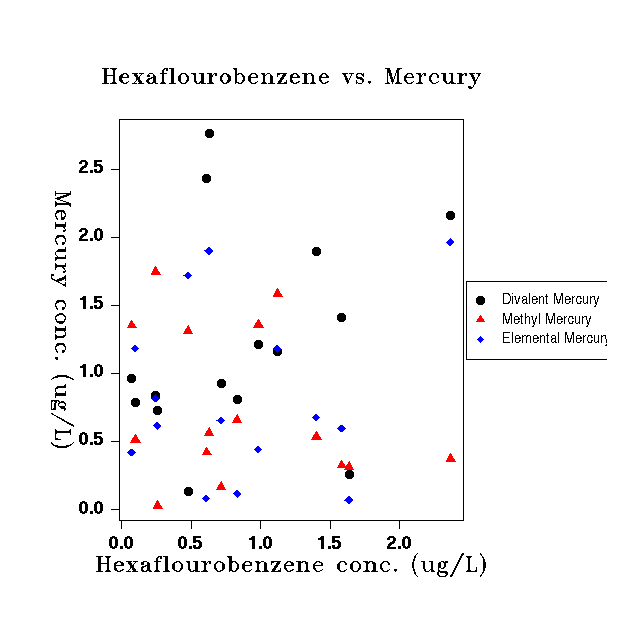
Scatter Plot with points
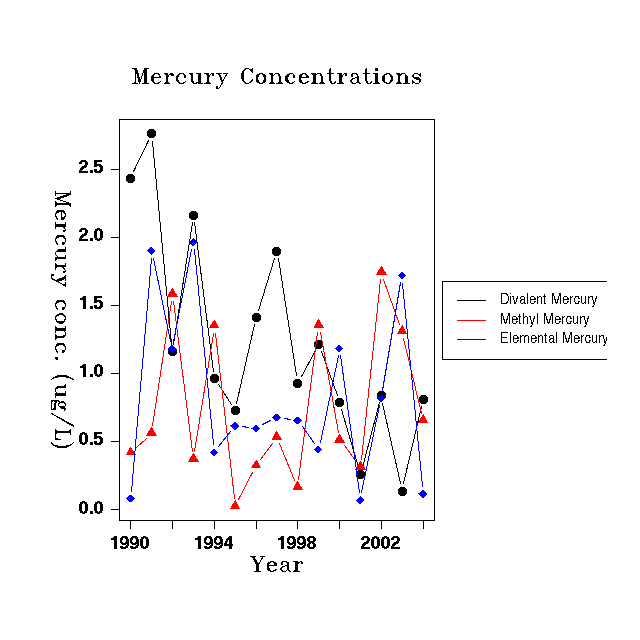
Scatter Plot with lines
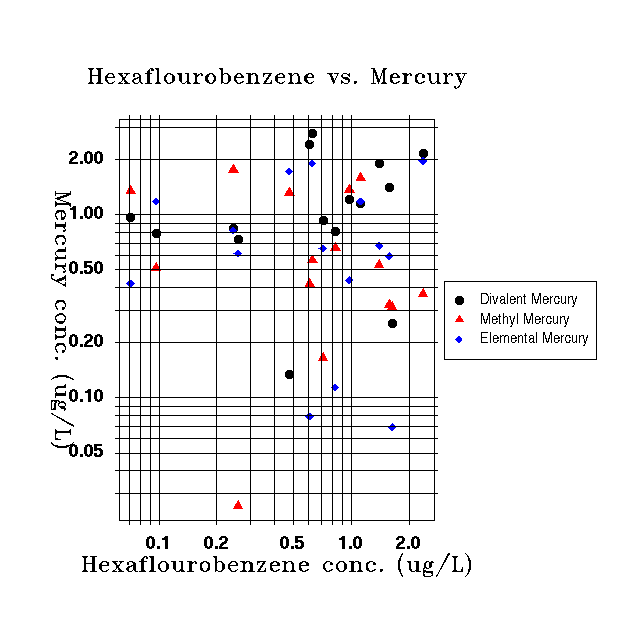
Scatter Plot with log scale and grid
Data Sets
A Scatter Plot requires exactly one X data set and one or more Y data sets.
Plot Options
Plot Title
Plot Subtitle
Plot Footer
Legend
X Axis
Y Axis
Line Type
Outline
Display Size
Example Plots
Scatter Plot with Points
Scatter Plot with Lines
Scatter Plot with Log Scale and Grid