Histogram
A Histogram is a Bar Plot that shows the frequency of different values in a data set. Use this plot to see how often your data values fall within certain range.
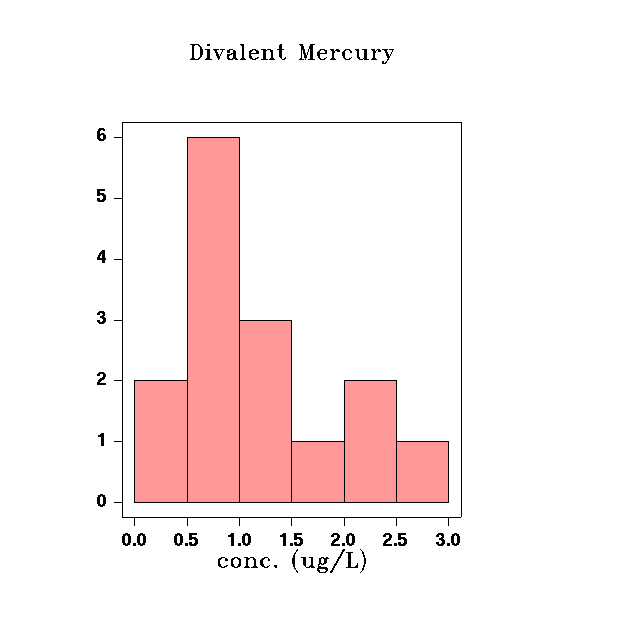
Histogram with solid bars
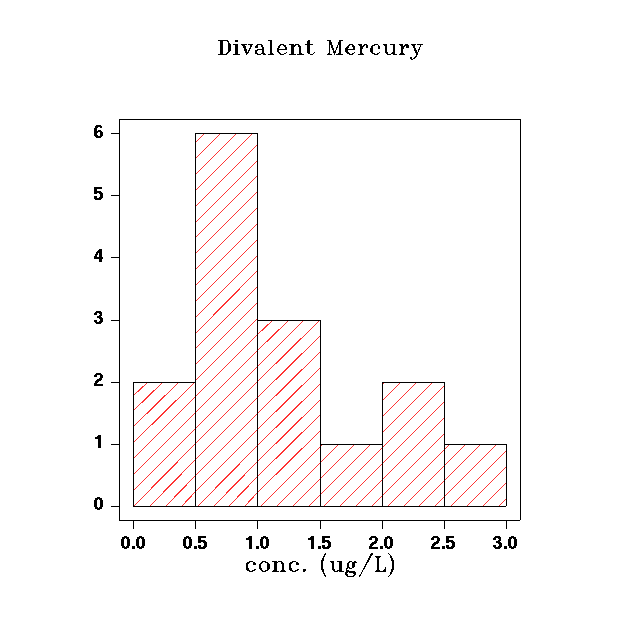
Histogram with shaded bars
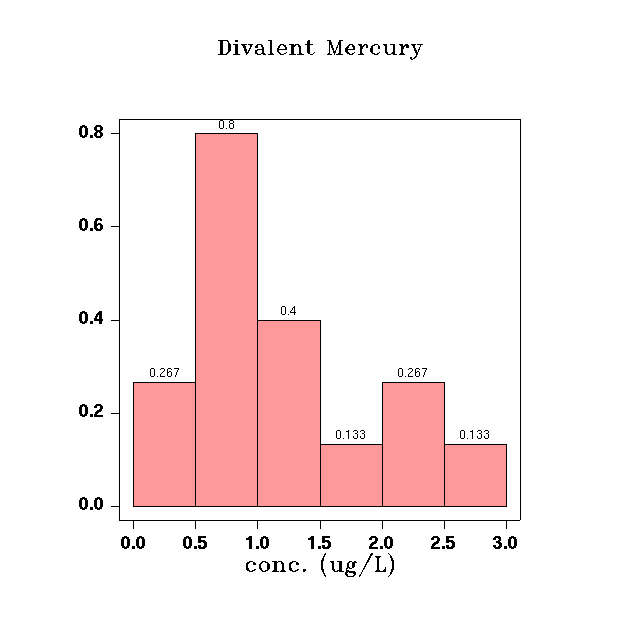
Histogram with probabilities displayed
Data Sets
A Histogram Plot requires exactly one, and only one data set.
Plot Options
Plot Title
Plot Subtitle
Plot Footer
Histogram
Category Axis
Y Axis
Line Type
Outline
Display Size
Example Plots
Histogram with Solid Bars
Histogram with Shaded Bars
Histogram with Probabilities Displayed