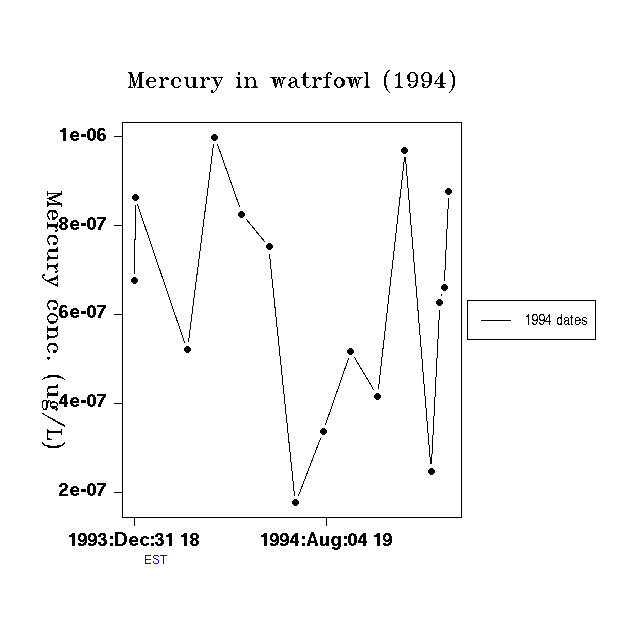
Time Series Plot
A Time Series Plot displays time along the X axis and data values along
the Y axis. Use this plot to display data that varies in time such as
air pollution data, consumer prices or stock values.
Data Sets
A Time Series Plot requires one or more time varying data sets.
Plot Options

