![]()
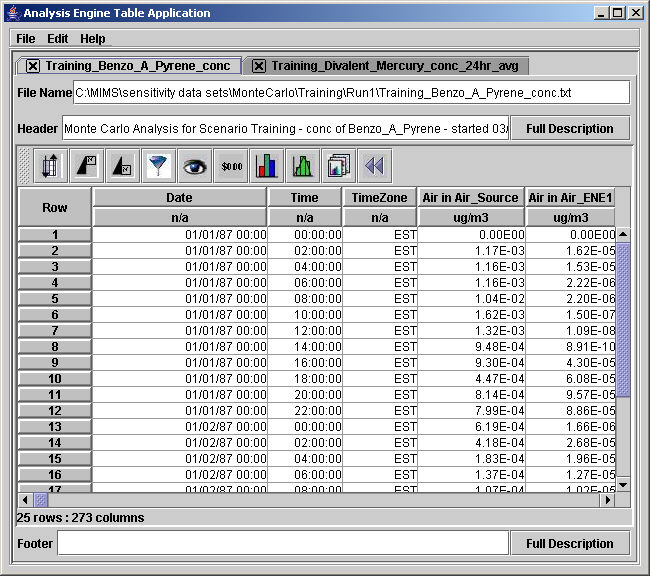
The Analysis Engine imports data and displays it initially as a table on a sheet. You may click to view other tables that have been imported or analyses that have been performed. The figure below shows a sample display of the window.
The window may be stretched, maximized to fill the screen, or minimized for later viewing. Click the X in the upper right corner of the window to close the program. The menu bar contains menus for File, Edit, and Help commands. The File menu contains the following operations:
Import (Alt-I) - Creates the user interface to open files with the Analysis Engine
Recent Files (Alt-R) - Allows you to open the most recently used files again
Load Configuration (Alt-L) - Retrieve the analysis features (e.g., filter criteria, table format, sorting scheme, and plot configurations) used on another data set and apply them to the table in the foreground
Save Configuration - Save the analysis features (e.g., filter criteria, table format, sorting scheme, and plot configurations) from the table in the foreground
Export (Alt-E) - Creates the dialog box to save files using the Analysis Engine with a format you specify
Close (Alt-C) - Closes the file that is currently in the foreground, with no changes to the file
Quit (Alt-Q) - Closes the entire Analysis Engine
The Edit menu currently contains:
Rename Tabs - Opens a dialog box that allows you to change the names of the tabs that show the various tables.
Operation of the Import and Export tools, as well as the functions listed in the table below, are described in the chapter on Operating Key Functions. No information other than the menu bars is shown until after files are imported.
Below the menu bar, tabs list the table names beside boxed X's. Click on the tab of interest to bring that table to the foreground. The File Name, Header, and Footer fields reflect the information found directly in the file, and the file path is included in the file name. For longer headers or footers, click the Full Description button to read the entire text. Click directly on a boxed X to dismiss this tab completely.
Ten icons appear below the Header field in a toolbar and have the following functions for the table in the foreground (front tab):
|
Identifier |
Function |
Icon |
|
Arranges the data rows in ascending or descending order based on the user's column selection |
| |
|
Displays only the rows with the highest values within a certain filtered set |
| |
|
Displays only the rows with the lowest values within a certain filtered set |
| |
|
Shows only selected rows of data based on user-specified criteria |
| |
|
Selects the columns that should be displayed in the table |
| |
|
Allows the user to pick the font styles for the various columns |
| |
|
Creates a plot of the data using the R statistical package |
| |
|
Performs percentile and histogram analyses on the data columns |
| |
|
Analysis Configuration |
Same as Save Configuration in the File menu. Saves the analysis features from the table in the foreground |
|
|
Reset |
Returns the table display to its original form |
|
The table rows and columns appear beneath the tool bar. The number of column header rows is determined during the import process. The number of rows and columns are determined by the file dimensions. If you click on a column header row, the data will be re-sorted in alternately ascending or descending order.
The Analysis Engine features a drag-and-drop feature for the columns in the table. Click the mouse on a column heading, hold down the left mouse button, and drag the mouse to the desired spot to drop the column. Then release the left mouse button. This feature makes it easy to rearrange data sets for export to other applications (e.g., Weka).
The Reset
(![]() ) icon will return
the data to its original organization.
) icon will return
the data to its original organization.