![]()
The Statistics function enables you to describe
the distribution of a data set. Currently
the Statistics function performs
percentile and histogram analyses on the data columns, as well as providing
basic statistics about data columns. The
Statistics function operates on the data set as it currently appears in
the table; if some of the data has been filtered and is not shown, it
will not be included in the analyses. Select
the Statistics (![]() ) toolbar button in the Data Table Window to present the Statistics window:
) toolbar button in the Data Table Window to present the Statistics window:
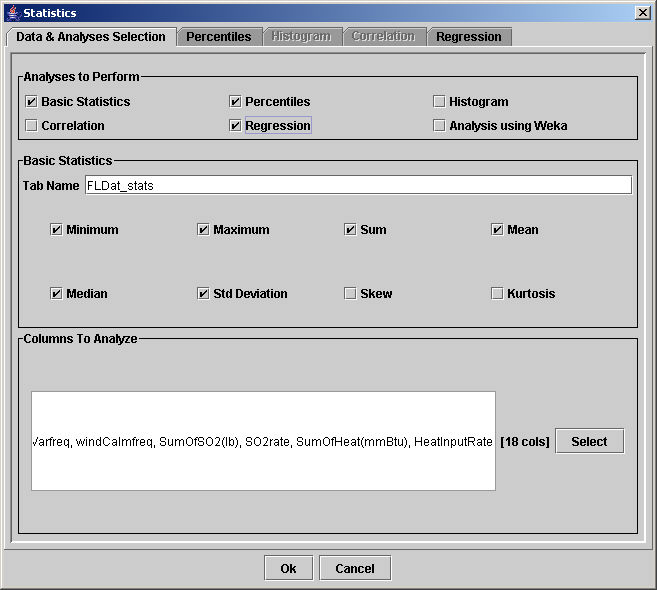
The Statistics window uses five tabs, but you must first complete the information on the Data & Analyses Selection tab before working on the other tabs. In the Analyses to Perform group box, first choose which new table types will be created:
Basic Statistics - descriptions of each column (minimum, maximum, sum, mean, median, standard deviation, skew, and kurtosis)
Percentiles - determines the appropriate divisions for binning data within columns
Histogram - determines the distribution of data sets in columns between break points
Correlation - compares relationships between columns
Regression - calculates linear regressions relating specified columns
Analysis using Weka - performs principal component analyses, clustering, histograms, visualization of variable relationships, associations, classifications, and other functions of the Weka Explorer
If you have checked the Basic Statistics check box in the Analyses to Perform group box, then complete the information in the Basic Statistics group box. Type a title for the new table in the Tab Name field. By default, the statistics of interest (minimum, maximum, sum, mean, median, standard deviation, skew, and kurtosis) are all initially checked, but you may click on the check boxes to de-select some of the statistics.
|
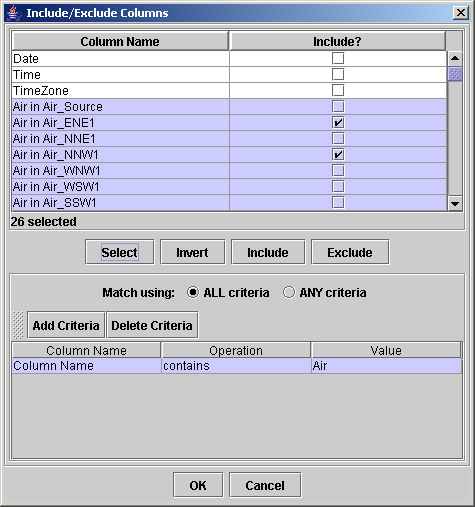
In the Columns to Analyze group box, you must also choose the data columns that should be analyzed. By default, all columns are selected. Click the Select button to present the Include/Exclude Columns window:
The list on the Include/Exclude Columns window shows all of the column names and whether or not the columns should be included in the analyses. A check in the "Include?" column indicates that a given column will be analyzed. You may directly check and un-check the check boxes by clicking the mouse in them. Use the vertical scroll bar on the right to move up and down through the table of column names. Click the Invert button to automatically de-select the blue rows and select those that were white. Users may also choose to include or exclude columns whose names meet certain criteria:
Click OK to add the names of the included columns beneath the Columns to Analyze: label on the Statistics interface. Click OK to complete the action and close the Include/Exclude Columns window. Click Cancel to close the Include/Exclude Columns window without making any changes. |
After you complete the selections on the Data & Analyses Selection tab of the Statistics window, click OK only if no Percentiles, Histogram, Correlation, or Regression analyses are to be performed. To set the parameters for the Percentiles, Histogram, Correlation, and Regression analyses, click on the Percentile, Histogram, Correlation, and Regression tabs to specify the parameters for the analysis.