![]()
The Statistics function enables you to describe
the distribution of a data set. When
you select the Statistics ![]() toolbar button in the Data Table Window, the Statistics
window appears. This
window begins on the Data & Analyses
Selection tab. After
the data columns are selected and you specify that a Regression analysis
should be performed on the first tab, then click on the Regression
tab:
toolbar button in the Data Table Window, the Statistics
window appears. This
window begins on the Data & Analyses
Selection tab. After
the data columns are selected and you specify that a Regression analysis
should be performed on the first tab, then click on the Regression
tab:
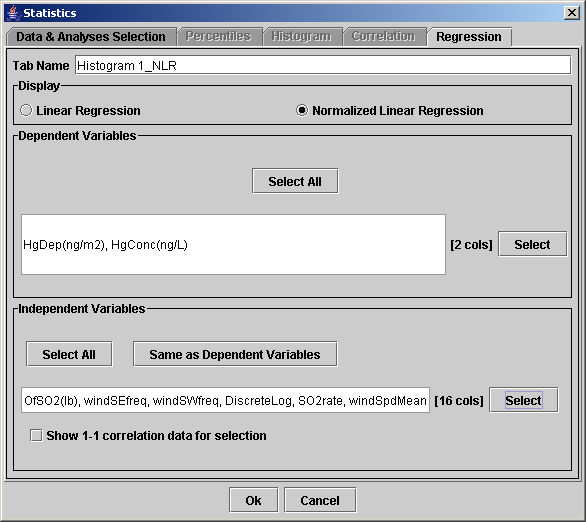
Type a name for the analysis that will appear as a table heading in the Data Table Window in the Tab Name field.
The Display group box contains the two available choices for the correlation analysis:
Linear Regression
Normalized Linear Regression
If the user chooses the normalized linear regression, the parameter values are normalized to lie in a fixed range between 0 and 1. This process is performed by subtracting the minimum from each value and then dividing the result by the range (maximum minus minimum). This approach allows analysts to quickly interpret how strongly or weakly a single independent variable affects the dependent variable.
The Dependent Variables group box shows the data columns that should be analyzed for regressions. Click the Select button in this group box to choose the columns for analysis, and the Select All button to choose all of the currently displayed (not hidden) columns. Note that the Regression function requires at least two dependent variables to be chosen to operate.
The Independent Variables group box shows the data columns that should be used for the analysis. Click the Select button in this group box to choose the columns, and the Select All button to choose all of the currently displayed (not hidden) columns. Click the Same as Dependent Variables button to copy the list chosen for the dependent variables to the independent variables list.
The Show 1-1 correlation data for selection check box is not yet functional.
Click OK to close the Statistics window and add a new tab to the Data Table Window. The new Analysis Engine Table Application table appears similar to others:
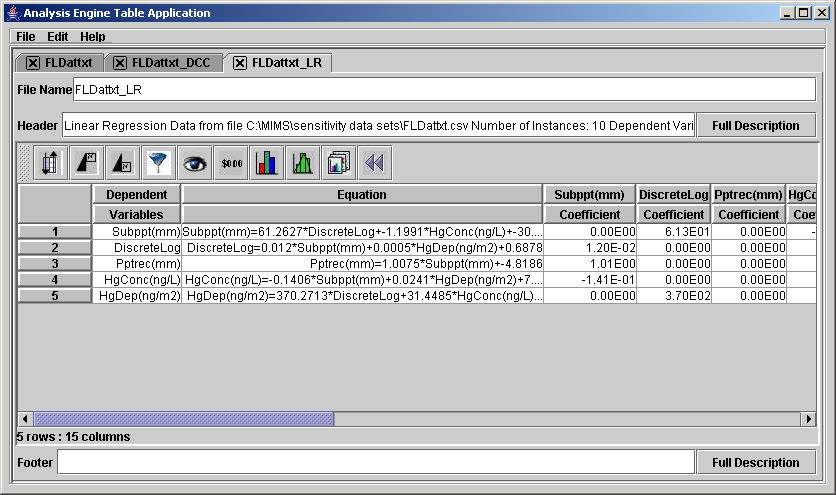
Each row lists a pairing of a dependent and an independent variable in the first two columns. The next three columns show the correlation coefficient, the slope and intercept giving the linear regression between the pair. The Equation appears in the next column, followed by the following columns:
Mean absolute error
Mean prior absolute error
Relative absolute error
Root mean square error
Root mean prior squared error
Root relative squared error
Click Cancel to close the Statistics window without making any changes.