![]()
The Statistics function enables you to describe
the distribution of a data set. Select
the Statistics (![]() ) toolbar button in the Data Table Window, the Statistics
window appears. This
interface begins on the Data & Analysis Selection tab. After
the data columns are selected and you specify that a Percentiles analysis
should be performed on the first tab, click the Percentiles
tab:
) toolbar button in the Data Table Window, the Statistics
window appears. This
interface begins on the Data & Analysis Selection tab. After
the data columns are selected and you specify that a Percentiles analysis
should be performed on the first tab, click the Percentiles
tab:
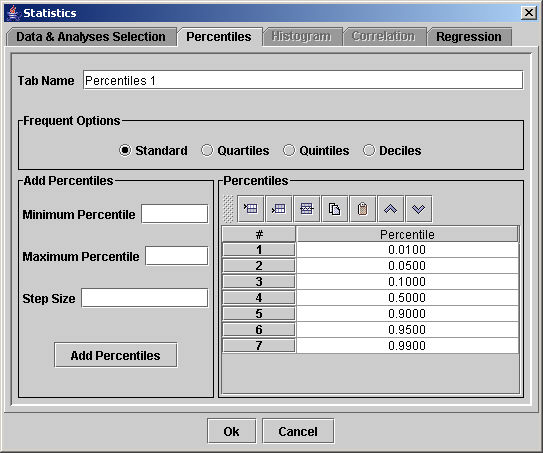
In this tool, all percentiles are fractional and range from 0 to 1.0, not from 0 to 100. Values outside the 0 to 1.0 range are not accepted. When the table is generated, the values do appear as percentiles ranging from 0 to 100%. The 0% percentile corresponds to the lowest value in the data set, and the 100% percentile to the highest value.
Type a name for the analysis that will appear as a tab heading in the Data Table Window in the Tab Name field.
The Frequent Options group box contains four distributions of the fractional percentiles selected by choosing one of the following radio buttons: Standard (0.01, 0.05, 0.10, 0.50, 0.90, 0.95, and 0.99), Quartiles (0, 0.25, 0.5, 0.75, and 1.0), Quintiles (0, 0.2, 0.4, 0.6, 0.8, and 1.0) and Deciles (0, 0.1, 0.2, 0.3, ...). When you click one of these choices, the rows in the Percentiles group box disappears and is replaced by this set of fractional percentiles.
The Add Percentiles group box allows you to populate the percentiles rows using the formula P0+nD where P0 represents the minimum percentile, D the step size, and n is a series of whole numbers. In the example above, the Minimum Percentile field is set to 0.1 so that value appears in the first row of the Percentiles table. The Step Size field is set to 0.2, so the second value is 0.1+0.2, or 0.3. The row values increase by 0.2 until they reach the specified Maximum Percentile. When you click the Add Percentiles button, the associated rows should be added to the Percentiles list box. (Note that the Add Percentiles button was not operating at the time of publication of the User Guide)
The Percentiles group box displays a row
for each fractional percentile to be analyzed. Each
row corresponds
to one row in the analysis. To
insert a new row, click on one of the row numbers to select it and the
display will change to white text on black. Then,
click the mouse on the Insert Above
(![]() ) or Insert Below
(
) or Insert Below
(![]() ) toolbar buttons to create a new row; type the percentile
value directly into the row. Click
the Delete (
) toolbar buttons to create a new row; type the percentile
value directly into the row. Click
the Delete (![]() )
toolbar button to remove the selected row(s). To
select multiple rows, hold down the Ctrl key (in MS Windows) while clicking
the additional rows. Click
the Copy (
)
toolbar button to remove the selected row(s). To
select multiple rows, hold down the Ctrl key (in MS Windows) while clicking
the additional rows. Click
the Copy (![]() ) toolbar
button to save the value in the first selected row, and click the Paste (
) toolbar
button to save the value in the first selected row, and click the Paste (![]() ) toolbar button
to place the value into the selected row(s). Click
the Up (
) toolbar button
to place the value into the selected row(s). Click
the Up (![]() ) and
Down (
) and
Down (![]() ) toolbar
buttons to move the selected row higher and lower in the table (note that
the percentile numbers must be in ascending order for the analysis to
be performed).
) toolbar
buttons to move the selected row higher and lower in the table (note that
the percentile numbers must be in ascending order for the analysis to
be performed).
Click OK to add a new tab to the Data Table Window and close the Statistics window.
Click Cancel to close the Statistics window without making any changes. The new Sort Filter Table window appears similar to others:
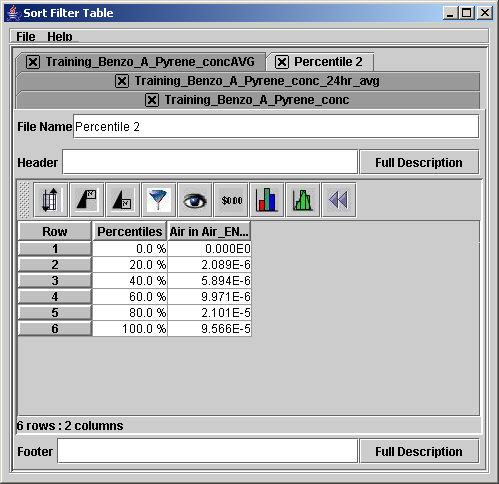
Each row lists a percentile and the value of the parameter where that percentile is exceeded. The 0% percentile corresponds to the lowest value in the data set, and the 100% percentile to the highest value.