![]()
The Statistics function enables you to describe
the distribution of a data set. Select
the Statistics (![]() ) toolbar button in the Data Table Window to present the Statistics window. This
window begins on the Data & Analyses
Selection tab. After
the data columns are selected and you specify that a Correlation analysis
should be performed on the first tab, then the Correlation
tab may be clicked:
) toolbar button in the Data Table Window to present the Statistics window. This
window begins on the Data & Analyses
Selection tab. After
the data columns are selected and you specify that a Correlation analysis
should be performed on the first tab, then the Correlation
tab may be clicked:
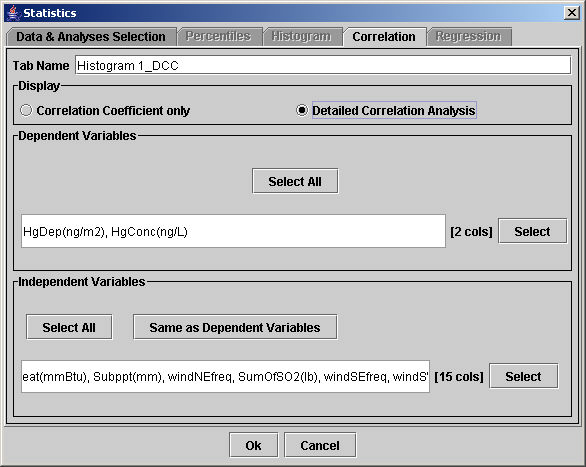
Beside the Tab Name heading, users should type a name for the analysis that will appear as a table heading in the Data Table Window.
The Display group box contains the two available choices for the correlation analysis:
Correlation Coefficient only - shows only the 1-to-1 correlation coefficient between each dependent and independent variable
Detailed Correlation Analyses - shows the 1-to-1 correlation coefficient, linear regression slope and intercept, and six error statistics between each dependent and independent variable
The Dependent Variables group box shows the data columns that should be analyzed for correlations. The Select button in this box allows you to choose the columns for analysis, and the Select All button chooses all of the currently displayed (not hidden) columns. Note that the Correlation function requires at least two dependent variables to be chosen to operate.
The Independent Variables group box shows the data columns that should be used for the analysis. The Select button in this group box allows you to choose the columns, and the Select All button chooses all of the currently displayed (not hidden) columns. The Same as Dependent Variables button copies the list chosen for the dependent variables to the independent variables list.
Click OK to add a new tab to the Data Table Window and close the Statistics window. The new tables appear similar to others:
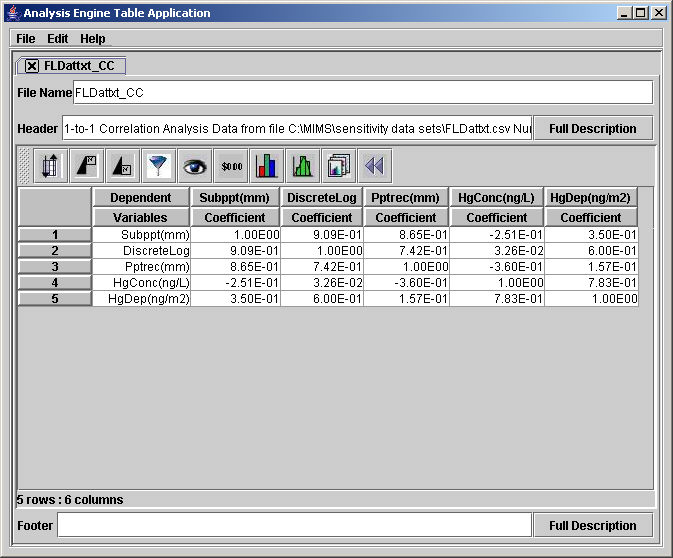
Correlation Coefficient Only (dependent variables listed in rows and independent in columns)
Detailed Correlation Analysis (each dependent-independent pairing shown in a row)
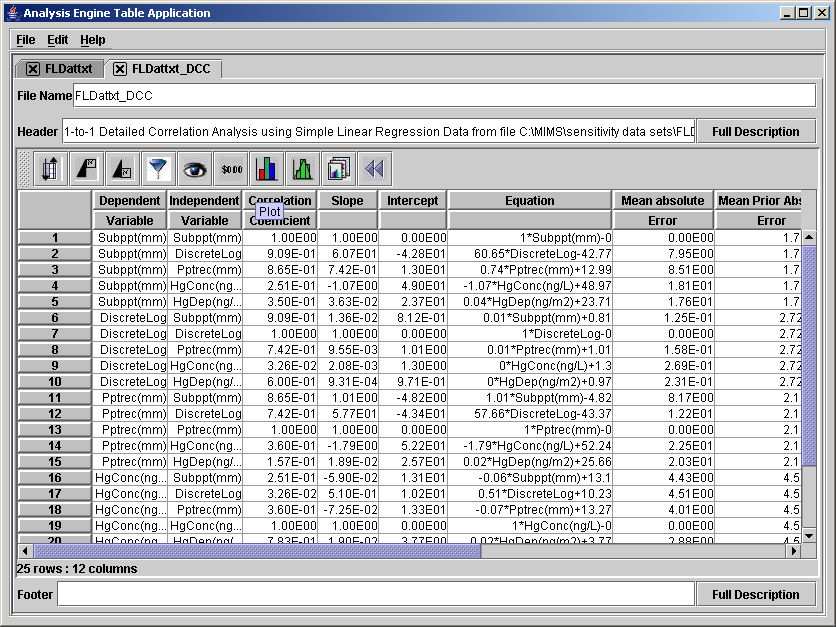
Each row in a detailed correlation analysis lists a pairing of a dependent and an independent variable in the first two columns. The next three columns show the correlation coefficient, the slope and intercept giving the linear regression between the pair. The Equation appears in the next column, followed by the following columns:
Mean absolute error
Mean prior absolute error
Relative absolute error
Root mean square error
Root mean prior squared error
Root relative squared error
Click Cancel to close the Statistics window without saving any changes.