![]()
The Statistics function enables you to describe
the distribution of a data set. When
you select the Statistics (![]() ) toolbar button in the Data Table Window, the Statistics
window appears. This
window begins on the Data & Analyses
Selection tab. After
you select the data columns and specify that a Histogram analysis should
be performed on the first tab, then click on the Histogram
tab:
) toolbar button in the Data Table Window, the Statistics
window appears. This
window begins on the Data & Analyses
Selection tab. After
you select the data columns and specify that a Histogram analysis should
be performed on the first tab, then click on the Histogram
tab:
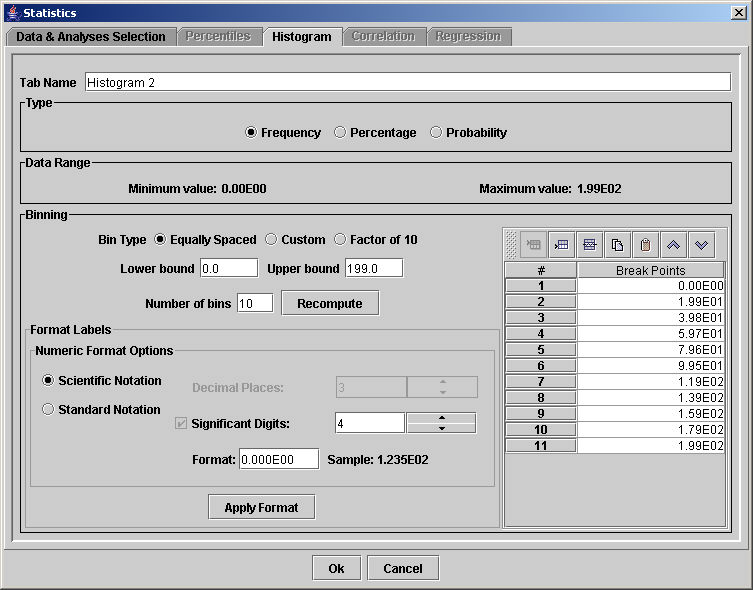
Type a name for the analysis that will appear as a table heading in the Data Table Window in the Tab Name field.
The Type group box contains the three available choices for the histogram values via the following radio buttons:
Frequency - calculates the number of cases between the break points
Percentage - calculates the percent of the cases between the break points (0-100% range)
Probability - calculates the fraction of the cases between the break points (0-1.0 range)
For reference only, the Data Range group box presents the minimum and maximum values of the actual data set.
The Binning group box contains three areas:
Binning specifications in the upper left (bin type, bounds, and number of bins)
Formatting specifications in the lower left (decimal places, scientific notation, etc.)
Break points table on the right (with buttons to change the table directly)
The binning specifications determine how the break points are set:
If you select the Equally Spaced radio button as the Bin Type, specify values in the Lower bound, Upper bound, and the Number of bins (number of steps) fields in the binning specifications, then click the Recompute button to set these equally spaced break points.
If you select the Custom radio button as the Bin Type, the break points are set manually using the toolbar above the Break Points table.
If you select the Factor of 10 radio button as the Bin Type, specify values in the Lower bound and the Number of bins (number of steps) fields in the Binning group box, then the lower bound represents the first break point (note that the lower bound may not be set to 0), and subsequent break points are each 10 times greater than their predecessors. The first break point is the upper limit for the first bin (the first bin extends from negative infinity to the first break point).
The Break Points table
displays a row for each break point to be included. Each
row corresponds to one break point in the analysis. Note
that n bins will have n+1
break points (except for the Factor of 10 bin type). The
break points can only be selected and modified when the Custom
radio button is selected in the binning specifications. To
insert a new row, click on one of the row numbers to select it and the
display will change to white text on black. Then
click the mouse on the Insert Above
(![]() ) or Insert Below
(
) or Insert Below
(![]() ) toolbar buttons to create new rows; type the break point
value directly into the box. Click
the Delete (
) toolbar buttons to create new rows; type the break point
value directly into the box. Click
the Delete (![]() )
toolbar button to remove the selected row(s). To
select multiple rows, hold down the Ctrl key (in MS Windows) while clicking
the additional rows. Click
the Copy (
)
toolbar button to remove the selected row(s). To
select multiple rows, hold down the Ctrl key (in MS Windows) while clicking
the additional rows. Click
the Copy (![]() ) toolbar
button to save the value in the first selected row, and click the Paste (
) toolbar
button to save the value in the first selected row, and click the Paste (![]() ) toolbar button
to place the value into the selected row(s). Click
the Up (
) toolbar button
to place the value into the selected row(s). Click
the Up (![]() ) and
Down (
) and
Down (![]() ) toolbar
buttons to move the selected row higher and lower in the table (note that
the break points must be in ascending order for the analysis to be performed).
) toolbar
buttons to move the selected row higher and lower in the table (note that
the break points must be in ascending order for the analysis to be performed).
Click OK button to close the Statistics window and add a new tab to the Data Table Window. The new Sort Filter Table window appears similar to others:
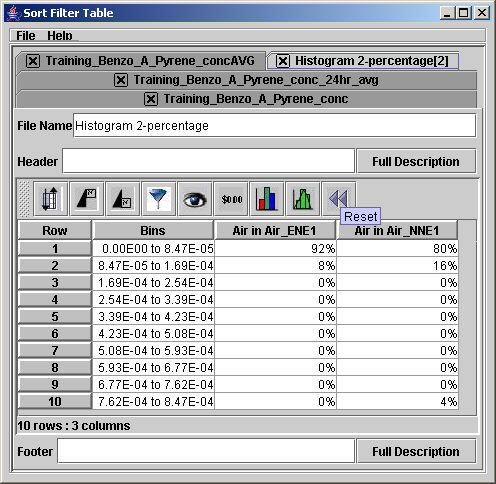
Each row lists a bin and the value of the parameter (frequency, percentage, or probability) representing the amount of data in that bin.
Click Cancel to close the Statistics window without making any changes.