![]()
The Analysis Engine allows users to examine data sets visually. It was initially developed so that environmental modelers could better evaluate their output data, but the Analysis Engine can be used to investigate many types of data sets with different formatting specifications. The tool may be used for sensitivity and uncertainty analyses, model evaluations, emissions modeling quality assurance, and general data analyses. Several statistical tools are conveniently incorporated into the Analysis Engine to assist evaluations. The tool also allows users to examine tabular model results to determine the influence of certain variables, and one of the primary reasons for its creation was to understand the error propagation produced by parameter uncertainties. However, the tools are applicable to many other data set types and analyses.
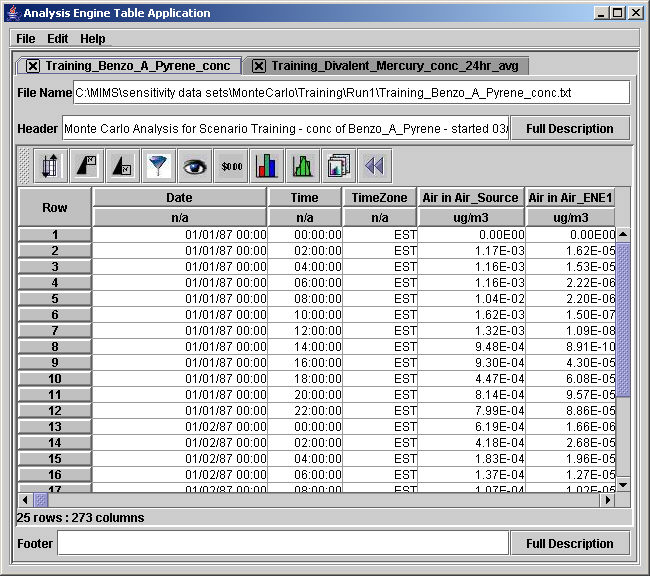
The Analysis Engine imports ASCII data files and displays them initially as tables. Click the mouse to view other tables that have been imported or analyses that have been performed.
After importing the data sets, you may examine the statistics associated with them by:
Sorting the data by any single column or group of columns
Filtering the top and bottom data from any column
Filtering the data for multiple criteria
Building scatter plots, regression plots, bar plots, box plots, time series plots, discrete category plots, histogram plots, cumulative distribution function plots, line plots, rank order plots, and tornado plots that may be exported in a number of formats (based on R statistical package)
Calculating correlation and regression coefficients
Determining percentile cutoffs
Finding the minima, maxima, means, medians, sums, standard deviations, skews, and kurtoses for any data set or subset
Establishing histogram bins
Conducting advanced data analyses using the Weka Explorer (based on Weka analysis package)
Key Features
Operates on any operating system that can use Java-based applications (e.g., MS Windows, Mac OS X, UNIX, and LINUX)
Easily imports files from environmental and other models (e.g., SMOKE, COSU Monte Carlo, TRIM.FaTE, DAVE, SMOKE, and ARRF)
Operates within the MIMS framework
Allows users to specify the number of significant digits that should be displayed
Lets you specify font styles for important data columns, as well as choose which columns to hide
Is tightly integrated with statistical and data mining tools (e.g., Weka)
Advantages over Commercial Off-the-Shelf Products
Geared toward model analysis so common tasks are facilitated
Displays file paths, file names, headers, and footers to help you track different data displays
Provides a way to export files to be read by other analysis tools
Has no limitations on the number of columns or rows in data sets
Includes computations for sensitivity analysis-related statistics (e.g., elasticity and sensitivity score) through the Colt package
Is available in an open source environment (http://sourceforge.net/projects/mimsfw)
Connects directly to EPA's Multimedia Integrated Modeling System (MIMS)
Allows you to save plot and analysis configurations to avoid repetition when similar data sets are created
Allows data entries to hold "NaN" (not a number) to represent missing data without failure of the analysis
Includes a command line interface that can be used to automate plot production
This Analysis Engine can currently import twelve different file types. Future feature requests may be submitted at the SourceForge website.
This manual is organized into five sections:
Introduction: includes installation instructions, a description of the data table window, and the command line arguments
Menu Functions: describes how to import and export data files and configurations
Toolbar Functions: describes how the tables can be sorted, filtered, and formatted
Statistics Functions: presents the statistical data analysis tools
Plotting Function: presents the instructions to create effective graphs