Progress Report
Program Compliance
Program Compliance Tables
Last updated: 06/2019
Related Figures


Highlights
ARP SO₂ Program
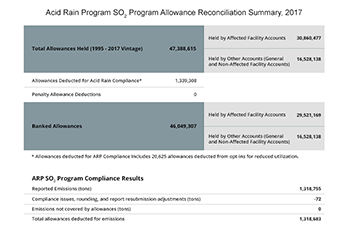
- The reported 2017 SO₂ emissions by ARP sources totaled 1,318,755 tons.
- Over 47 million SO₂ allowances were available for compliance (9 million vintage 2017 and nearly 38 million banked from prior years).
- EPA deducted just over 1.3 million allowances for ARP compliance. After reconciliation, over 46 million ARP SO₂ allowances were banked and carried forward to the 2018 ARP compliance year.
- All ARP SO₂ facilities were in compliance in 2017 (holding sufficient allowances to cover their SO₂ emissions).
CSAPR SO₂ Group 1 Program
- The reported 2017 SO₂ emissions by CSAPR Group 1 sources totaled 653,658 tons.
- Over 4.2 million SO₂ Group 1 allowances were available for compliance.
- EPA deducted over 653,000 allowances for CSAPR SO₂ Group 1 compliance. After reconciliation, over 3.6 million CSAPR SO₂ Group 1 allowances were banked and carried forward to the 2018 compliance year.
- All CSAPR SO₂ Group 1 facilities were in compliance in 2017 (holding sufficient allowances to cover their SO₂ emissions).
CSAPR SO₂ Group 2 Program
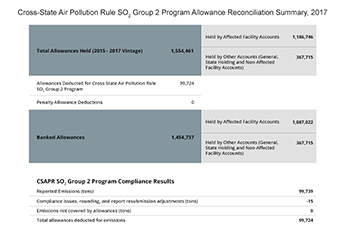
- The reported 2017 SO₂ emissions by CSAPR Group 2 sources totaled 99,739 tons.
- Over 1.5 million SO₂ Group 2 allowances were available for compliance.
- EPA deducted just under 100,000 allowances for CSAPR SO₂ Group 2 compliance. After reconciliation, over 1.4 million CSAPR SO₂ Group 2 allowances were banked and carried forward to the 2018 compliance year.
- All CSAPR SO₂ Group 2 facilities were in compliance in 2017 (holding sufficient allowances to cover their SO₂ emissions).
CSAPR NOₓ Annual Program
- The reported 2017 annual NOₓ emissions by CSAPR sources totaled 585,855 tons.
- Over 1.8 million NOₓ Annual allowances were available for compliance.
- EPA deducted just under 586,000 allowances for CSAPR NOₓ Annual compliance. After reconciliation, almost 1.3 million CSAPR NOₓ Annual allowances were banked and carried forward to the 2018 compliance year.
- One facility was out of compliance with the CSAPR NOₓ Annual program and had 44 tons of excess emissions.
CSAPR NOₓ Ozone Season Group 1 Program
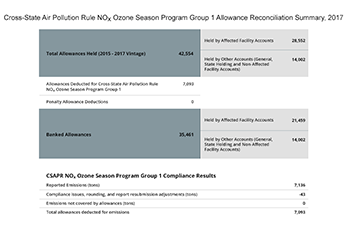
- The reported 2017 ozone season NOₓ emissions by CSAPR sources totaled 7,136 tons.
- Over 42,000 NOₓ Ozone Season Group 1 allowances were available for compliance.
- EPA deducted over 7,000 allowances for CSAPR NOₓ Ozone Season Group 1 compliance. After reconciliation, over 35,000 CSAPR NOₓ Ozone Season Group 1 allowances were banked.
- All CSAPR NOₓ Ozone Season Group 1 facilities were in compliance (holding sufficient allowances to cover their NOₓ emissions).
CSAPR NOₓ Ozone Season Group 2 Program
- The reported 2017 ozone season NOₓ emissions by CSAPR sources totaled 294,468 tons.
- Just under 412,000 NOₓ Ozone Season Group 2 allowances were available for compliance.
- EPA deducted over 294,000 allowances for CSAPR NOₓ Ozone Season Group 2 compliance. After reconciliation, over 117,000 CSAPR NOₓ Ozone Season Group 2 allowances were banked.
- All CSAPR NOₓ Ozone Season Group 2 facilities were in compliance (holding sufficient allowances to cover their NOₓ emissions).
Background Information
The year 2017 was the third year of compliance for the CSAPR SO₂ (Group 1 and Group 2), NOₓ Annual and NOₓ Ozone Season Group 1 programs, while it was the first year of compliance for the CSAPR NOₓ Ozone Season Group 2 program. Each program has its own distinct set of allowances, which cannot be used for compliance with the other programs (e.g., CSAPR SO₂ Group 1 allowances cannot be used to comply with the CSAPR SO₂ Group 2 Program).
The compliance summary emissions number cited in “Highlights” may differ slightly from the sums of emissions used for reconciliation purposes shown in the “Allowance Reconciliation Summary” figures because of variation in rounding conventions, changes due to resubmissions by sources, and compliance issues at certain units. Therefore, the allowance totals deducted for actual emissions in those figures differ slightly from the number of emissions shown elsewhere in this report.