Progress Report
Emission Reductions
Mercury and Air Toxics Figures
Last updated: 06/2019
Related Figures
Highlights
Overall Results
- Mercury and other hazardous air pollutant (HAP) emissions have declined significantly since 2010 estimates. These emission reductions were driven by the installation of new pollution controls and enhancements of existing pollution controls that reduce multiple pollutants. Emissions have also decreased due to operational changes, such as fuel switching and increased generation at natural gas-fired units that emit very little mercury and HAP. These trends are discussed in Chapter 1.
- Other programs – such as regional and state SO₂ and NOₓ emission control programs – also contributed to the mercury and other HAP emission reductions achieved by covered sources in 2017.
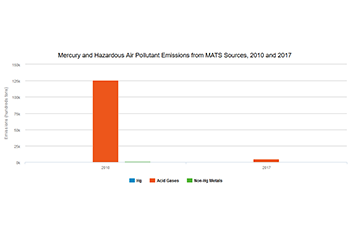
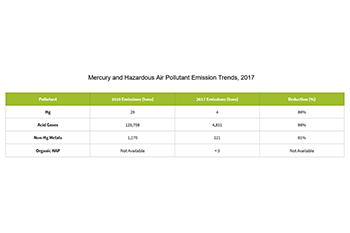
Mercury and Other Hazardous Air Pollutant Emission Trends
-
Compared to 20101, units covered under MATS in 2017 emitted
- 25 fewer tons of mercury (86% reduction),2
- 120,877 fewer tons of acid gases (96% reduction),3 and
- 949 fewer tons of non-mercury metals (81% reduction).4
Reducing Mercury Emissions from Coal-Fired Power Plants Since 2010
Over the past decade, the power sector has undergone significant changes in the mix of generating sources (e.g., coal, gas, and renewables), as well as in the prevalence of pollution control technologies. These changes have led to substantial decreases in mercury emissions, from about 29 tons in 2010 to 4 tons in 2017. These drivers are explained in more detail below.
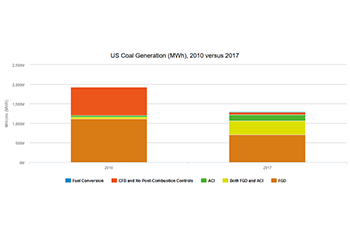
Decreasing Coal-Fired Generation
Coal-fired EGUs are the main source of mercury emissions in the power sector, so reductions in the amount of generation from coal will have an impact on power sector mercury emissions. Reductions in coal-fired generation at the EGU-level can occur in a number of ways: decreased utilization of an existing EGU, retirement of an EGU, or conversion from coal to other fuels with lower or no mercury emissions. The following trends in coal-fired generation since 2010 have contributed to the observed reduction of mercury emissions:
- Electricity generation from all coal-fired EGUs decreased by approximately one-third between 2010 and 2017.
- In 2010, nearly 10 percent of electricity generation from coal-fired EGUs was from 259 units that have since retired.
- In addition, 74 EGUs that were coal-fired in 2010 have been converted to burn natural gas or other fuel sources (which do not emit as much mercury as coal).
Controlling Mercury Emissions at Coal-Fired EGUs
Coal-fired EGUs have also installed post-combustion pollution control technologies, like activated carbon injection (ACI) and flue-gas desulfurization (FGD), to comply with air quality regulatory programs. ACI controls are designed to specifically capture mercury, while FGD are designed to reduce sulfur dioxide (SO₂) and other acid gases, but, in certain situations, can also capture mercury effectively. These technologies can work independently or in combination with other technologies to improve mercury control. Circulating fluidized bed (CFB) boilers can also reduce emissions of SO₂ through the addition of lime or limestone during the combustion process or downstream using a dry sorbent injection system. The following trends in pollution control technology have contributed to the observed reduction of mercury emissions:
- Half of all electricity generation from coal-fired EGUs in 2010 was from units that had installed a post-combustion control device, like ACI or FGD; in 2017, that share increased to more than 90 percent.
- Generation from coal-fired EGUs that had no post-combustion pollution control technology declined 91 percent between 2010 and 2017.
- In 2010, only 4 percent of coal generation was from units that reported using ACI; in 2017, that share increased to nearly 40 percent.
Background Information
Hazardous air pollutants (HAPs) emitted by power plants include mercury, acid gases (e.g., HCl, HF), non-mercury metallic toxics (e.g., arsenic, nickel, and chromium) and organic HAPs (e.g., formaldehyde, dioxin/furan). Exposure to these pollutants at certain concentrations and durations can increase chances of cancer and immune system damage, along with neurological, reproductive, developmental, respiratory, and other health problems.
In 2011, EPA issued MATS, establishing national emission standards for mercury and other hazardous air pollutants for new and existing coal- and oil-fired power plants. The standards were finalized under section 112 of the 1990 Clean Air Act amendments. The MATS emission standards were established using data from a 2010 information collection request (ICR) that was sent to selected coal- and oil- fired EGUs.
More Information
References
- Emissions from 2010 are estimated as described in Memorandum: Emissions Overview: Hazardous Air Pollutants in Support of the Final Mercury and Air Toxics Standard. EPA-454/R-11-014. November 2011; Docket ID No. EPA-HQ-OAR-2009-0234-19914.
- Certain units did not report from January-May 2017. Also, data do not include emissions from low emitting electric generating units (LEEs). Mercury emissions from 87 LEEs are estimated to be 326 pounds. Emissions from 24 additional LEEs are not available.
- Most coal- and oil- fired EGUs report emissions of SO₂ as a surrogate to demonstrate compliance with standards for the acid gas HAP. The EPA used those SO₂ emissions to estimate emission of the acid gas HAP (hydrogen chloride and hydrogen fluoride).
- Most coal- and oil- fired EGUs report emissions of filterable particulate matter (fPM) as a surrogate to demonstrate compliance with standards for the non-mercury metal HAP. The EPA used those fPM emissions to estimate emission of the non-mercury metal HAP (e.g., lead, arsenic, selenium, etc.).