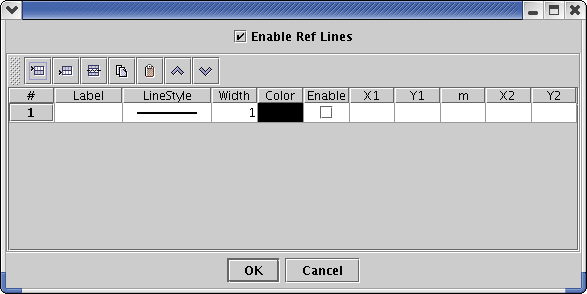
Reference Lines
Reference Lines allow you to place lines on the plot at specific
locations to mark important values. You could use these to
mark control limits or to indicate a trend line for a set of data.

Enable Reference Lines
You may turn off all reference lines by unchecking the Enable Ref Lines
box at the top of the plot.
Creating a Reference Line
Press the Insert Row button on the left side of the tool bar to insert
a row. Then double click on each cell to edit it.
Label
This is the text that you would like to
display with the reference
line. It is not required and you may leave it blank. If you choose to
edit it, you have a wide variety of choices in controlling the
properties of the displayed text. Click
here to see the options.
LineSytle
This is the style for the reference line. There are six styles from
which to choose.
Width
This is the relative line width for the reference line. The
default value is 1.0. A value of 0.5 will make the line half as
wide. A value of 2.0 will make the line twice as wide.
Color
This is the color for the reference line.
Enable
Check this box if you would like to draw this reference line. Uncheck
it if you would like remember the line, but do not want to draw it on
the current plot.
Positioning the Reference Line
There are two ways to specify where the
reference line should be
positioned and how long it should be. You may specify a slope and
point or specify two points.
Slope and Point Method
Specify a point by entering in values
in the x1 and y1 columns of the table. Specify a
slope by entering in a value in the m
column. The values that you enter must be in the coordinates of
the plot. This will draw a line all of the way across the plot.
Use "Infinity" for the slope to draw a vertical line. For example, to
draw a vertical line at x = 2.0, enter '2.0' in the x1 column, '0.0' in
the y1 column and 'Infinity' in the slope column. Use a slope of
0 to draw a horizontal line. For example, to draw a vertical line
at y = 1.0, enter '0.0' in the x1 column, '1.0' in the y1 column and
'0.0' in the slope column.
Two Points Method
This method is useful if you only want
to draw a line across part of
the plot. Specify one point but entering values in the x1 and y1 columns. Specify the second
point by entering values in the x2
and y2 columns. For
example, to draw a line from (1.0, 1.0) to (4.0, 4.0), enter '1.0' in
the x1 column, enter '1.0' in the y1 column, enter '4.0' in the x2
column and enter '4.0' in the y2 column.
