Progress Report
Air Quality
Particulate Matter Figures
Last updated: 12/2021
Related Figures
Highlights
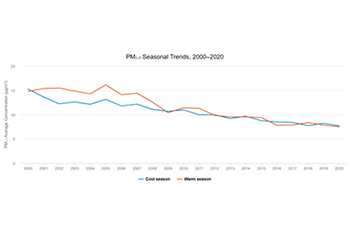
PM Seasonal Trends
- The Air Quality System (AQS) includes average PM₂.₅ concentration data for 129 sites located in the CSAPR SO₂ and annual NOₓ program region. Trend lines in PM₂.₅ concentrations show decreasing trends in both the warm months (April to September) and cool months (October to March) unadjusted for the influence of weather.
- The seasonal average PM₂.₅ concentrations have decreased by about 49 and 50 percent in the warm and cool season months, respectively, between 2000 and 2020.
Changes in PM₂.₅ Nonattainment
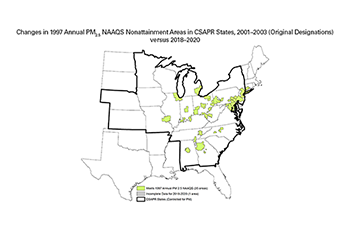
- 36 of the 39 designated nonattainment areas for the 1997 annual average PM₂.₅ NAAQS are in the eastern United States and are home to about 75 million people.1, 2 The nonattainment areas were designated in January 2005 using 2001 to 2003 data.
- Based on data gathered from 2018 to 2020, 35 of these eastern areas originally designated nonattainment have concentrations below the level of the 1997 PM₂.₅ standard (15 μg/m3), indicating improvements in PM₂.₅ air quality. One area has incomplete data.
- Given that power sector emissions are an important component of the SO₂ and annual NOₓ emission inventory and that the majority of power sector SO₂ and annual NOₓ emission reductions occurring after 2003 are attributable in part to the ARP, NBP, CAIR, and CSAPR, it is reasonable to conclude that these emission reduction programs have significantly contributed to these improvements in PM₂.₅ air quality.
Background Information
Particulate matter—also known as soot, particle pollution, or PM—is a complex mixture of extremely small particles and liquid droplets. Particle pollution is made up of several components, including acid-forming nitrate and sulfate compounds, organic compounds, metals, and soil or dust particles. Fine particles (defined as particulate matter with aerodynamic diameter < 2.5 μm, and abbreviated as PM₂.₅) can be directly emitted or can form when gases emitted from power plants, industrial sources, automobiles, and other sources react in the air.
Particle pollution—especially fine particles—contains microscopic solids or liquid droplets so small that they can get deep into the lungs and cause serious health problems. Numerous scientific studies have linked particle pollution exposure to a variety of problems, including the following: premature death; increased respiratory symptoms, such as irritation of the airways, coughing, or difficulty breathing; decreased lung function; aggravated asthma; development of chronic bronchitis; irregular heartbeat; and nonfatal heart attacks.3, 4, 5
Particulate Matter Standards
The CAA requires EPA to set NAAQS for particle pollution. In 1997, EPA set the first standards for fine particles at 65 micrograms per cubic meter (µg/m3) measured as the three-year average of the 98th percentile for 24-hour exposure, and at 15.0 μg/m3 for annual exposure measured as the three-year annual mean. EPA revised the air quality standards for particle pollution in 2006, tightening the 24-hour fine particle standard to 35 μg/m3 and retaining the annual fine particle standard at 15.0 μg/m3. In December 2012, EPA strengthened the annual fine particle standard to 12.0 μg/m3.
CSAPR was promulgated to help downwind states in the eastern United States achieve the 1997 annual average PM₂.₅ NAAQS and the 2006 24-hour PM₂.₅ NAAQS; therefore, analyses in this report focus on those standards.
Changes in PM₂.₅ Nonattainment Areas
In the eastern US, recent data indicate that no areas are violating the 1997 or 2006 PM₂.₅ NAAQS. One area in the eastern US (Allegheny County, PA) is violating the 2012 annual PM₂.₅ NAAQS. The majority of SO₂ and annual NOₓ emission reductions in the power sector that occurred after 2003 are attributable to the ARP, NBP, CAIR, and CSAPR. As power sector emissions are an important component of the SO₂ and annual NOₓ emission inventory, it is reasonable to conclude that these emission reduction programs have significantly contributed to these improvements in PM₂.₅ air quality.
More Information
- Air Quality System (AQS)
- National Ambient Air Quality Standards
- Particulate Matter (PM) Pollution
- Sulfur Dioxide (SO₂) Pollution
- Nitrogen Oxides (NOₓ) Pollution
- Nonattainment Areas
- EPA’s Clean Air Market Programs
- EPA’s 2020 National Air Quality Trends Report
References
- 40 CFR Part 81. Designation of Areas for Air Quality Planning Purposes.
- U.S. Census. (2010).
- Dockery, D.W., Speizer F.E., Stram, D.O., Ware, J.H., Spengler, J.D., & Ferris Jr., B.G. (1989). Effects of inhalable particles on respiratory health of children. American Review of Respiratory Disease 139: 587–594.
- Schwartz, J. & Lucas, N. (2000). Fine particles are more strongly associated than coarse particles with acute respiratory health effects in school children. I 11: 6–10.
- Bell, M.L., Dominici, F., Ebisu, K., Zeger, S.L., & Samet, J.M. (2007). Spatial and temporal variation in PM₂.₅ chemical composition in the United States for health effects studies. Environmental Health Perspectives 115: 989–995.