Progress Report
Market Activity
Market Activity Figures
Last updated: 12/2019
Related Figures
Highlights
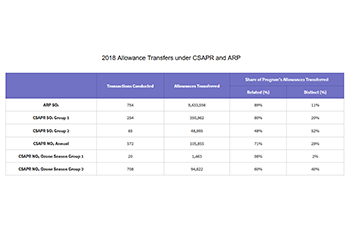
Transaction Types and Volumes
- In 2018, more than 600,000 allowances were traded across all five of the CSAPR trading programs.
- Just over one-quarter of the transactions within the CSAPR programs were between distinct organizations.
- In 2018, over 9 million ARP allowances were traded, the majority (89 percent) between related organizations.
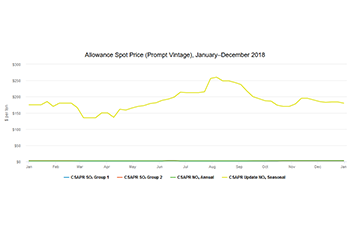
2018 Allowance Prices1
- The ARP SO₂ allowance prices averaged less than $1 per ton in 2018.
- The CSAPR SO₂ Group 1 allowance prices started 2018 at $2.13 per ton and remained at the level at the end of the year.
- The CSAPR SO₂ Group 2 allowance prices started 2018 at $2.63 per ton and ended 2018 at $2.56 per ton.
- The CSAPR NOₓ annual program allowances started 2018 at $2 per ton and ended 2018 at $2.88 per ton.
- The CSAPR NOₓ ozone season program allowances started 2018 at $175 per ton and ended 2018 at $180 per ton.2
- Allowance prices as reported by S&P Global Market Intelligence, 2019.
- These prices reflect the CSAPR Update ozone season NOₓ allowances. In October 2016, EPA published an update to the CSAPR ozone season allowance trading programs. On October 26th, 2016, most CSAPR ozone season NOₓ allowances were converted to the CSAPR Update ozone season NOₓ allowances.
Background Information
Transaction Types and Volumes
Allowance transfer activity includes two types of transfers: EPA transfers to accounts and private transactions. EPA transfers to accounts include the initial allocation of allowances by states or EPA, as well as transfers into accounts related to set-asides. This category does not include transfers due to allowance retirements. Private transactions include all transfers initiated by authorized account representatives for any compliance or general account purposes.
To better understand the trends in market performance and transfer history, EPA classifies private transfers of allowance transactions into two categories:
- Transfers between separate and unrelated parties (distinct organizations), which may include companies with contractual relationships (such as power purchase agreements) but excludes parent-subsidiary types of relationships.
- Transfers within a company or between related entities (e.g., holding company transfers between a facility compliance account and any account held by a company with an ownership interest in the facility).
While all transactions are important to proper market operation, EPA follows trends in transactions between distinct economic entities with particular interest. These transactions represent an actual exchange of assets between unaffiliated participants, which reflect companies making the most of the cost-minimizing flexibility of emission trading programs. Companies accomplish this by finding the cheapest emission reductions not only among their own generating assets, but across the entire marketplace of power generators.
Allowance Markets
The 2018 emissions were below emission budgets for the Acid Rain Program (ARP) and for all five Cross-State Air Pollution Rule (CSAPR) programs. As a result, the CSAPR allowance prices were well below the marginal cost for reductions projected at the time of the final rule, and are subject, in part, to downward pressure from the available banks of allowances.