Progress Report
Ecosystem Response
Ecosystem Health Figures
Last updated: 01/2023
Related Figures
Highlights
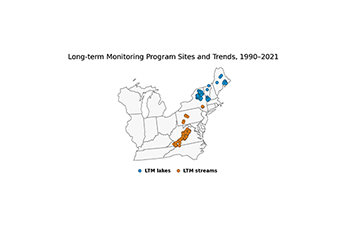
Regional Trends in Water Quality
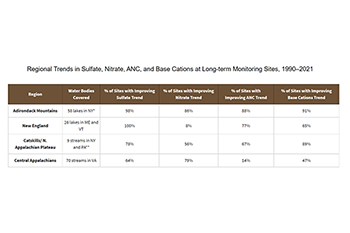
- Between 1990 and 2021, improved lake and stream health was demonstrated by significant decreasing trends in sulfate concentrations in water at all long-term monitoring (LTM) program lake and stream monitoring sites in New England, the Adirondacks, and the Catskill mountains.
- On the other hand, between 1990 and 2021, streams in the central Appalachian region have experienced mixed results due in part to their soils and geology. Only 64 percent of monitored streams show lower sulfate concentrations (and statistically significant trends), while 4 percent show increased sulfate concentrations.
- Nitrate concentrations and trends are highly variable and many sites do not show consistent improving trends between 1990 and 2021, despite reductions in NOₓ emissions and inorganic nitrogen deposition.
- In 2021, levels of acid neutralizing capacity (ANC), a key indicator of aquatic ecosystem recovery from acidification, have increased significantly from 1990 in lake and stream sites in the Adirondack Mountains, New England, and the Catskill mountains. In the central Appalachian region, sites with increasing ANC remain low at 14 percent.
Ozone Impacts on Forests
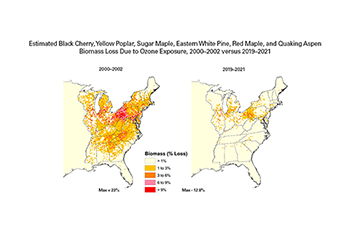
- Between 2000–2002 and 2019–2021, the area in the eastern U.S. with combined biomass loss > 2 percent, 5 percent, and 10 percent for the forest decreased from 35 percent to 4.5 percent, 8.7 percent to 0.5 percent, and 1.7 percent to 0.1 percent, respectively, for seven tree species combined – black cherry, yellow poplar, sugar maple, eastern white pine, Virginia pine, red maple, and quaking aspen. This is an improvement of over 90 percent.
- For black cherry and yellow poplar individually (the tree species most sensitive to ground-level ozone), the total land area in the eastern U.S. with significant biomass loss decreased from 17 percent to 4 percent for black cherry, and from 5.6 percent to 0 percent for yellow poplar between 2000–2002 and 2019–2021.
- For the period 2019–2021, total land area in the eastern U.S. with significant biomass loss for the remaining five species combined (red maple, sugar maple, quaking aspen, Virginia pine, and eastern white pine) is now zero. This is in contrast to 6.9 percent for the period of 2000–2002.
- While this change in biomass loss cannot be exclusively attributed to the implementation of the NBP, CAIR, CSAPR, CSAPR Update, and Revised CSAPR Update, it is likely that NOₓ ozone season emission reductions achieved under these programs, and the corresponding decreases in ozone concentration, contributed to this environmental improvement.
Background Information
Acidified Surface Water Trends
Acidified precipitation can impact lakes and streams by mobilizing toxic forms of aluminum from soils, (particularly in clay rich soils) and/or by lowering the pH of the water, harming fish and other aquatic wildlife. In a healthy well-buffered lake or stream, decreased acid deposition would be reflected by decreasing trends in surface water acidity. Four chemical indicators of aquatic ecosystem response to emission changes are presented here: trends in sulfate and nitrate anions, acid neutralizing capacity (ANC), and sum of base cations. Improvement in surface water status is generally indicated by decreasing concentration of sulfate and nitrate anions and increasing base cations and ANC. The following is a description of each indicator:
- Sulfate is the primary anion in most acid-sensitive waters and has the potential to acidify surface waters (lower the pH) and leach base cations and toxic forms of aluminum from soils, leaving soils depleted of their ability to neutralize acidic inputs.
- Nitrate has the potential to acidify surface waters. However, nitrogen is an important nutrient for plant and algae growth, and most of the nitrogen inputs from deposition are quickly taken up by plants and algae, leaving less in surface waters.
- ANC is a key indicator of ecosystem recovery and is a measure of overall buffering capacity of surface waters against acidification; it indicates the ability to neutralize strong acids that enter aquatic systems from deposition and other sources.
- Base cations neutralize both sulfate and nitrate anions, thereby preventing surface water acidification. Base cation availability is largely a function of underlying geology, soil type, and the vegetation community. Surface waters with fewer base cations are more susceptible to acidification.
In the central Appalachian region, some watersheds have soils which have also accumulated and stored sulfate over the past decades of high sulfate deposition. As a result, the substantial decrease in acidic deposition has not yet resulted in comparably lower sulfate concentrations in many of the monitored Appalachian streams. A combination of low base cation availability and stored sulfate in the soils means that stream sulfate concentrations in some areas are not changing, or may be increasing, as the stored sulfate slowly bleeds out without adequate base cation concentrations to neutralize sulfate anions.1
Surface Water Monitoring Networks
In collaboration with other federal and state agencies and universities, EPA administers the LTM program, which provides information on the impacts of acidic deposition on otherwise pristine lakes and streams. This program is designed to track changes in surface water chemistry in the four regions sensitive to acid rain in the eastern U.S.: New England, the Adirondack Mountains, the Northern Appalachian Plateau, and the central Appalachians (the Valley, Ridge, and Blue Ridge geologic provinces).
Forest Health
Ground-level ozone is one of many air pollutants that can alter a plant’s health and ability to reproduce and can make the plant more susceptible to disease, insects, fungus, harsh weather, and other environmental stressors. These impacts can lead to changes in the biological community, both in the diversity of species and in the health, vigor, and growth of individual species. As an example, many studies have shown that ground-level ozone reduces the health of commercial and ecologically important forest tree species throughout the U.S.2, 3 By looking at the distribution and abundance of seven sensitive tree species and the level of ozone at particular locations, it is possible to estimate reduction in growth – or biomass loss – for each species. The EPA evaluated biomass loss for seven common tree species in the eastern U.S. that have a higher sensitivity to ozone (black cherry, yellow poplar, sugar maple, eastern white pine, Virginia pine, red maple, and quaking aspen) to determine whether decreasing ozone concentrations are reducing biomass loss in forest ecosystems.
More Information
References
- Burns, D.A., Lynch, J.A., Cosby, B.J., Fenn, M.E., & Baron, J.S. (2011). National Acid Precipitation Assessment Program Report to Congress 2011: An Integrated Assessment. U.S. EPA, National Science and Technology Council, Washington, D.C.: 114 p
- Chappelka, A.H. & Samuelson, L.J. (1998). Ambient ozone effects on forest trees of the eastern United States: A review. New Phytologist 139: 91–108.
- Ollinger, S.V., Aber, J.D., & Reich, P.B. (1997). Simulating ozone effects on forest productivity: interactions among leaf-canopy and stand-level processes. Ecological Applications 7(4), 1237–1251.