Progress Report
Affected Communities
Regulatory programs implemented under the Clean Air Act to reduce emissions in the power sector have delivered substantial air quality improvements since the first nationwide program was implemented decades ago.1 However, fossil fuel-fired power plants continue to be a leading source of ozone- and particulate-forming pollution, impacting our communities, lands, and waterways.
Environmental hazards can be inequitably distributed in the U.S., with people of color and low-income populations consistently bearing a disproportionate burden of environmental pollution in some areas.2 Further, climate change impacts human health through increasing concentrations of ambient air pollutants, including ground-level ozone.3 In this chapter of the Progress Report, we examine the results of the EPA’s power sector programs through an environmental justice lens to better understand the impacts of those programs on changes in emissions at plants located near disadvantaged communities.
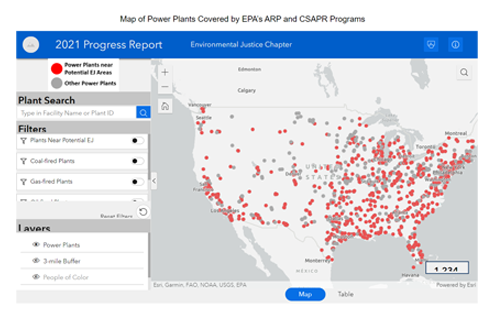
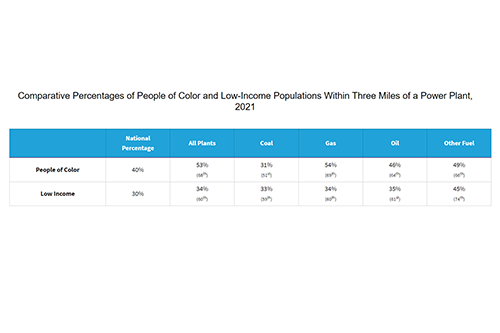
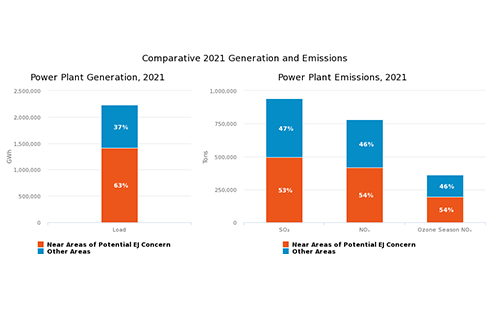
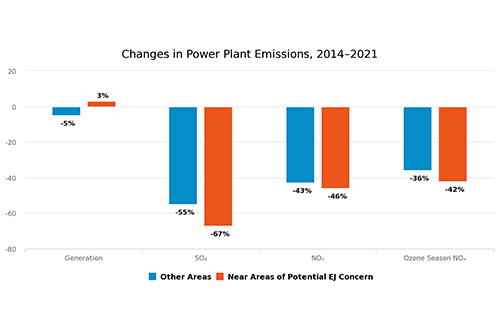
We draw on detailed air emissions data that EPA collects from power plants across the country to provide three types of analyses.4 First, we estimate the U.S. population living within three miles of a power plant and characterize the demographics in those areas.5 Second, we compare 2021 emissions from plants located near areas of potential environmental justice (EJ) concern to emissions from all other plants. Lastly, we present emission trends associated with these plants from 2014, prior to implementation of the Cross-State Air Pollution Rule (CSAPR), through 2021. These analyses rely on approaches established by EPA’s environmental justice screening and mapping tools, including EJScreen, which provides a nationally consistent approach for combining environmental and demographic indicators to highlight places that may have higher environmental burdens and vulnerable populations.
This chapter focuses on the people who live within three miles of the power plants regulated under EPA’s Acid Rain Program (ARP) and three CSAPR programs.6 At this time, it does not consider other pollution sources which may contribute to a disproportionate environmental burden for some people, nor does it consider the people who live more than three miles from each plant and who may be affected by air pollution from these facilities.
- For more information about reductions in emissions and improved air quality, see the emissions reductions chapter of the Progress Report.
- See, for example, Cole, L. W., & Foster, S. R. (2001). From the ground up: Environmental racism and the rise of the environmental justice movement (Vol. 34). NYU Press; Jbaily, A., Zhou, X., Liu, J., Lee, T. H., Kamareddine, L., Verguet, S., & Dominici, F. (2022). Air pollution exposure disparities across US population and income groups. Nature, 601(7892), 228-233; and Liu, J., Clark, L. P., Bechle, M. J., Hajat, A., Kim, S. Y., Robinson, A. L., ... & Marshall, J. D. (2021). Disparities in air pollution exposure in the United States by race/ethnicity and income, 1990–2010. Environmental Health Perspectives, 129(12), 127005.
- Nolte, C.G., Dolwick, P.D., Fann, N., Horowitz, L.W., Naik, V., Pinder, R.W., Spero, T.L., Winner, D.A., Ziska, L.H. (2018a). Air Quality. In Impacts, Risks, and Adaptation in the United States: Fourth National Climate Assessment, Volume II, U.S. Global Change Research Program, Washington, DC.
- The most recent annual emissions data are from 2021.
- U.S. Census. (2020).
- These are power plants that combust fossil fuels to generate electricity and emit air pollution. CSAPR refers to the Cross-State Air Pollution Rule (CSAPR), the CSAPR Update, and the Revised CSAPR Update programs.
Affected Communities Figures