Progress Reports
The 2022 Progress Report has moved! Click here to access.
Power Sector Programs – Progress Report
The Power Sector Programs Progress Report provides annual updates on EPA’s regulatory programs to reduce emissions in the power sector. Part 1, Program Implementation, Compliance, and Emissions Trends, released in July, 2022, covers program basics, and provides annual updates on pollution controls, monitoring methods, and changes in emissions. Part 2, Environmental Results and Affected Communities, covers the air quality and ecosystem response to these reductions, and also features a new section on community impacts.
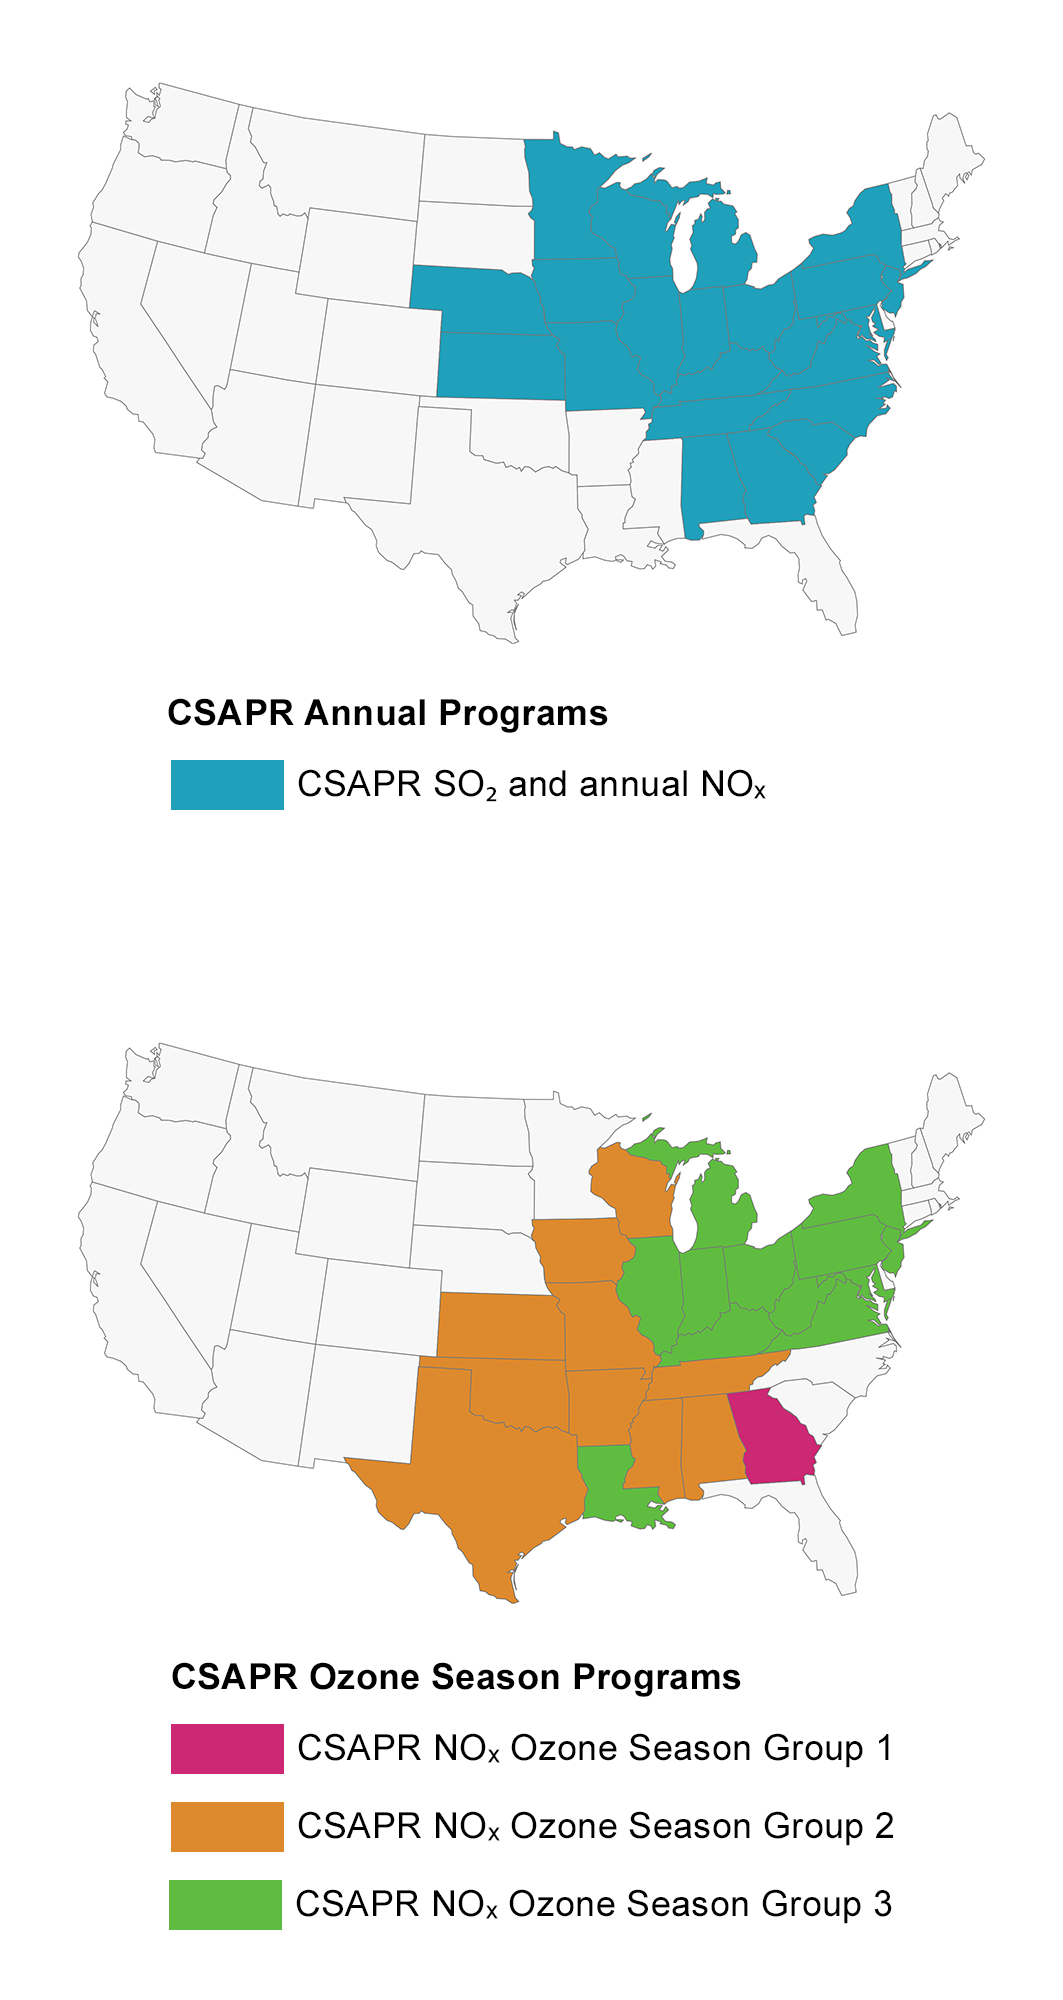
Under the Clean Air Act, EPA implements regulations to reduce emissions from power plants, including the Acid Rain Program (ARP), the Cross-State Air Pollution Rule (CSAPR), the CSAPR Update, the Revised CSAPR Update, and the Mercury and Air Toxics Standards (MATS). These programs require fossil fuel-fired electric generating units to reduce emissions of sulfur dioxide (SO₂), nitrogen oxides (NOₓ), and hazardous air pollutants including mercury (Hg) to protect human health and the environment. This reporting year marks the seventh year of CSAPR implementation, the fifth year of the CSAPR Update implementation, the first year of Revised CSAPR Update implementation, the twenty-seventh year of the ARP, and the fifth year of MATS implementation. This report summarizes annual progress through 2021, highlighting data that EPA systematically collects on emissions for all power plant programs and on compliance for the ARP and the CSAPR programs. Commitment to transparency and data availability is a hallmark of these programs and a cornerstone of their success.
SO₂, NOₓ, and hazardous air pollutants (HAPs), including mercury, are fossil fuel combustion byproducts that affect public health and the environment. SO₂ and NOₓ, and their sulfate and nitrate byproducts, are transported downwind and deposited as acid rain which can be harmful to sensitive ecosystems in many areas of the country. These pollutants also contribute to the formation of fine particles (sulfates and nitrates) and ground-level ozone that are associated with significant human health effects and regional haze. Atmospheric mercury deposition accumulates in fish to levels of concern for human health and the health of fish-eating wildlife.
The ARP, CSAPR, CSAPR Update, Revised CSAPR Update, and MATS have delivered substantial reductions in power sector emissions of SO₂, NOₓ, and hazardous air pollutants, along with significant improvements in air quality and the environment. In addition to the requirement of the power sector emission control programs described in this report, a variety of power industry trends have contributed to further declines of SO₂, NOₓ, and hazardous air pollutant emissions.
EPA data in this report are current as of March 2023 and reflects 2021 data. Data may differ from past or future reports because of data resubmissions by sources and ongoing data quality assurance activities.
Read historical reports of EPA's Power Sector ProgramsProgram Implementation, Compliance, and Emissions Trends
Environmental Results and Affected Communities
2021 Program Implementation, Compliance, and Emissions Trends
at a Glance
- Annual SO₂ emissions:
CSAPR – 592,000 tons (93 percent below 2005)
ARP – 936,000 tons (94 percent below 1990) - Annual NOₓ emissions:
CSAPR – 440,000 tons (80 percent below 2005)
ARP – 763,000 tons (85 percent below 2000) - CSAPR ozone season NOₓ emissions: 242,000 tons (46 percent below 2015)
- Compliance: 100 percent compliance for power plants in the market-based ARP and CSAPR allowance trading programs.
- Emissions reported under MATS:
Mercury – 3.0 tons (90 percent below 2010)
2021 Environmental Results and Affected Communities
at a Glance
- Ambient particulate sulfate concentrations: The eastern United States has shown substantial improvement, decreasing 76 to 79 percent from 2000-2002 to 2019–2021.
- Ozone NAAQS attainment: Based on 2019-2021 data, 19 of the 22 areas in the East originally designated as nonattainment for the 2008 ozone NAAQS are now meeting the standard, while the remaining three areas have shown improvement.
- PM₂.₅ NAAQS attainment: Based on 2019-2021 data, all 16 areas in the East originally designated as nonattainment for the 2006 24-hour PM₂.₅ NAAQS are now meeting the standard.
- Affected communities: Program evaluation through an environmental justice lens shows more disadvantaged people living near power plants with higher emissions, and a greater overall emission reduction trend in areas of potential environmental justice concern.
- Wet sulfate deposition: All areas of the eastern U.S. have shown significant improvement with an overall 71 percent reduction in wet sulfate deposition from 2000-2002 to 2019–2021.
- Levels of acid neutralizing capacity (ANC): This indicator of aquatic ecosystem recovery improved (i.e., increased) significantly from 1990 levels at lake and stream monitoring sites in the Adirondack region, New England, and the Catskill mountains.