Progress Report
Affected Communities
Affected Communities
Source: EPA, 2023
Last updated: 03/2023
Related Figures
Highlights
People Living Near Power Plants
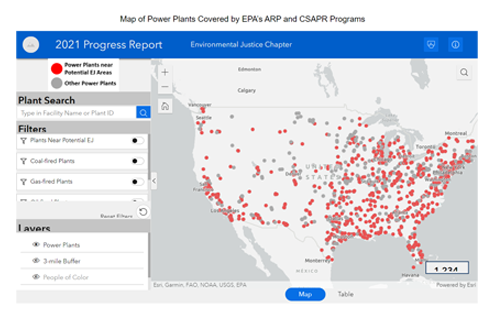
- Proximity analysis is a frequently used approach to examine impacts on people who reside in areas that may be impacted by a pollution source. In 2021, over 1,200 fossil fuel-fired power plants were covered under the ARP and CSAPR programs. Of the 329.3 million people in the contiguous United States (excluding Alaska, Hawaii, Puerto Rico and other U.S. territories), 10 percent live within three miles of one or more of these power plants.1 Most of that population (greater than 8 percent) live near a plant fueled by natural gas. Less than 2 percent live near other types of fossil fuel-fired facilities, such as coal-fired or oil-fired power plants, which are typically higher-emitting (see Figure 1).
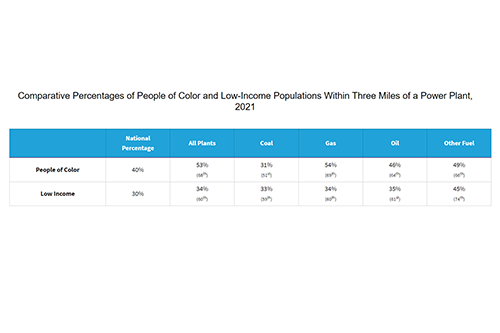
- The federal government has long recognized the heightened vulnerability of people of color and low-income2 individuals to environmental pollutants. EPA compared the percentages of people of color and low-income populations living within three miles of these power plants to the national average and found that there is a greater percentage of people of color and low-income individuals living near power plants than in the rest of the country on average. According to 2020 census data, on average, the U.S. population is comprised of 40 percent people of color and 30 percent low-income individuals. In contrast, the population living near fossil fuel-fired power plants is comprised of 53 percent people of color and 34 percent low-income individuals. For higher-emitting coal plants, the average population of people of color and low-income is slightly higher than the national average percentages. Figure 2 summarizes the percentages and national percentiles3 for people of color and low-income populations.
- The rest of this chapter takes a closer look at the emissions associated with plants that are located near areas of potential EJ concern. In the following analyses, those plants include any that are located within three miles of at least one census block group4 where the population is characterized by either a relatively high5 people of color or low-income population, based on data available in EPA’s EJScreen. As shown in Figure 1, 886 power plants (72%) were located near areas of potential EJ concern in 2021.6
Emissions Affecting People Living Near Power Plants
- This section focuses on 2021 sulfur dioxide (SO2) and nitrogen oxide (NOX) emissions from plants located near areas of potential EJ concern. Sulfur dioxide is a highly reactive gas that is generated primarily from coal-fired power plants. In addition to contributing to the formation of acid rain and fine particle pollution, SO2 emissions are linked to many adverse human health effects. Nitrogen oxide emissions contribute to the formation of ground-level ozone and fine particle pollution, which cause a variety of adverse health effects, including decreased lung function, aggravated asthma, and premature death.
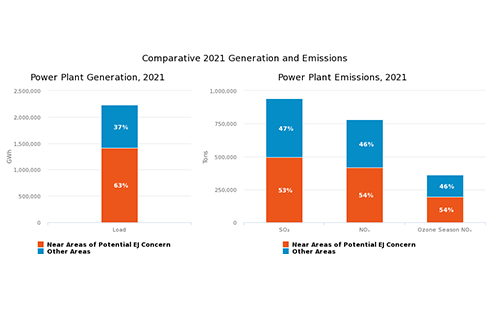
- The majority of the 2021 electricity generation from all ARP and CSAPR power plants comes from plants located near areas of potential EJ concern (63 percent). A measure of power plant output, like electricity generation (i.e., the amount of electricity produced), may often be more informative than comparing the number of plants and can give a sense of scale to comparisons between different groups of plants or when comparing changes across time periods. This group of plants is also responsible for a larger share of emissions near areas of potential EJ concern: 53 percent of SO2 emissions and 54 percent of annual and ozone season (May 1-September 30) NOX emissions (see Figure 3).
Emissions Trends: 2014–2021
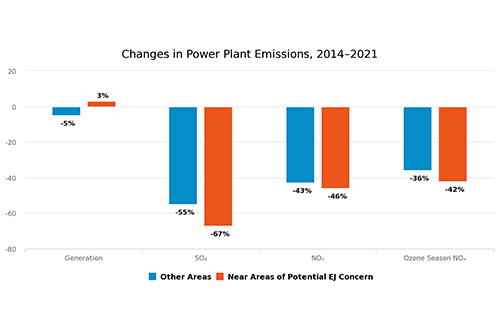
- EPA analyzed emission trends between 2014 and 2021 for the ARP and CSAPR power plants. During this time, the percent reduction in total net SO2 and NOX emissions was greater at the group of plants located near areas of potential EJ concern than for all other plants. On average, SO2 emission reductions decreased by 67 percent at the plants located near areas of potential EJ concern, compared to a 55 percent reduction from all other plants. Annual NOX and ozone season NOX emissions decreased by 46 percent and 41 percent, respectively, from plants near areas of potential EJ concern. At all other plants annual NOX emissions decreased by 43 percent and ozone season NOX emissions decreased by 36 percent. Annual NOX and ozone season NOX emissions decreased by 46 percent and 41 percent, respectively, from plants near areas of potential EJ concern. This is slightly greater than the percent reduction in those pollutants at all other plants, where annual NOX emissions decreased by 43 percent and seasonal NOX emissions decreased by 36 percent (see Figure 4).
Conclusion
- This chapter of the Progress Report combines publicly available emissions data with information in EJScreen and contributes to our understanding of the relationship between the power sector and nearby areas of potential EJ concern. The intent of this report is to focus on emissions at the fossil-fired power plants in the contiguous U.S. which are covered by EPA’s regulatory programs developed to reduce acid rain and cross-state transport of particulate matter and ozone and relate those emissions to nearby areas. It does not yet consider the aggregate of all pollutants affecting these areas. Additionally, unlike EPA’s regulatory analyses, this chapter does not consider the ability of emissions to travel more than three miles and combine with other pollutants. These considerations are important to evaluating the full impact of the fossil-fuel fired power plants in the U.S.
- The chapter provides a first step toward that evaluation and consists of three analyses:
- First, EPA looked within three miles of each power plant regulated under EPA’s ARP and CSAPR programs and found that 10 percent of people in the contiguous U.S. live within three miles of a power plant. These are mostly gas-fired power plants, with less than 2 percent of the population living near coal- or oil-fired plants. Compared to the national average, the population living near power plants is characterized by a higher percentage people of color and low-income population.
- Next, looking carefully at each census block group within a three-mile radius, EPA found that most of these power plants are located nearby at least one area of potential EJ concern.7 These plants were responsible for 53 percent of SO2 emissions and 54 percent of both annual and ozone season NOX emissions in 2021.
- Finally, the third analysis found that aggregate emission trends between 2014 and 2021 show a greater percent reduction in pollutants from plants located near areas of potential EJ concern, compared to all other ARP and CSAPR plants. Specifically, SO2 emissions decreased by 67 percent at the plants located near areas of potential EJ concern, compared to a 55 percent reduction from all other plants. Annual NOX and ozone season NOX emissions decreased by 46 percent and 41 percent, respectively, from plants near areas of potential EJ concern. At all other plants annual NOX emissions decreased by 43 percent and ozone season NOX emissions decreased by 36 percent.
- While EPA’s programs have been effective in achieving overall emissions reductions, there is clearly more to do, both to address the adverse health outcomes and environmental harms associated with power plant emissions and, importantly, to advance the fair distribution of air quality and human health benefits from EPA’s emission reduction programs. We are dedicated to continuous progress toward these goals. EPA will continue to assess the results of existing and future power plant emissions reduction programs through a demographic lens. Future analyses will build upon the findings presented in this chapter.
- EPA invites your feedback. We would like to make this work accessible and useful to as many people as possible and welcome your ideas about how to do so. The data informing these analyses can be found here. We also encourage you to explore our tools, such as Power Plants and Neighboring Communities, and access the wealth of additional public data, interactive maps, graphs, and other resources available through our website.
Background Information
Background Information
EPA conducted three analyses:
- People living near power plants – EPA mapped the power plants in the contiguous U.S., estimated the U.S. population living within three miles of a power plant, and identified areas of potential EJ concern using two demographic indicators: people of color and low-income. EPA defined an area as being of potential EJ concern if, on average, either or both indicators showed a population greater than or equal to the 80th percentile on a national basis.
- Emissions affecting people living near power plants – Drawing on detailed 2021 air emissions data collected from power plants across the country, EPA compared emissions from plants located near areas of potential EJ concern to emissions from all other plants.
- Emissions trends: 2014-2021 – Looking at the time period from 2014, prior to implementation of CSAPR, through 2021, EPA compared emission trends from power plants located near areas of potential EJ concern to emissions trends from all other plants.
More Information
- Environmental Justice Screening and Mapping Tool (EJ Screen)
- Power Plants and Neighboring Communities
- Power Sector Emissions, Operations, and Environmental Data
References
- It is important to note that the impacts of power plant emissions are not limited to a three-mile radius. Because pollution can travel over long distances from a power plant, the impacts of both potential increases and decreases in power plant emissions can be felt many miles away, meaning that the air quality in a community can be due to far-distant sources as well as those sited within a community. Still, being aware of the characteristics of communities closest to power plants is a starting point in understanding the potential sources of pollution that may impact a community and how changes in a power plant’s air emissions may affect the air quality experienced by some of those already vulnerable to environmental burdens.
- EJScreen defines people of color as the percent of individuals in a block group who list their racial status as a race other than white alone and/or list their ethnicity as Hispanic or Latino (all people other than non-Hispanic white-alone individuals). The word "alone" in this case indicates that the person is of a single race, not multiracial. EJScreen defines low-income as the percent of a block group’s population in households where the household income is less than or equal to twice the federal "poverty level."
- Percentiles are a way to see how areas of interest compare to everywhere else in the U.S. The national percentile indicates what percent of the U.S. population has an equal or lower value, e.g., a lower percent of people of color or low-income population.
- Census block groups are statistical divisions of census tracts and are generally defined as containing between 600 and 3,000 people.
- In this report, we define “relatively high” to include percentile values greater than or equal to the 80th percentile on a national basis. This threshold is applied here as a starting point for the purpose of identifying geographic areas that may warrant further consideration, analysis, or outreach. The application of this threshold in this report is not intended to determine the existence or absence of EJ concerns or designate an area as an “EJ community.” Rather, the intent of this report is to provide screening level analysis.
- In this example, for an area to be in the 80th percentile nationwide means that the percent people of color or low income within that block group is higher than 80 percent of all block groups across the country. In other words, the percent people of color and/or low income in the area is significantly higher than average.
- Again, in this report, an “area of potential EJ concern” is defined as a census block group where the population is characterized by either a relatively high People of Color or low-income population. It does not take the number of people living within the block group into account.