![]()
The Analysis Engine can create plots of
the information in the data tables. When the Plot
(![]() ) toolbar button is clicked, the Select
Plotting Options window appears. Click
OK when all of the appropriate
values have been selected from the Select
Plotting Options window. The
specific plot type interface then appears:
) toolbar button is clicked, the Select
Plotting Options window appears. Click
OK when all of the appropriate
values have been selected from the Select
Plotting Options window. The
specific plot type interface then appears:
The File menu allows you to Load and Save Configurations for plots. By saving and reusing plot configurations, you may save considerable effort.
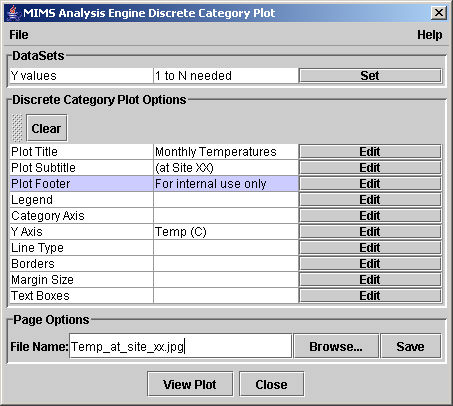
The DataSets group box at the top of the MIMS Analysis Engine Discrete Category Plot window describes the parameter columns that must be set to create a plot. Click on the Set button in order to choose which data columns to plot. The list of the potential data columns is set through the previous Selecting Plotting Options window.
Specify the table entries in the Discrete Category Plot Options group box to create a graph that illustrates the data well. The options (table entries such as Plot Title) differ based on the different plot types, and each option has several plot properties (specifications) that may be set when the you click on the Edit button and open a window associated with the plot option. The Plot Properties Glossary describes these specifications in detail:
Many of the Plot Option user interfaces employ seven special Table Icons. To add new rows to a table, delete old ones, or rearrange the existing rows, use the toolbar that appears above the table:
Insert Above (![]() ) - adds a new row above the table entry currently selected
) - adds a new row above the table entry currently selected
Insert Below (![]() ) - adds a new row below the table entry currently selected
) - adds a new row below the table entry currently selected
Delete (![]() ) - removes the currently selected row from the table
) - removes the currently selected row from the table
Copy (![]() ) - saves the row specifications in the selected row
) - saves the row specifications in the selected row
Paste (![]() ) - replaces the currently selected row specifications with
the last row specifications that were copied
) - replaces the currently selected row specifications with
the last row specifications that were copied
Up (![]() )
- moves the currently selected row above its predecessor
)
- moves the currently selected row above its predecessor
Down (![]() ) - moves the currently selected row below its predecessor
) - moves the currently selected row below its predecessor
The Discrete Category Plot Options group box also has a Clear button that returns the selected options (those shown with a blue background) to their default values for the properties. You may then click the Add button beside the entry to alter any plot properties from the default values.
The Page Options group box allows you to specify the file name that the plot image should be stored. You may specify the file name in the File Name: field directly by typing or click the Browse button. The following storage formats are currently supported: PostScript (*.ps), LATEX picture files (*.ptx), Adobe portable document format (*.pdf), portable network graphics (*.png), and JPEG files (*.jpg). The image is be stored in the specified file when you click the Save button.
Click the View Plot button to open Adobe Acrobat Reader and view the file.
Click the Close button or choose the File/Close menu option to return to the Data Table Window.