Progress Report
Program Compliance
Program Compliance Tables
Last updated: 05/2021
Related Figures


Highlights
ARP SO₂ Program
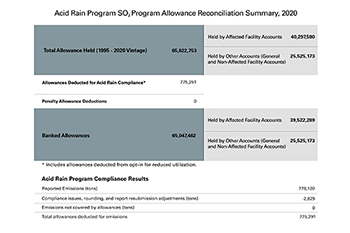
- The reported 2020 SO₂ emissions by the ARP sources totaled 778,120 tons.
- About 66 million SO₂ allowances were available for compliance (9 million vintage 2020 and nearly 57 million banked from prior years).
- EPA deducted about 775,000 allowances for the ARP compliance. After reconciliation, about 65 million ARP SO₂ allowances were banked and carried forward to the 2021 ARP compliance year.
- All ARP SO₂ facilities were in compliance in 2020 (holding sufficient allowances to cover their SO₂ emissions).
CSAPR SO₂ Group 1 Program
- The reported 2020 SO₂ emissions by the CSAPR Group 1 sources totaled 432,224 tons.
- Over 6.3 million SO₂ Group 1 allowances were available for compliance.
- EPA deducted approximately 432,000 allowances for the CSAPR SO₂ Group 1 compliance. After reconciliation, about 6 million CSAPR SO₂ Group 1 allowances were banked and carried forward to the 2021 compliance year.
- All CSAPR SO₂ Group 1 facilities were in compliance in 2020 (holding sufficient allowances to cover their SO₂ emissions).
CSAPR SO₂ Group 2 Program
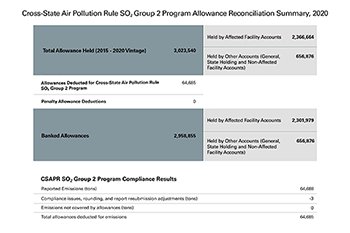
- The reported 2020 SO₂ emissions by the CSAPR Group 2 sources totaled 64,688 tons.
- Over 3 million SO₂ Group 2 allowances were available for compliance.
- EPA deducted almost 65,000 allowances for the CSAPR SO₂ Group 2 compliance. After reconciliation, about 3 million CSAPR SO₂ Group 2 allowances were banked and carried forward to the 2021 compliance year.
- All CSAPR SO₂ Group 2 facilities were in compliance in 2020 (holding sufficient allowances to cover their SO₂ emissions).
CSAPR NOₓ Annual Program
- The reported 2020 annual NOₓ emissions by the CSAPR sources totaled 405,334 tons.
- About 3.2 million NOₓ Annual allowances were available for compliance.
- EPA deducted over 405,000 allowances for the CSAPR NOₓ Annual Program compliance. After reconciliation, about 3 million CSAPR NOₓ Annual Program allowances were banked and carried forward to the 2021 compliance year.
- All CSAPR NOₓ Annual Program facilities were in compliance in 2020 (holding sufficient allowances to cover their NOₓ emissions).
CSAPR NOₓ Ozone Season Group 1 Program
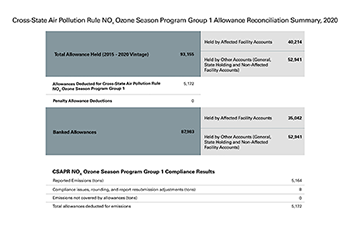
- The reported 2020 ozone season NOₓ emissions by the CSAPR sources totaled 5,164 tons.
- Over 93,000 NOₓ Ozone Season Group 1 allowances were available for compliance.
- EPA deducted over 5,100 allowances for the CSAPR NOₓ Ozone Season Group 1 compliance. After reconciliation, almost 88,000 CSAPR NOₓ Ozone Season Group 1 allowances were banked.
- All CSAPR NOₓ Ozone Season Group 1 facilities were in compliance (holding sufficient allowances to cover their NOₓ emissions).
CSAPR NOₓ Ozone Season Group 2 Program
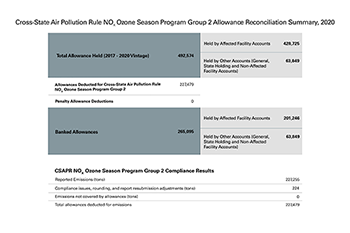
- The reported 2020 ozone season NOₓ emissions by the CSAPR sources totaled 227,255 tons.
- Over 492,000 NOₓ Ozone Season Group 2 allowances were available for compliance.
- EPA deducted over 227,000 allowances for the CSAPR NOₓ Ozone Season Group 2 compliance. After reconciliation, over 265,000 CSAPR NOₓ Ozone Season Group 2 allowances were banked.
- All CSAPR NOₓ Ozone Season Group 2 facilities were in compliance (holding sufficient allowances to cover their NOₓ emissions).
- In 2020, Mississippi and Missouri units covered by the CSAPR Ozone Season NOₓ Group 2 Program reported emissions exceeding the respective states’ assurance levels, triggering the assurance provisions. Emissions in Mississippi and Missouri exceeded each state’s assurance levels by 260 and 2,448 tons, respectively, resulting in the surrender of 5,416 additional allowances.1
- See 86 Fed. Reg. 26720.
Background Information
The year 2020 was the sixth year of compliance for the CSAPR SO₂ (Group 1 and Group 2), NOₓ Annual and NOₓ Ozone Season Group 1 programs, while it was the fourth year of compliance for both the CSAPR NOₓ Ozone Season Group 2 program and CSAPR Update. Each program has its own distinct set of allowances, which cannot be used for compliance with the other programs (e.g., CSAPR SO₂ Group 1 allowances cannot be used to comply with the CSAPR SO₂ Group 2 Program). Each CSAPR trading program contains “assurance provisions” to guarantee that each covered state achieves the required emissions reductions. If a state’s covered units exceed the state’s assurance level under the specific trading program, then the state must surrender two allowances for each ton of emissions exceeding the assurance level.
The compliance summary emissions number cited in “Highlights” may differ slightly from the sums of emissions used for reconciliation purposes shown in the “Allowance Reconciliation Summary” figures because of variation in rounding conventions, changes due to resubmissions by sources, and compliance issues at certain units. Therefore, the allowance totals deducted for actual emissions in those figures differ slightly from the number of emissions shown elsewhere in this report.