Progress Report
Emission Reductions
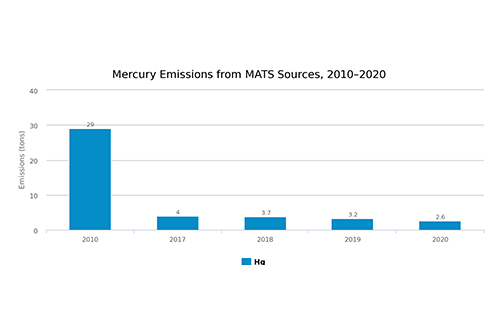
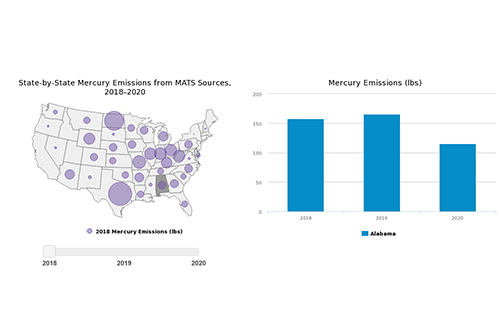
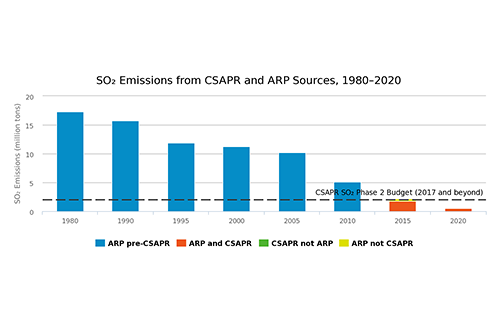
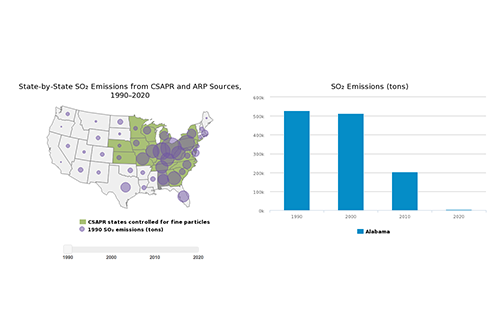
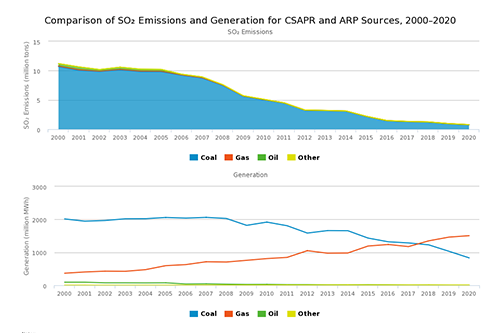
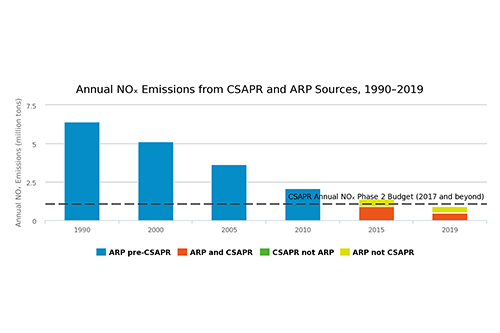
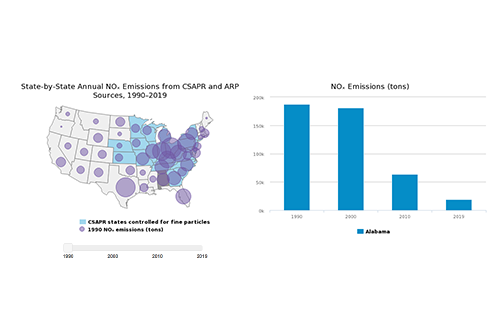
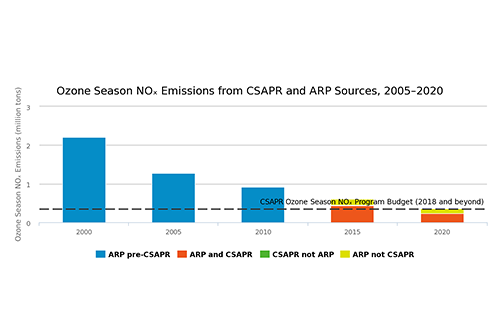
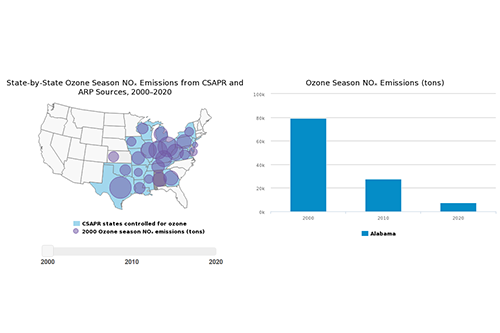
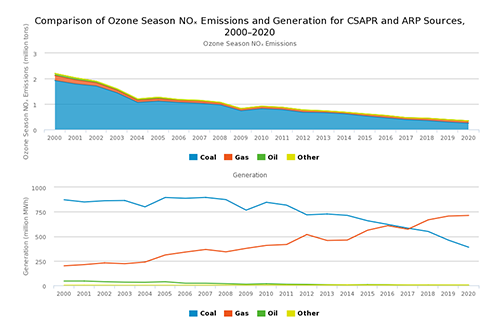
The Acid Rain Program (ARP) and Cross-State Air Pollution Rule (CSAPR) programs significantly reduced sulfur dioxide (SO₂), annual nitrogen oxides (NOₓ), and ozone season NOₓ emissions from electric generating units (EGUs). The Mercury and Air Toxics Standards (MATS) set limits on the emissions of hazardous air pollutants from coal- and oil-fired electric utility steam generating unit EGUs and have led to reductions in those emissions since 2010. This section covers changes in emissions at units affected by CSAPR, ARP, and MATS between 2020 and previous years.
Sulfur Dioxide (SO₂) Figures
![SO₂ Emissions from CSAPR and ARP Sources, 1980–2020](img/emissions_reductions_so2_f1_small.png)
![State-by-State SO₂ Emissions from CSAPR and ARP Sources, 1990–2020](img/emissions_reductions_so2_f2_small.png)
![Comparison of SO₂ Emissions and Generation for CSAPR and ARP Sources, 2000–2020](img/emissions_reductions_so2_f3_small.png)
Annual Nitrogen Oxides Figures
![Annual NOₓ Emissions from CSAPR and ARP Sources, 1990–2020](img/emissions_reductions_nox_f1_small.png)
![State-by-State Annual NOₓ Emissions from CSAPR and ARP Sources, 1990–2020](img/emissions_reductions_nox_f2_small.png)
![Comparison of Annual NOₓ Emissions and Generation for CSAPR and ARP Sources, 2000–2020](img/emissions_reductions_nox_f3_small.png)
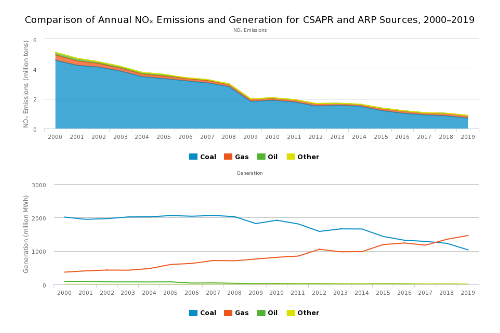
Ozone Season Nitrogen Oxides Figures
![Ozone Season NOₓ Emissions from CSAPR and ARP Sources, 2005–2020](img/emissions_reductions_ozone_f1_small.png)
![State-by-State Ozone Season NOₓ Emissions from CSAPR and ARP Sources, 2000–2020](img/emissions_reductions_ozone_f2_small.png)
![Comparison of Ozone Season NOₓ Emissions and Generation for CSAPR and ARP Sources, 2000–2020](img/emissions_reductions_ozone_f3_small.png)
Mercury Figures
![Mercury Emissions from MATS Sources, 2010–2020](img/emissions_reductions_mats_f1_small.png)
![State-by-State Mercury Emissions from MATS Sources, 2020](img/emissions_reductions_mats_f2_small.png)