Progress Report
Air Quality
Sulfur Dioxide and Nitrogen Oxides Trends Figures
Source: EPA, 2021
Last updated: 01/2021
Related Figures


Highlights
National SO₂ Air Quality
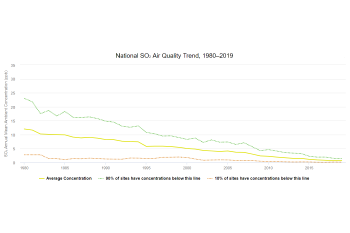
- Based on EPA’s air trends data, the national average of SO₂ annual mean ambient concentrations decreased from 12.0 parts per billion (ppb) to 0.7 ppb (94 percent) between 1980 and 2019.
- The two largest single-year reductions (over 20 percent) occurred in the first year of the ARP, between 1994 and 1995, and between 2008 and 2009, just prior to the start of the CAIR SO₂ program.
Regional Changes in Air Quality
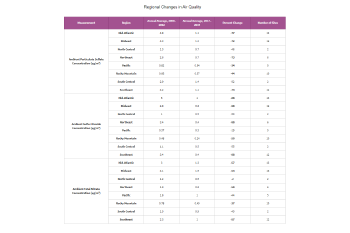
- Average ambient SO₂ concentrations declined in the eastern United States following implementation of the ARP and other emission reduction programs. Regional average concentrations declined 94 percent from the 1989–1991 to the 2017–2019 observation periods.
- Ambient particulate sulfate concentrations have decreased since the ARP and other emission reduction programs were implemented, with average concentrations decreasing by 47 to 83 percent in observed regions from 1989–1991 to 2017–2019.
- Average annual ambient total nitrate concentrations declined 56 percent from 1989–1991 to 2017–2019 in the eastern United States, with the most significant decreases occurring after 2002 coinciding with the implementation of the NOₓ Budget Trading Program, CAIR, CSAPR, and CSAPR Update.
Background Information
Sulfur Dioxide
Sulfur oxides are a group of highly reactive gases that can travel long distances in the upper atmosphere and predominantly exist as sulfur dioxide (SO₂). The primary source of SO₂ emissions is fossil fuel combustion at power plants. Smaller sources of SO₂ emissions include industrial processes, such as extracting metal from ore, as well as the burning of high sulfur-containing fuels by locomotives, large ships, and non-road equipment. SO₂ emissions contribute to the formation of fine particle pollution (PM₂.₅) and are linked with adverse effects on the respiratory system.1 In addition, particulate sulfate degrades visibility and, because sulfur compounds are typically acidic, can harm ecosystems when deposited.
Nitrogen Oxides
Nitrogen oxides are a group of highly reactive gases including nitric oxide (NO) and nitrogen dioxide (NO₂). In addition to contributing to the formation of ground-level ozone and PM₂.₅, NOₓ emissions are linked with adverse effects on the respiratory system.2, 3 NOₓ also reacts in the atmosphere to form nitric acid (HNO₃) and particulate ammonium nitrate (NH₄NO₃). HNO₃ and nitrate (NO₃), reported as total nitrate, can also lead to adverse health effects and, when deposited, cause damage to sensitive ecosystems.
Although the ARP and CSAPR programs have significantly reduced NOₓ emissions (primarily from power plants) and improved air quality, emissions from other sources (such as motor vehicles and agriculture) contribute to total nitrate concentrations in many areas. Ambient nitrate levels can also be affected by emissions transported via air currents over wide regions.
More Information
- Clean Air Status and Trends Network (CASTNET)
- Air Quality System (AQS)
- National Ambient Air Quality Standards (NAAQS)
- Sulfur Dioxide (SO₂) Pollution
- Nitrogen Oxides (NOₓ) Pollution
- EPA’s Clean Air Market Programs
- EPA’s 2020 National Air Quality Trends Report
References
- Katsouyanni, K., Schwartz, J., Spix, C., Touloumi, G., Zmirou, D., Zanobetti, A., Wojtyniak, B., Vonk, J.M., Tobias, A., Pönkä, A., Medina, S., Bachárová, L., & Anderson, H.R. (1996). Short term effects of air pollution on health: a European approach using epidemiologic time series data: the APHEA protocol. J. of Epidemiol Community Health, 50: S12–S18.
- Peel, J.L., Tolbert, P.E., Klein, M., Metzger, K.B., Flanders, W.D., Todd, K., Mulholland, J.A., Ryan, P.B., & Frumkin, H. (2005). Ambient air pollution and respiratory emergency department visits. Epidemiology, 16: 164–174.
- Hong, C., Goldberg, M.S., Burnett, R.T., Jerrett, M., Wheeler, A.J., & Villeneuve, P.J. (2013) Long-term exposure to traffic-related air pollution and cardiovascular mortality. Epidemiology, 24: 35–43.