Progress Report
Emission Reductions
Sulfur Dioxide (SO₂) Figures
Source: EPA, 2021
Last updated: 05/2021
Related Figures
Highlights
Overall Results
- Under the ARP, CAIR, and now CSAPR, power plants have significantly lowered SO₂ emissions while electricity generation has remained relatively stable since 2000.
- These emission reductions are a result of an overall increase in the environmental effectiveness at affected sources as electric generators installed controls, switched to lower emitting fuels, or otherwise reduced their SO₂ emissions. These trends are discussed further in Chapter 1.
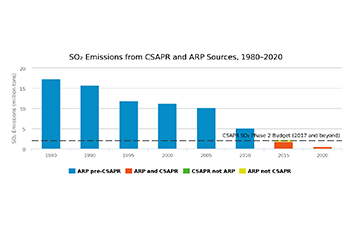
SO₂ Emission Trends
- ARP: Units in the ARP emitted 778 thousand tons of SO₂ in 2020, well below the ARP's statutory annual cap of 8.95 million tons. The ARP sources reduced emissions by 15.0 million tons (95 percent) from 1990 levels and 16.5 million tons (95 percent) from 1980 levels.
- CSAPR and ARP: In 2020, the fifth year of operation of the CSAPR SO₂ programs, sources in both the CSAPR SO₂ annual programs and the ARP together reduced SO₂ emissions by 15.0 million tons (95 percent) from 1990 levels (before implementation of the ARP), 10.4 million tons (93 percent) from 2000 levels (ARP Phase II), and 9.5 million tons (92 percent) from 2005 levels (before implementation of the CAIR and the CSAPR). All ARP and CSAPR sources together emitted a total of 788 thousand tons of SO₂ in 2020.
- CSAPR: Annual SO₂ emissions from sources in the CSAPR SO₂ programs fell from 7.7 million tons in 2005 to 497 thousand tons in 2020 (94 percent). In 2020, SO₂ emissions were about 1.5 million tons below the regional CSAPR emission budgets (0.94 million in Group 1 and 0.53 million in Group 2); the CSAPR SO₂ annual programs' 2020 regional budgets are 1,372,631 and 597,579 tons for Group 1 and Group 2, respectively.
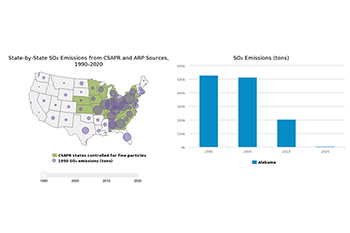
SO₂ State-by-State Emissions
- CSAPR and ARP: From 1990 to 2020, annual SO₂ emissions from sources in the ARP and the CSAPR SO₂ program dropped in 46 states plus Washington, D.C. by a total of 15.0 million tons. In contrast, annual SO₂ emissions increased in two states (Idaho and Vermont) by a combined total of 10 tons from 1990 to 2020.
- CSAPR: All 22 states (16 states in Group 1 and 6 states in Group 2) had emissions below their CSAPR allowance budgets, collectively by about 1.5 million tons.
SO₂ Emission Rates
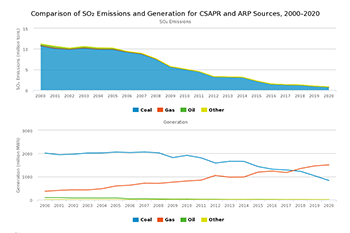
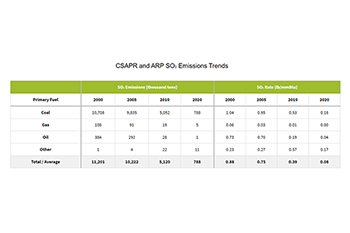
- The average SO₂ emission rate for units in the ARP or CSAPR SO₂ program fell to 0.08 pounds per million British thermal units (lb/mmBtu). This indicates an 90 percent reduction from 2005 rates, with most reductions coming from coal-fired units.
- Emissions have decreased dramatically since 2005, due in large part to greater use of control technology on coal-fired units and increased generation at natural gas-fired units that emit very little SO₂ emissions.
Background Information
SO₂ is a highly reactive gas that is generated primarily from coal-fired power plants. In addition to contributing to the formation of acid rain fine particle (PM₂.₅) pollution, SO₂ emissions are linked with a number of adverse effects to human health and ecosystems.
The states with the highest emitting sources in 1990 have generally seen the greatest SO₂ emission reductions under the ARP, and this trend continued under CAIR and CSAPR. Most of these states are in the Ohio River Valley and are upwind of the areas the ARP and CSAPR were designed to protect. Reductions under these programs have provided important environmental and health benefits over a large region.