Progress Report
Air Quality
Ozone Figures
Last updated: 03/2020
Related Figures
Highlights
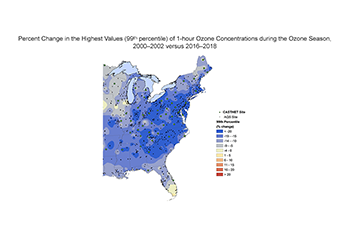
Changes in 1-Hour Ozone during Ozone Season
- There was an overall regional reduction in ozone levels between 2000–2002 and 2016–2018, with a 19 percent reduction in the highest (99th percentile) ozone concentrations in CSAPR and CSAPR Update states.
- Results demonstrate how NOₓ emission reduction policies have affected 1-hour ozone concentrations in the eastern United States – the region that the policies were designed to target.
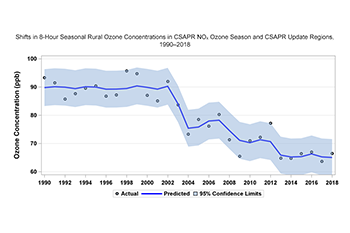
Trends in Rural 8-Hour Ozone
- From 2016 to 2018, rural ozone concentrations averaged 66 ppb in CSAPR states, a decrease of 24 ppb (27 percent) from the 1990 to 2002 period.
- The Autoregressive Integrated Moving Average (ARIMA) model shows how the reductions in rural ozone concentrations correlate with the implementation of the NBP in 2003 (two-year 15 ppb reduction from 2002) and the start of the CAIR NOₓ Ozone Season program in 2009 (two-year 7 ppb reduction from 2007).
- Six of the seven lowest observed annual ozone concentrations were between 2013 and 2018. Ozone season NOₓ emissions fell steadily under CAIR and continued to drop after implementation of CSAPR in 2015 and CSAPR Update in 2017. In addition, implementation of the mercury and air toxics standards (MATS), which began in 2015, achieves co-benefit reductions of NOₓ emissions.
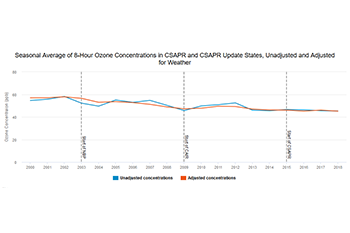
Changes in 8-Hour Ozone Concentrations
- The average reduction in both urban and rural ozone concentrations (not adjusted for weather) in the CSAPR NOₓ Ozone Season program and CSAPR Update regions from 2000–2002 to 2016–2018 was about 10 ppb (19 percent).
- The average reduction in the meteorologically-adjusted ozone concentrations in the CSAPR NOₓ Ozone Season program and CSAPR Update regions from 2000–2002 to 2016–2018 was about 12 ppb (21 percent).
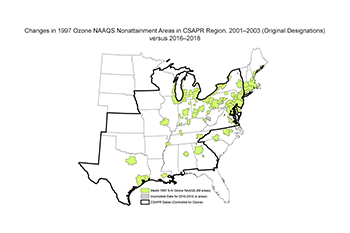
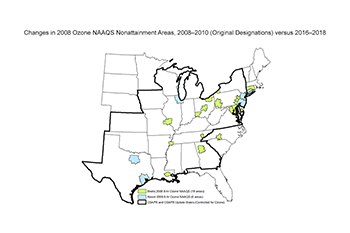
Changes in Ozone Nonattainment Areas
- Ninety-two of the 113 areas originally designated as nonattainment for the 1997 8-hour ozone National Ambient Air Quality Standard (NAAQS) (0.08 ppm) are in the eastern United States and are home to about 122 million people.1 These nonattainment areas were designated in 2004 using air quality data from 2001 to 2003.2
- Based on data from 2016 to 2018, 88 of the eastern ozone nonattainment areas now show concentrations below the level of the 1997 standard, while the remaining 4 areas had incomplete data.
- Twenty-two of the 46 areas originally designated as nonattainment for the 2008 8-hour ozone NAAQS (0.075 ppm) are in the eastern United States and are home to about 80 million people. These nonattainment areas were designated in 2012 using air quality data from 2008 to 2010 or 2009 to 2011.
- Based on data from 2016–2018, 73 percent (16 areas) of the eastern ozone nonattainment areas now show concentrations below the level of the 2008 standard. While six areas continue to show concentrations above the 2008 standard, four of those areas made progress toward meeting the standard in the 2016–2018 period. It is reasonable to conclude that ozone season NOₓ emission reductions from the NBP, CAIR, CSAPR, and CSAPR Update have significantly contributed to these improvements in ozone air quality.
- Effective August 3, 2018, EPA designated 52 areas nonattainment for the 2015 8-hour ozone standard based on air quality data from 2014–2016 or 2015–2017. Twenty-two of the 52 areas are in the eastern United States and are home to 76 million people.
- Based on data from 2016–2018, one of the 22 eastern ozone nonattainment areas (Columbus, OH) now shows concentrations below the level of the 2015 standard.
Background Information
Ozone pollution – also known as smog – forms when NOₓ and volatile organic compounds (VOCs) react in the presence of sunlight. Major anthropogenic sources of NOₓ and VOC emissions include electric power plants, motor vehicles, solvents, and industrial facilities. Meteorology plays a significant role in ozone formation and hot, sunny days are most favorable for ozone production. For ozone, EPA and states typically regulate NOₓ emissions during the summer when sunlight intensity and temperatures are highest.
Ozone Standards
In 1979, EPA established NAAQS for 1-hour ozone at 0.12 parts per million (ppm), or 124 parts per billion (ppb). In 1997, a more stringent 8-hour ozone standard of 0.08 ppm (84 ppb) was finalized, revising the 1979 standard. CSAPR was designed to help downwind states in the eastern United States achieve the 1997 ozone NAAQS. Based on extensive scientific evidence about ozone’s effects on public health and welfare, EPA strengthened the 8-hour ozone standard to 0.075 ppm (75 ppb) in 2008. Finalized in 2016, the CSAPR Update was designed to help downwind states meet and maintain the 2008 ozone NAAQS. EPA further strengthened the 8-hour NAAQS for ground-level ozone to 0.070 ppm (70 ppb) in 2015. EPA revoked the 1-hour ozone standard in 2005 and more recently revoked the 1997 8-hour ozone standard in 2015.
Regional Trends in Ozone
EPA investigated trends in daily maximum 8-hour ozone concentrations measured at rural Clean Air Status and Trends Network (CASTNET) monitoring sites within the CSAPR NOₓ ozone season program and CSAPR Update regions and in adjacent states. Rural ozone measurements are useful in assessing the impacts on air quality resulting from regional NOₓ emission reductions because they are typically less affected by local sources of NOₓ emissions (e.g., industrial and mobile) than urban measurements. Reductions in rural ozone concentrations are largely attributed to reductions in regional NOₓ emissions and transported ozone.
The Autoregressive Integrated Moving Average (ARIMA) model is an advanced statistical analysis tool used to visualize the trend in regional ozone concentrations following implementation of various programs geared toward reducing ozone season NOₓ emissions. To show the shift in the highest daily ozone levels, EPA modeled the average of the 99th percentile of the daily maximum 8-hour ozone concentrations measured at CASTNET sites (as described above).
Meteorologically–Adjusted Daily Maximum 8-Hour Ozone Concentrations
Meteorologically–adjusted ozone trends provide additional insight on the influence of CSAPR NOₓ Ozone Season program and CSAPR Update emission reductions on regional air quality. EPA retrieved daily maximum 8-hour ozone concentration data from CASTNET and daily meteorology data from the National Weather Service for 78 urban areas and 35 rural CASTNET monitoring sites located in the CSAPR NOₓ Ozone Season program and CSAPR Update regions. EPA uses these data in a statistical model to account for the influence of weather on seasonal average ozone concentrations at each monitoring site.3, 4
Changes in Ozone Nonattainment Areas
The majority of ozone season NOₓ emission reductions in the power sector after 2003 are attributable to the NBP, CAIR, CSAPR, and CSAPR Update. As power sector emissions are an important component of the NOₓ emission inventory, it is reasonable to conclude that the reduction in ozone season NOₓ emissions from these programs have significantly contributed to improvements in ozone concentrations and attainment of the 1997 ozone health-based air quality standard.
Emission reductions under these power sector programs have helped many areas in the eastern United States reach attainment for the 2008 ozone NAAQS. However, several areas continue to be out of attainment with the 2008 ozone NAAQS, and additional ozone season NOₓ emission reductions are needed to attain that standard as well as the strengthened ozone standard that was finalized in 2015.
In order to help downwind states and communities meet and maintain the 2008 ozone standard, EPA finalized the CSAPR Update in September 2016 to address the transport of ozone pollution that crosses state lines in the eastern United States. Implementation began in May 2017 to further reduce ozone season NOₓ emissions from power plants in 22 states in the eastern US.
More Information
- Clean Air Status and Trends Network (CASTNET)
- Air Quality System (AQS)
- National Ambient Air Quality Standards (NAAQS)
- Ozone Pollution
- Nitrogen Oxides (NOₓ) Pollution
- Nonattainment Areas
- EPA’s Clean Air Market Programs
- EPA’s 2019 National Air Quality Trends Report
References
- U.S. Census. (2010).
- 40 CFR Part 81. Designation of Areas for Air Quality Planning Purposes.
- Cox, W.M. & Chu, S.H. (1996). Assessment of interannual ozone variation in urban areas from a climatological perspective. Atmospheric Environment, 30 (16): 2615–2625.
- Camalier, L., Cox, W.M., & Dolwick, P. 2007. The effects of meteorology on ozone in urban areas and their use in assessing ozone trends. Atmospheric Environment, 41(33): 7127–7137.