Progress Report
How To Use This Tool
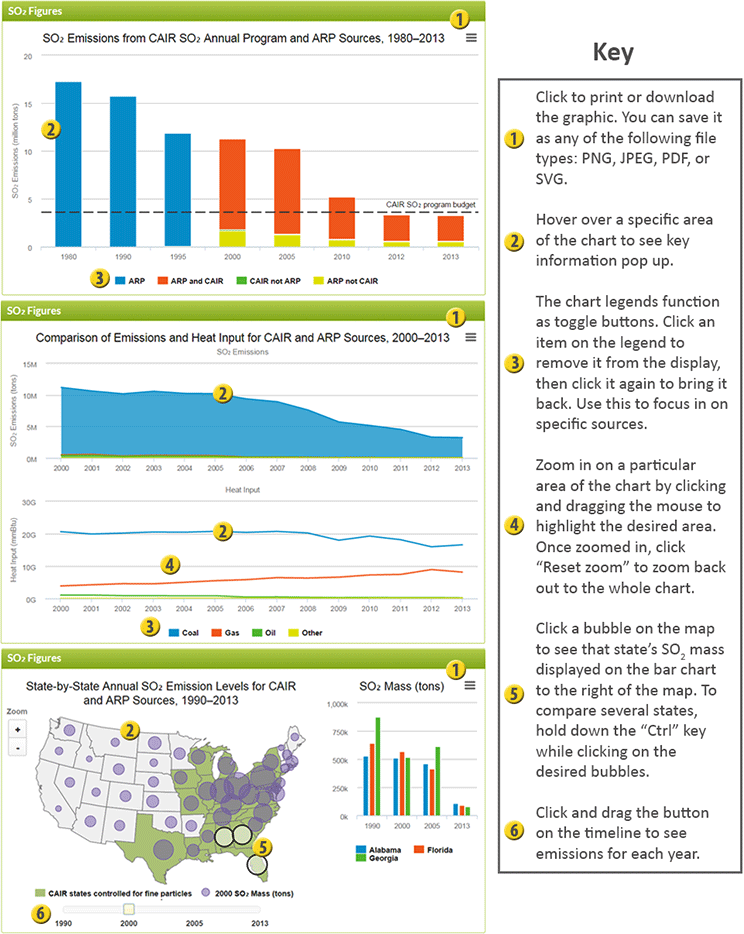
The tables, charts, and maps contained in the progress report showcase an enormous amount of data. Some are static images while others are dynamic, meaning that viewers can click on the charts and maps to manipulate what data they are seeing.
View the images and the associated key below to learn how to use these tools to their fullest extent.