Progress Report
Acid Deposition
Acid Deposition Figures
Last updated: 09/2019
Related Figures
Highlights
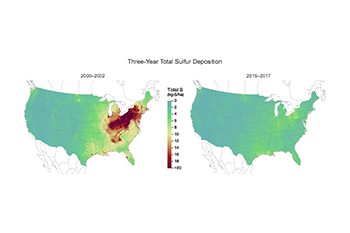
Wet Sulfate Deposition
- All areas of the eastern United States have shown significant improvement, with an overall 64 percent reduction in wet sulfate deposition from 2000–2002 to 2015–2017.
- Between 2000–2002 and 2015–2017, the Northeast and Mid-Atlantic experienced the largest reductions in wet sulfate deposition of 71 percent and 70 percent, respectively.
- A reduction in SO₂ emissions and consequent decrease in the formation of sulfates that are transported long distances have resulted in reduced sulfate deposition in the Northeast. The sulfate reductions documented in the region, particularly across New England and portions of New York, were also affected by lowered SO₂ emissions in eastern Canada.1
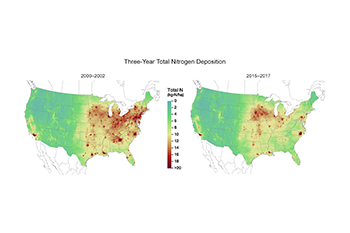
Wet Inorganic Nitrogen Deposition
- Wet deposition of inorganic nitrogen decreased an average of 21 percent in the Mid-Atlantic and 33 percent in the Northeast but increased 13 percent in the Rocky Mountain region from 2000–2002 to 2015–2017. Increases in wet deposition of inorganic nitrogen in the Rocky Mountain region are attributed to a 57 percent increase in wet deposition of reduced nitrogen (NH₄+) between 2000 and 2017.
- Reductions in nitrogen deposition recorded since the early 1990s have been less pronounced than those for sulfur. Emissions from other source categories (e.g., mobile sources, agriculture, and manufacturing) contribute to air concentrations and deposition of nitrogen.
Regional Trends in Total Deposition
- The reduction in total sulfur deposition (wet plus dry) has been of similar magnitude to that of wet deposition with an overall average reduction of 69 percent from 2000–2002 to 2015–2017.
- Decreases in dry and total inorganic nitrogen deposition have generally been greater than that of wet deposition, with average reductions of 28 percent and 21 percent, respectively. In contrast, wet deposition from inorganic nitrogen decreased by an average of 10 percent from 2000–2002 to 2015–2017.
Background Information
Acid Deposition
As SO₂ and NOₓ gases react in the atmosphere with water, oxygen, and other chemicals, they form acidic compounds that are deposited to the earth’s surface in the form of wet and dry acid deposition.
Long-term monitoring network data show significant improvements in the primary indicators of acid deposition. For example, wet sulfate deposition (sulfate that falls to the earth through rain, snow, and other precipitation) has decreased in much of the eastern United States due to SO₂ emission reductions achieved through implementation of the Acid Rain Program (ARP), the Clean Air Interstate Rule (CAIR) and the Cross-State Air Pollution Rule (CSAPR). Some of the most dramatic reductions have occurred in the mid-Appalachian region, including Maryland, New York, West Virginia, Virginia, and most of Pennsylvania. Along with wet sulfate deposition, precipitation acidity, expressed as hydrogen ion (H+ or pH) concentration, has also decreased by similar percentages.
Reductions in nitrogen deposition compared to the early 1990s have been less pronounced than those for sulfur. As noted earlier, emissions from source categories other than ARP and CSAPR sources contribute to changes in air concentrations and deposition of nitrogen.
Monitoring Networks
The Clean Air Status and Trends Network (CASTNET) provides long-term monitoring of regional air quality to determine trends in atmospheric concentrations and deposition of nitrogen, sulfur, and ozone in order to evaluate the effectiveness of national and regional air pollution control programs. CASTNET now operates more than 90 regional sites throughout the contiguous United States, Alaska, and Canada. Sites are located in areas where urban influences are minimal.
The National Atmospheric Deposition Program/National Trends Network (NADP/NTN) is a nationwide, long-term network tracking the chemistry of precipitation. The NADP/NTN provides concentration and wet deposition data on hydrogen ion (acidity as pH), sulfate, nitrate, ammonium, chloride, and base cations. The NADP/NTN has grown to more than 250 sites spanning the United States, Canada, Puerto Rico, and the Virgin Islands.
Together, these complementary networks provide long-term data needed to estimate spatial patterns and temporal trends in total deposition.2
More Information
- Acid Rain
- Clean Air Status and Trends Network (CASTNET)
- National Atmospheric Deposition Program (NADP) Exit
References
- Government of Canada, Environment Canada. (2017). Canada-United States Air Quality Agreement Progress Report 2016. ISSN: 1910–5223: Cat. No.: En85-1E-PDF.
- Schwede, DB and Lear, GG. (2014). A novel hybrid approach for estimating total deposition in the United States. Atmosphere Environment 92: 207-220.