Progress Reports
Power Sector Programs – Progress Report
Under the Clean Air Act, EPA implements several regulations that affect power plants, including the Acid Rain Program (ARP), the Cross-State Air Pollution Rule (CSAPR) and CSAPR Update, and the Mercury and Air Toxics Standards (MATS). These programs require fossil fuel-fired electric generating units to reduce emissions of sulfur dioxide (SO₂), nitrogen oxides (NOₓ), and hazardous air pollutants (including mercury (Hg)) to protect human health and the environment. This reporting year marks the third year of CSAPR implementation, the twenty-second year of ARP, and the first year of MATS implementation in which the majority of sources were required to report emissions for the full year. This report summarizes annual progress through 2017, highlighting data that EPA systematically collects on emissions for all three programs, on compliance, and environmental effects for ARP and CSAPR. Transparency and data availability are a hallmark of these programs, and a cornerstone of their success.
Sulfur dioxide, nitrogen oxides, and hazardous air pollutants, including mercury, are fossil fuel combustion byproducts that impact public health and the environment. SO₂ and NOₓ, and their sulfate and nitrate byproducts, are transported and deposited as acid rain at levels harmful to sensitive ecosystems in many areas of the country. These pollutants also contribute to the formation of fine particles (sulfates and nitrates) and ground level ozone that are associated with significant human health effects and regional haze. Atmospheric mercury deposition accumulates in fish to levels of concern for human health and the health of fish-eating wildlife.
The Acid Rain Program, CSAPR, CSAPR Update and MATS have delivered substantial reductions in power sector emissions of SO₂, NOₓ, and hazardous air pollutants, along with significant improvements in air quality and the environment. In addition to the demonstrated reductions achieved by the power sector emission control programs described in this report, SO₂, NOₓ, and hazardous air pollutant emissions have declined steadily in recent years due to a variety of power industry trends that are expected to continue.
Read historical reports of EPA's Clean Air Markets Programs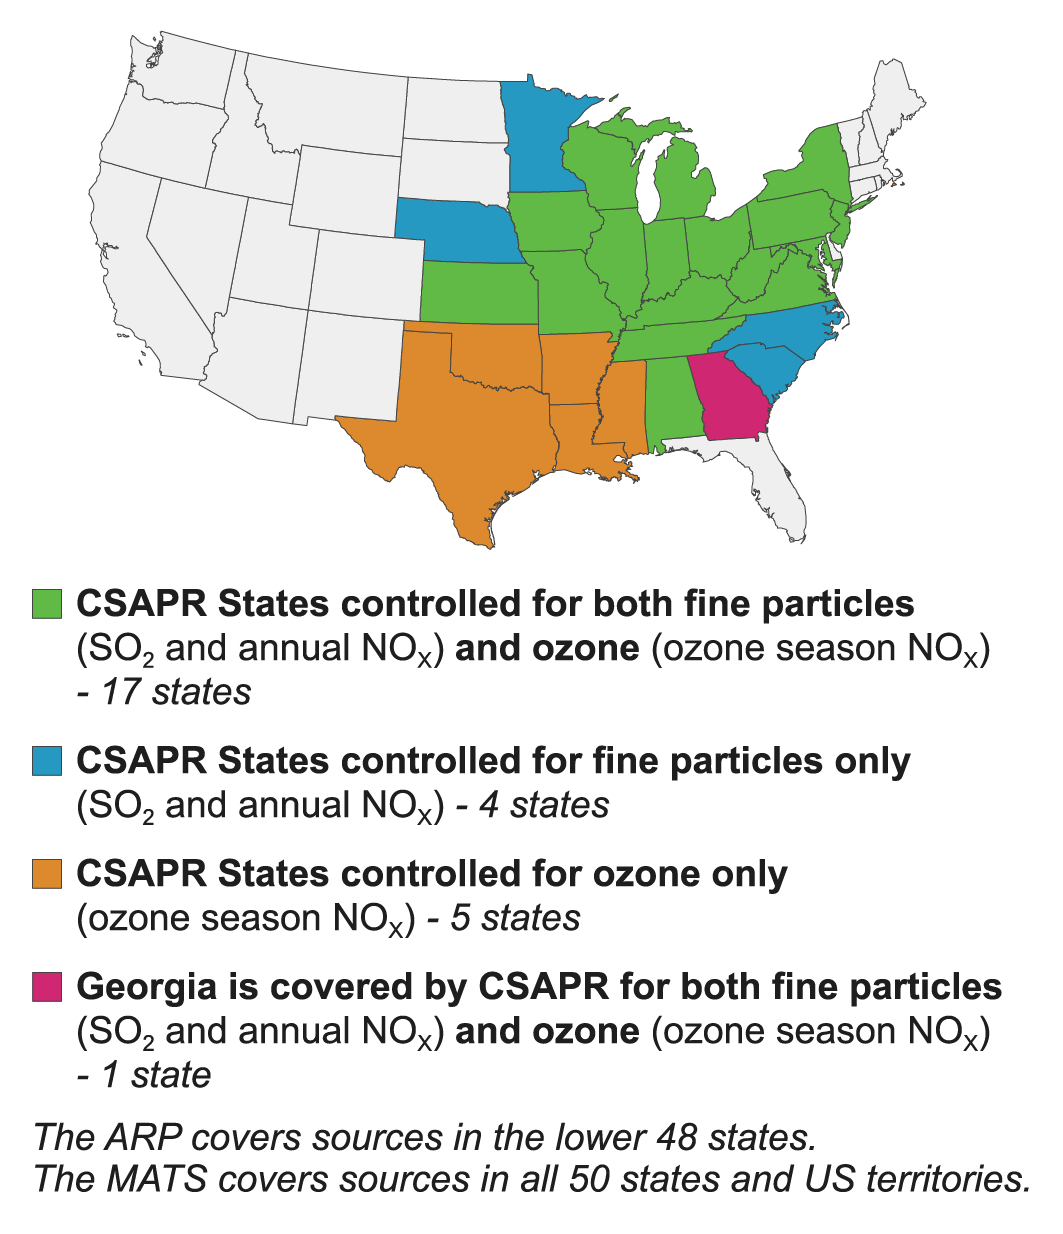
2017 ARP, CSAPR and MATS at a Glance
- Annual SO₂ emissions:
CSAPR - 0.8 million tons (91 percent below 2005)
ARP - 1.3 million tons (92 percent below 1990) - Annual NOₓ emissions:
CSAPR - 0.6 million tons (73 percent below 2005)
ARP - 1.0 million tons (84 percent below 1990) - CSAPR ozone season NOₓ emissions: 300,000 tons (53 percent below 2005)
- Compliance: 100 percent compliance for power plants in the market-based ARP and CSAPR allowance-trading programs.
- Emissions reported under MATS:
Mercury - 4 tons (86 percent below 2010)
Acid gases - 4,831 tons (96 percent below 2010)
Non-mercury metals - 221 tons (81 percent below 2010) - Ambient particulate sulfate concentrations: The eastern United States has shown substantial improvement, decreasing 33 to 71 percent between 2000–2002 and 2015–2017.
- Ozone NAAQS attainment: Based on 2015–2017 data, all 92 areas in the East originally designated as nonattainment for the 1997 ozone NAAQS are now meeting the standard.
- PM₂.₅ NAAQS attainment: Based on 2015–2017 data, 36 of the 39 areas in the East originally designated as nonattainment for the 1997 PM₂.₅ NAAQS are now meeting the standard (one area has incomplete data).
- Wet sulfate deposition: All areas of the eastern United States have shown significant improvement with an overall 64 percent reduction in wet sulfate deposition from 2000–2002 to 2015–2017.
- Levels of acid neutralizing capacity (ANC): This indicator of recovery improved (i.e., increased) significantly from 1990 levels at lake and stream monitoring sites in the Adirondack region, New England and the Catskill mountains.