Progress Report
Emission Reductions
Ozone Season Nitrogen Oxides Figures
Source: EPA, 2022
Last updated: 07/2022
Related Figures
Highlights
Overall Results
- Ozone season NOₓ emissions have declined dramatically under the ARP, NBP, CAIR, and CSAPR programs.1
- States with the highest emitting sources of ozone season NOₓ emissions in 2000 have seen the greatest reductions under the CSAPR NOₓ ozone season programs. Most of these states are in the Ohio River Valley and are upwind of the areas CSAPR was designed to protect. Reductions by sources in these states have resulted in important environmental and human health benefits over a large region.
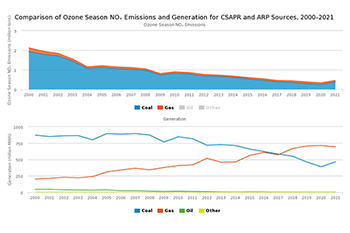
- These reductions have occurred while electricity generation has remained relatively stable since 2000. These trends are discussed further in Chapter 1.
- Other programs – such as regional and state NOₓ emission control programs – also contributed significantly to the ozone season NOₓ emission reductions achieved by sources in 2021.
Ozone Season NOₓ Emissions Trends
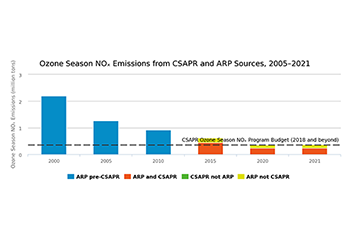
- ARP: Units in the ARP program emitted 351,000 tons of ozone season NOₓ emissions in 2021. Sources reduced emissions by 1.8 million tons (84 percent) from the 2000 ozone season and 920,000 tons (72 percent) from the 2005 ozone season.
- CSAPR: In 2021, units covered under the CSAPR NOₓ ozone season programs (Group 1, 2, and 3) emitted 242,000 tons, a reduction of 210,000 (46%) since 2015.
- In 2021, the CSAPR NOₓ ozone season program emissions were 19 percent below the regional emission budget of 298,879 tons (24,041 tons for Group 1, and 143,408 tons for Group 2, and 131,430 tons for Group 3).
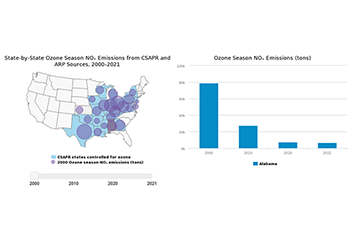
Ozone Season NOₓ State-by-State Emissions
- Between 2005 and 2021, ozone season NOₓ emissions from the CSAPR sources fell in every state participating in the CSAPR NOₓ ozone season program.
- 20 states had emissions below their CSAPR 2021 allowance budgets, collectively by about 62,000 tons. Three states (Illinois, Missouri, and Pennsylvania) exceeded their 2021 state level budgets by about 5,400 tons total.
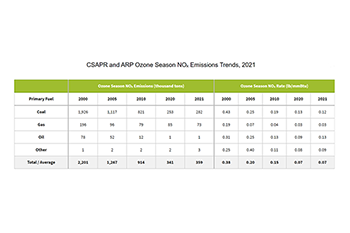
Ozone Season NOₓ Emission Rates
- In 2021, the average NOₓ ozone season emission rate fell to 0.07 lb/mmBtu for the CSAPR ozone season program states and 0.07 lb/mmBtu nationally. This represents a 63 and 66 percent reduction, respectively, from 2005 emission rates, with the majority of reductions coming from coal-fired units.
- Emissions have decreased dramatically since 2005, due in large part to greater use of control technology, primarily on coal-fired units, and increased generation at natural gas-fired units, which emit less NOₓ emissions per unit of electricity than coal-fired units.
- CSAPR refers to CSAPR, the CSAPR Update, and the Revised CSAPR Update programs.
Background Information
Nitrogen oxides (NOₓ) are made up of a group of highly reactive gases that are emitted from power plants and motor vehicles, as well as other sources. NOₓ emissions contribute to the formation of ground-level ozone and fine particle pollution, which cause a variety of adverse human health effects.
The CSAPR NOₓ ozone season program was established to reduce interstate transport of air pollution during the ozone season (May 1 – September 30), the warm summer months when ozone formation is highest, and to help eastern U.S. counties attain the 1997 ozone standard. The CSAPR Update NOₓ ozone season program was similarly established to help eastern U.S. counties attain the 2008 ozone standard. On March 15, 2021, EPA finalized the Revised CSAPR Update to further reduce NOₓ emissions from power plants in 12 states. The rule responded to a September 2019 ruling by the United States Court of Appeals for the D.C. Circuit, Wisconsin v. EPA, which remanded the 2016 CSAPR Update to EPA for failing to fully eliminate significant contribution to nonattainment and interference with maintenance of the 2008 ozone NAAQS from these states by downwind areas’ attainment dates.