CASTNET Overview
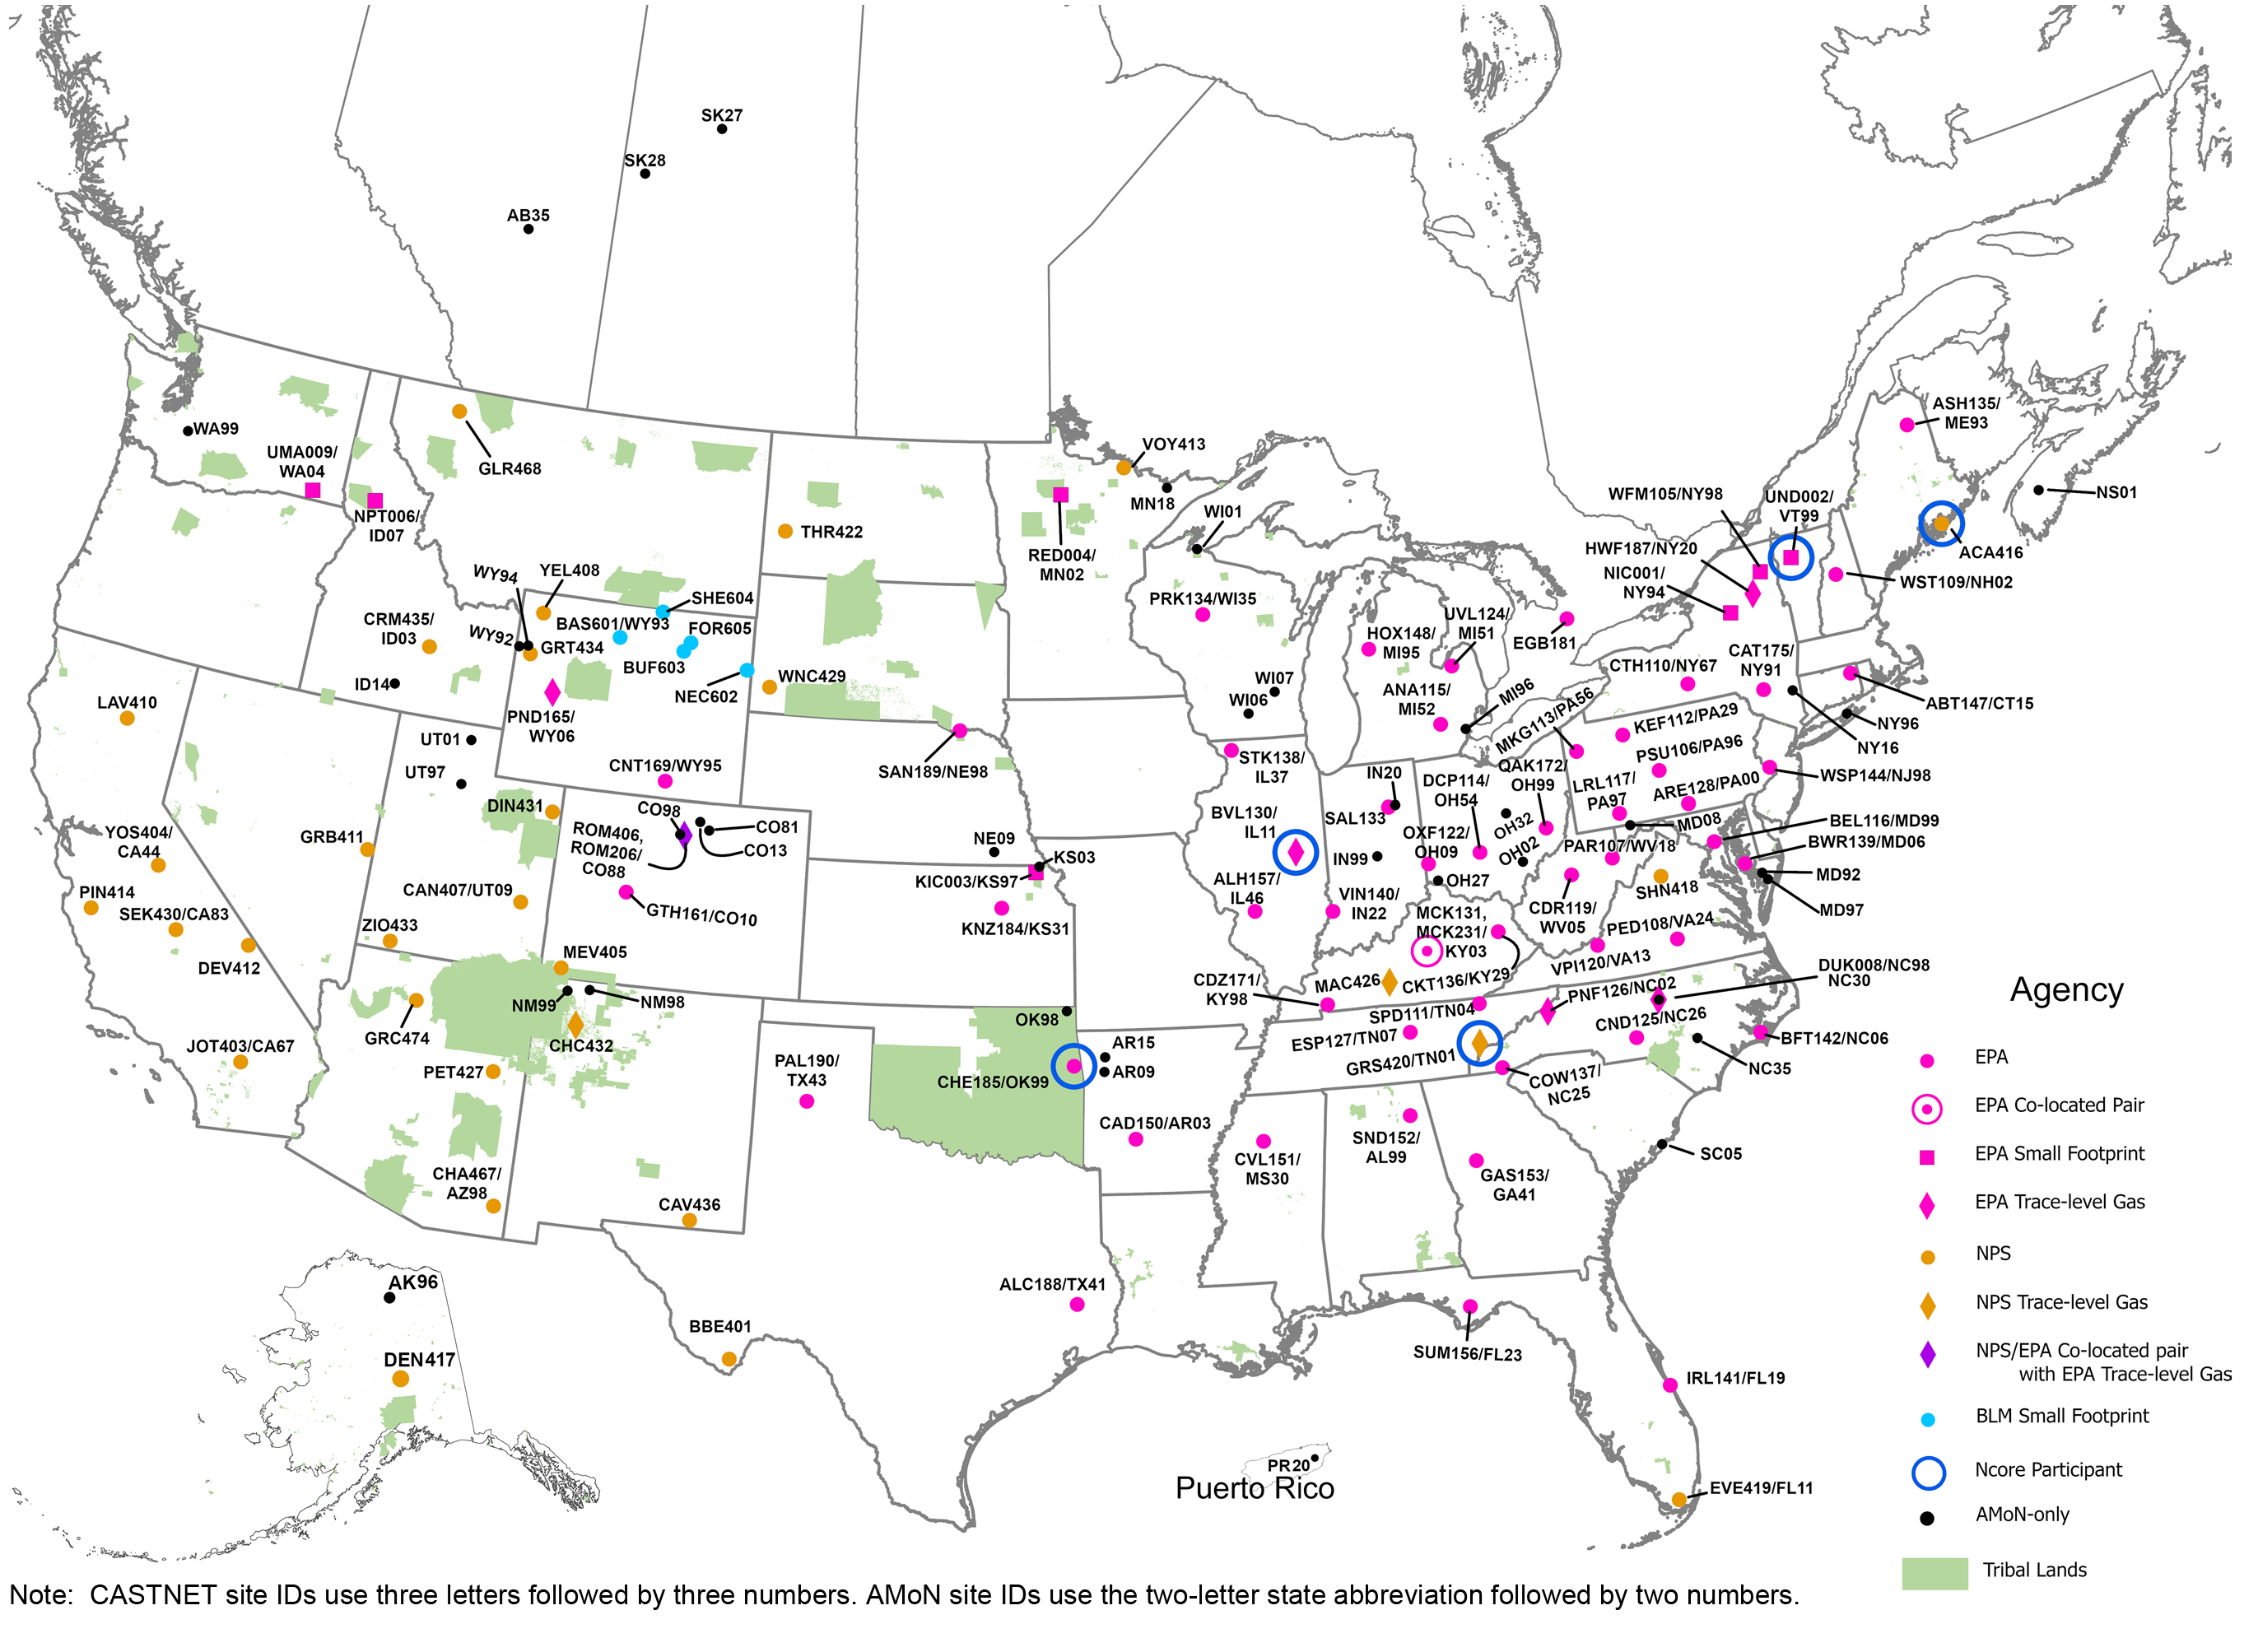
The Clean Air Status and Trends Network (CASTNET) operated 100 monitoring stations throughout the contiguous United States, Alaska, and Canada in 2021. Ninety-four sites included filter pack systems to sample weekly concentrations of acidic gases and particulate matter. Eighty-eight sites included continuous ozone (O3) analyzers. The U.S. Environmental Protection Agency (EPA), the National Park Service (NPS), and the Bureau of Land Management-Wyoming State Office (BLM) are the primary sponsors of CASTNET. NPS operated 31 sites during 2021. The BLM operated five sites in Wyoming. A map of CASTNET sites is shown in Figure 1.
Many organizations, including federal and state government agencies, Native American tribes, and universities, contribute to CASTNET. These participants sponsor individual CASTNET sites and provide in-kind services that support the overall performance of the network. For example, these participants change weekly filter packs, operate and repair instruments, and perform general site maintenance. Many also provide the land for the CASTNET site.
Background
In 1990, the Clean Air Act Amendments (CAAA) added language that called for the EPA Administrator to establish a national monitoring network to assess relationships between decreasing emissions and trends in air quality, deposition, and ecological effects. Consequently, EPA established CASTNET. The fundamental mission of CASTNET is to measure changes in air quality that result from national and regional emission controls of criteria pollutants such as the Acid Rain Program (ARP).
CASTNET began with 50 sites using filter pack systems to sample weekly concentrations of acidic gasses and particulate matter. Most sites included continuous O analyzers. CASTNET has provided consistent measurements over three decades. Over time, enhancements have been added to increase the value of the program, including:
- 1987: The predecessor to CASTNET, the National Dry Deposition Network (NDDN), began collecting measurements at approximately 15 sites in the eastern United States.
- 1990: CASTNET filter pack measurements of sulfur and nitrogen pollutants were taken at 50 sites.
- 1994: NPS began its participation with the operation of 15 sites primarily in the western United States.
- 2002: The first tribal site was installed in 2002 in Oklahoma in conjunction with the Cherokee Nation. The seventh tribal site was installed in 2020 in partnership with the Confederated Tribes of the Umatilla Indian Reservation.
- 2007: The National Atmospheric Deposition Program (NADP) Ammonia Monitoring Network (AMoN) began. AMoN has grown to more than 100 sites with approximately 70 percent of AMoN sites situated at CASTNET locations.
- 2011: Ozone systems were upgraded at all EPA-sponsored sites to become regulatory compliant. As of 2021, there were 56 EPA-sponsored regulatory O3 sites, 30 NPS sites, and 2 BLM sites.
- 2012: The first small-footprint sites, which do not require temperature-controlled shelters, were established in New York (2) and Vermont (1). Additional small-footprint sites were subsequently added for a total of 12 small-footprint sites in 2021.
- 2012: The BLM began its participation in CASTNET with five filter pack sites in Wyoming.
- 2021: As of December 31, 2021, 100 sites were operational; 64 of these sites are operated by the EPA, 31 by NPS, and 5 by the BLM Wyoming.
The ARP, which was established by the U.S. Congress under Title IV of the CAAA and started in 1995, was enacted to reduce emissions of sulfur dioxide ( SO2) and nitrogen oxides (NOx) from fossil fuel fired electric generating units (EGUs). The ARP has produced significant reductions in emissions since 1995. Other air pollution control programs were instituted to further reduce emissions of SO2 and NOx. Examples of these programs and their implementation years include:
- 2000 Ozone Transport Commission NOx Budget Program
- 2003 NOx State Implementation Plan (SIP) Call NOx Budget Trading Program
- 2009 Clean Air Interstate Rule
- 2015 Cross-State Air Pollution Rule (CSAPR)
- 2017 CSAPR Update
These emission control programs and their benefits are discussed on the EPA’s power sector website. As an example, implementation of the CSAPR Phase I began on January 1, 2015, and required 28 states in the eastern United States to significantly improve air quality by reducing EGU emissions that cross state lines and contribute to ground-level O3 and fine particulate matter (PM2.5) in downwind states. CSAPR was enacted under the Clean Air Act’s “good neighbor” provision to address regional interstate transport of O3 and PM2.5 pollution to comply with the 1997 O3 National Ambient Air Quality Standards (NAAQS) and the 2006 PM2.5 NAAQS, which were the standards in effect at the time. The rule required reductions in annual SO2, annual NOx, and O3 season NOx emissions.
The emission reductions achieved under these programs have resulted in a substantive improvement in air quality as demonstrated by air pollutant concentrations measured by CASTNET and other cooperating networks. By 2021, EGUs required to comply with the ARP and/or CSAPR had reduced their SO2 emissions to 940,000 short tons and NOx emissions to about 78,000 short tons, decreases of 92 and 87 percent, respectively, from 1990 levels.
Locations of Monitoring Sites
A map of CASTNET monitoring sites is provided in Figure 1. In 2021, 100 monitoring sites operated at 98 distinct locations. Native American tribes operated seven CASTNET sites in the central and northwestern United States. To estimate precision across the network, co-located sites operated at Mackville, KY (MCK131/231) and Rocky Mountain National Park, CO (ROM406/206). The ROM406/206 pair ensures consistency between EPA (ROM206) and NPS (ROM406). Of the two Rocky Mountain monitoring sites, ROM406 is specified as the regulatory monitoring site for O3. NADP AMoN sites are also displayed in Figure 1. If the AMoN site is co-located with a CASTNET site, its site ID is displayed with the CASTNET ID. If it is not co-located, it is shown with a black dot. Site locations can also be viewed on the CASTNET website.
Measurements Recorded at CASTNET Sites
During 2021, 94 CASTNET sites measured weekly ambient concentrations of acidic pollutants, base cations, and chloride (Cl -) using a 3-stage filter pack with a controlled flow rate (WSP, 2020; 2021; https://epa.gov/castnet/documents-reports). Gaseous pollutant concentrations include nitric acid (HNO3) and sulfur dioxide (SO2). Particulate concentrations include nitrate (NO3-), ammonium (NH4+ ), sulfate (SO42- ), magnesium (Mg 2+ ), calcium (Ca 2+ ), potassium (K + ), sodium (Na + ), and Cl -. The filter pack is replaced each Tuesday and shipped to the CASTNET analytical chemistry laboratory for analysis. Ambient temperature is measured at all sites in part to enable conversion of concentrations to local conditions.
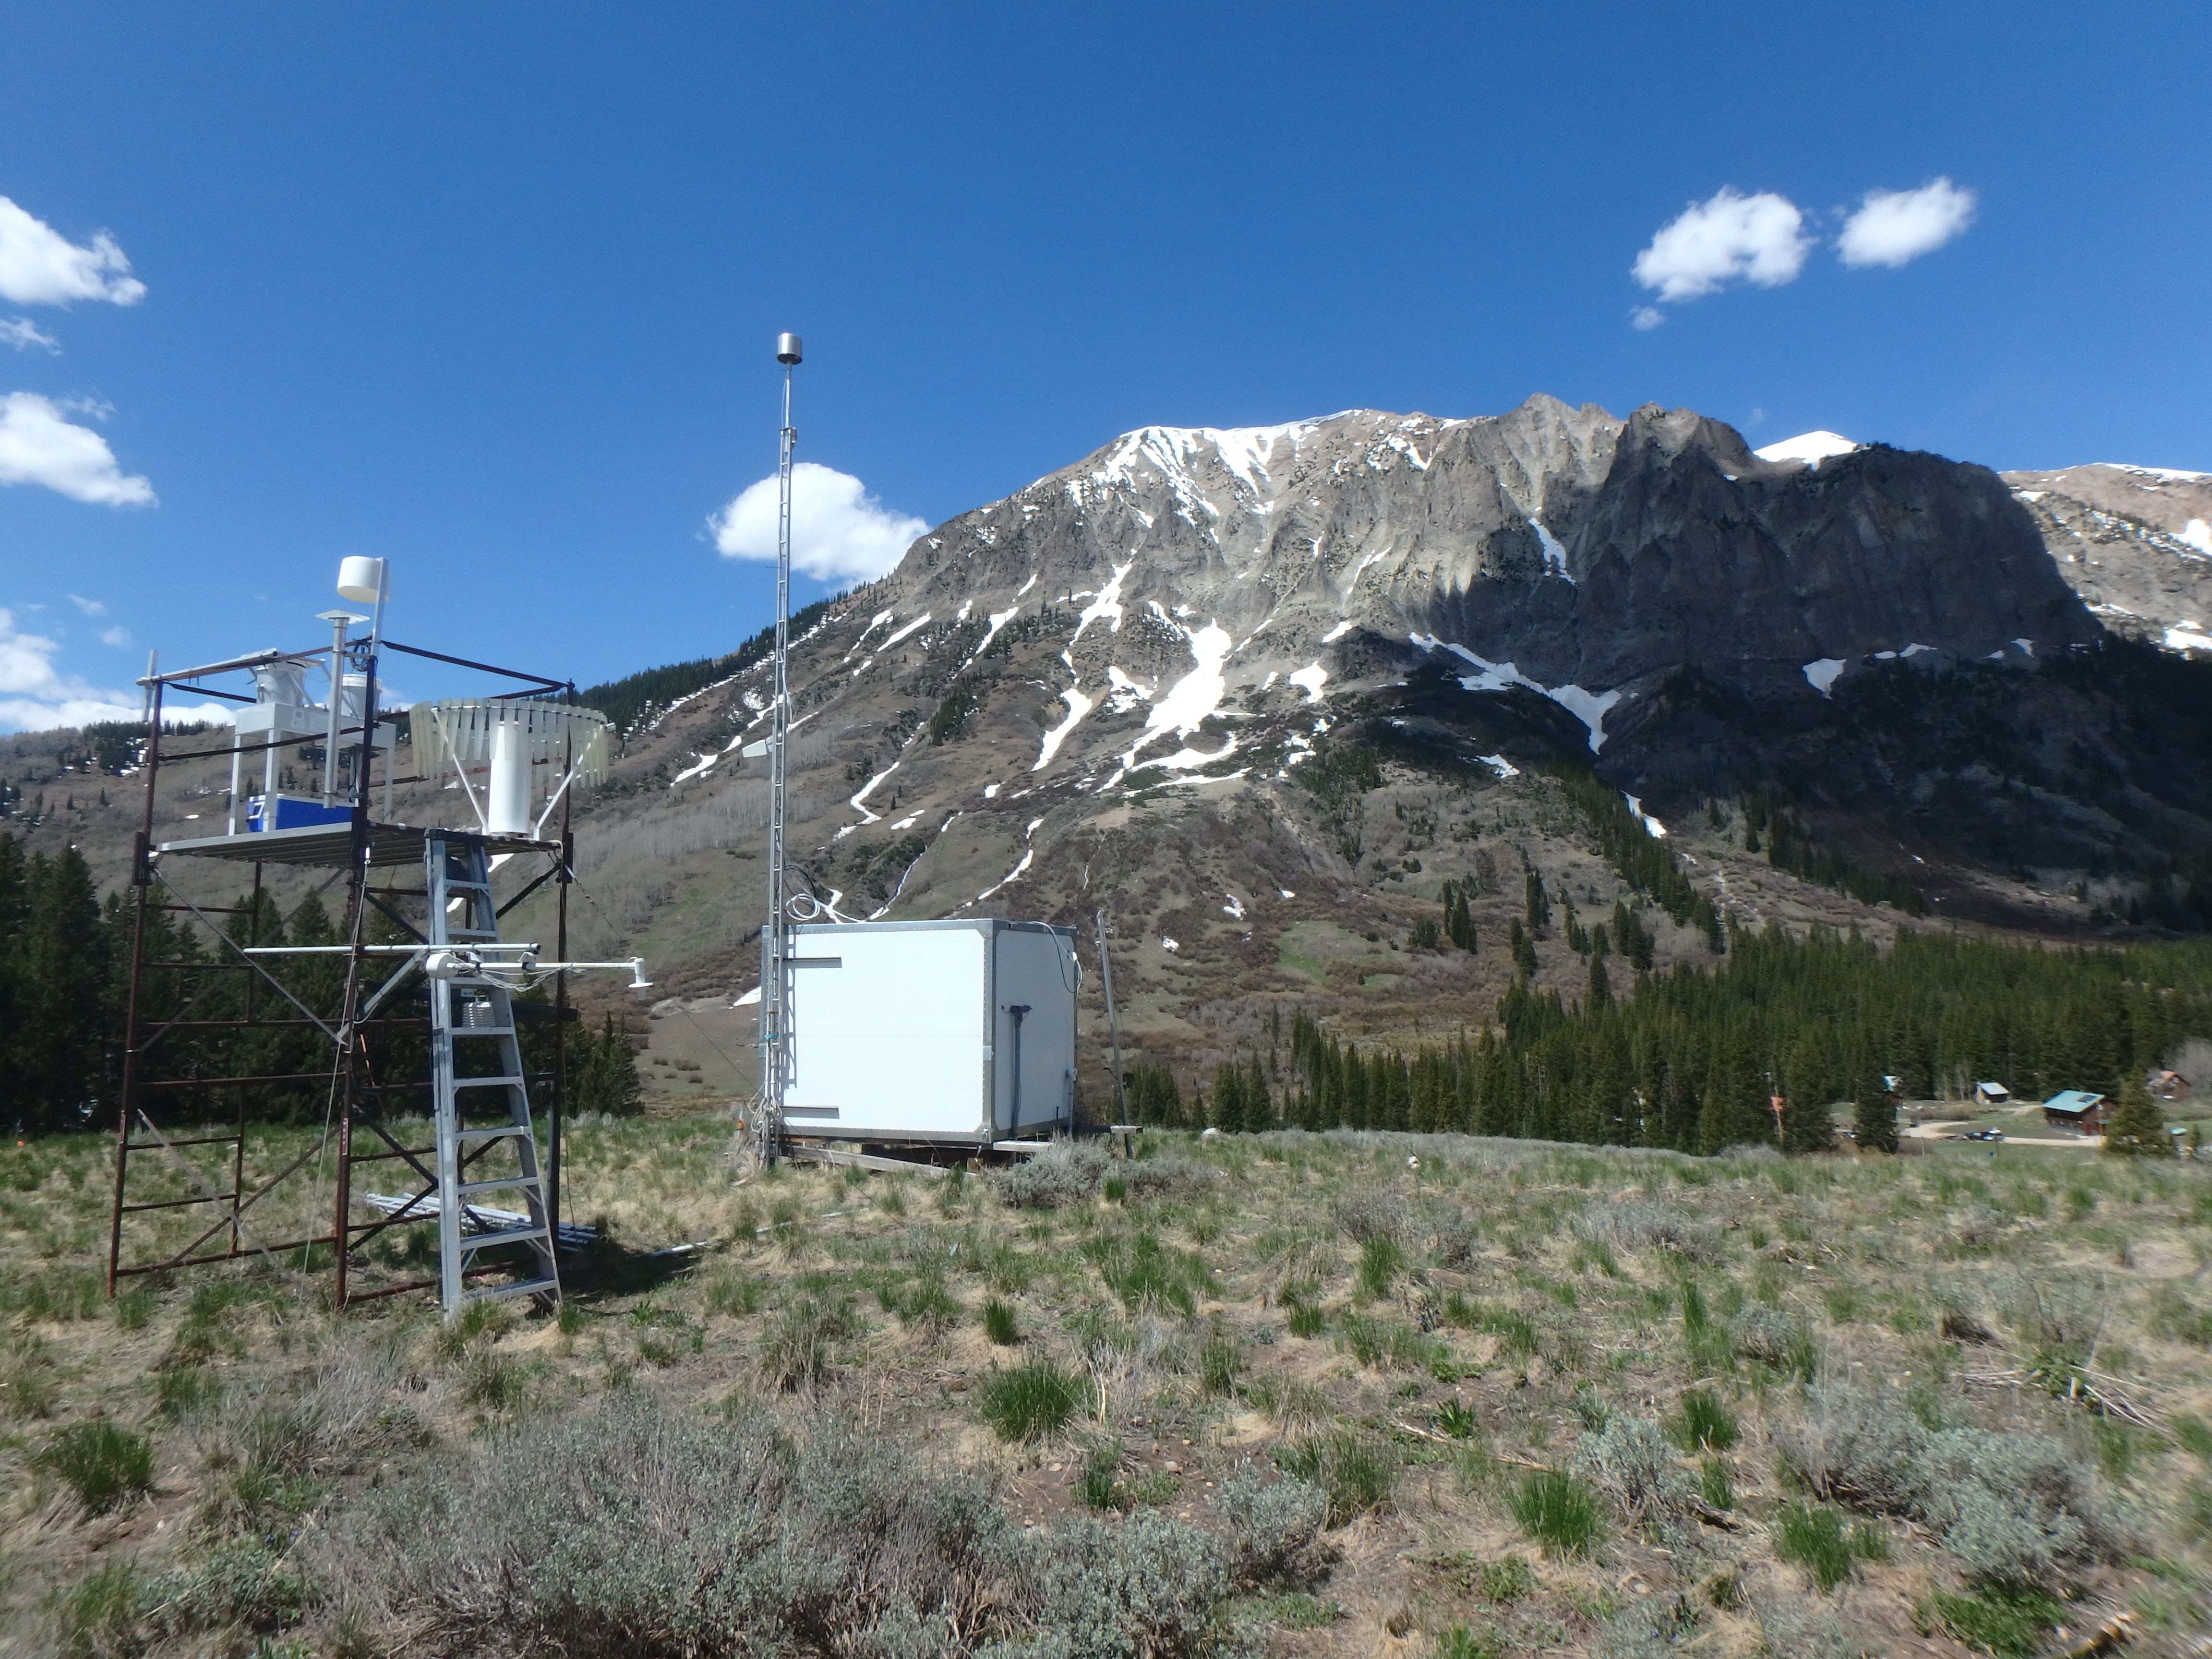
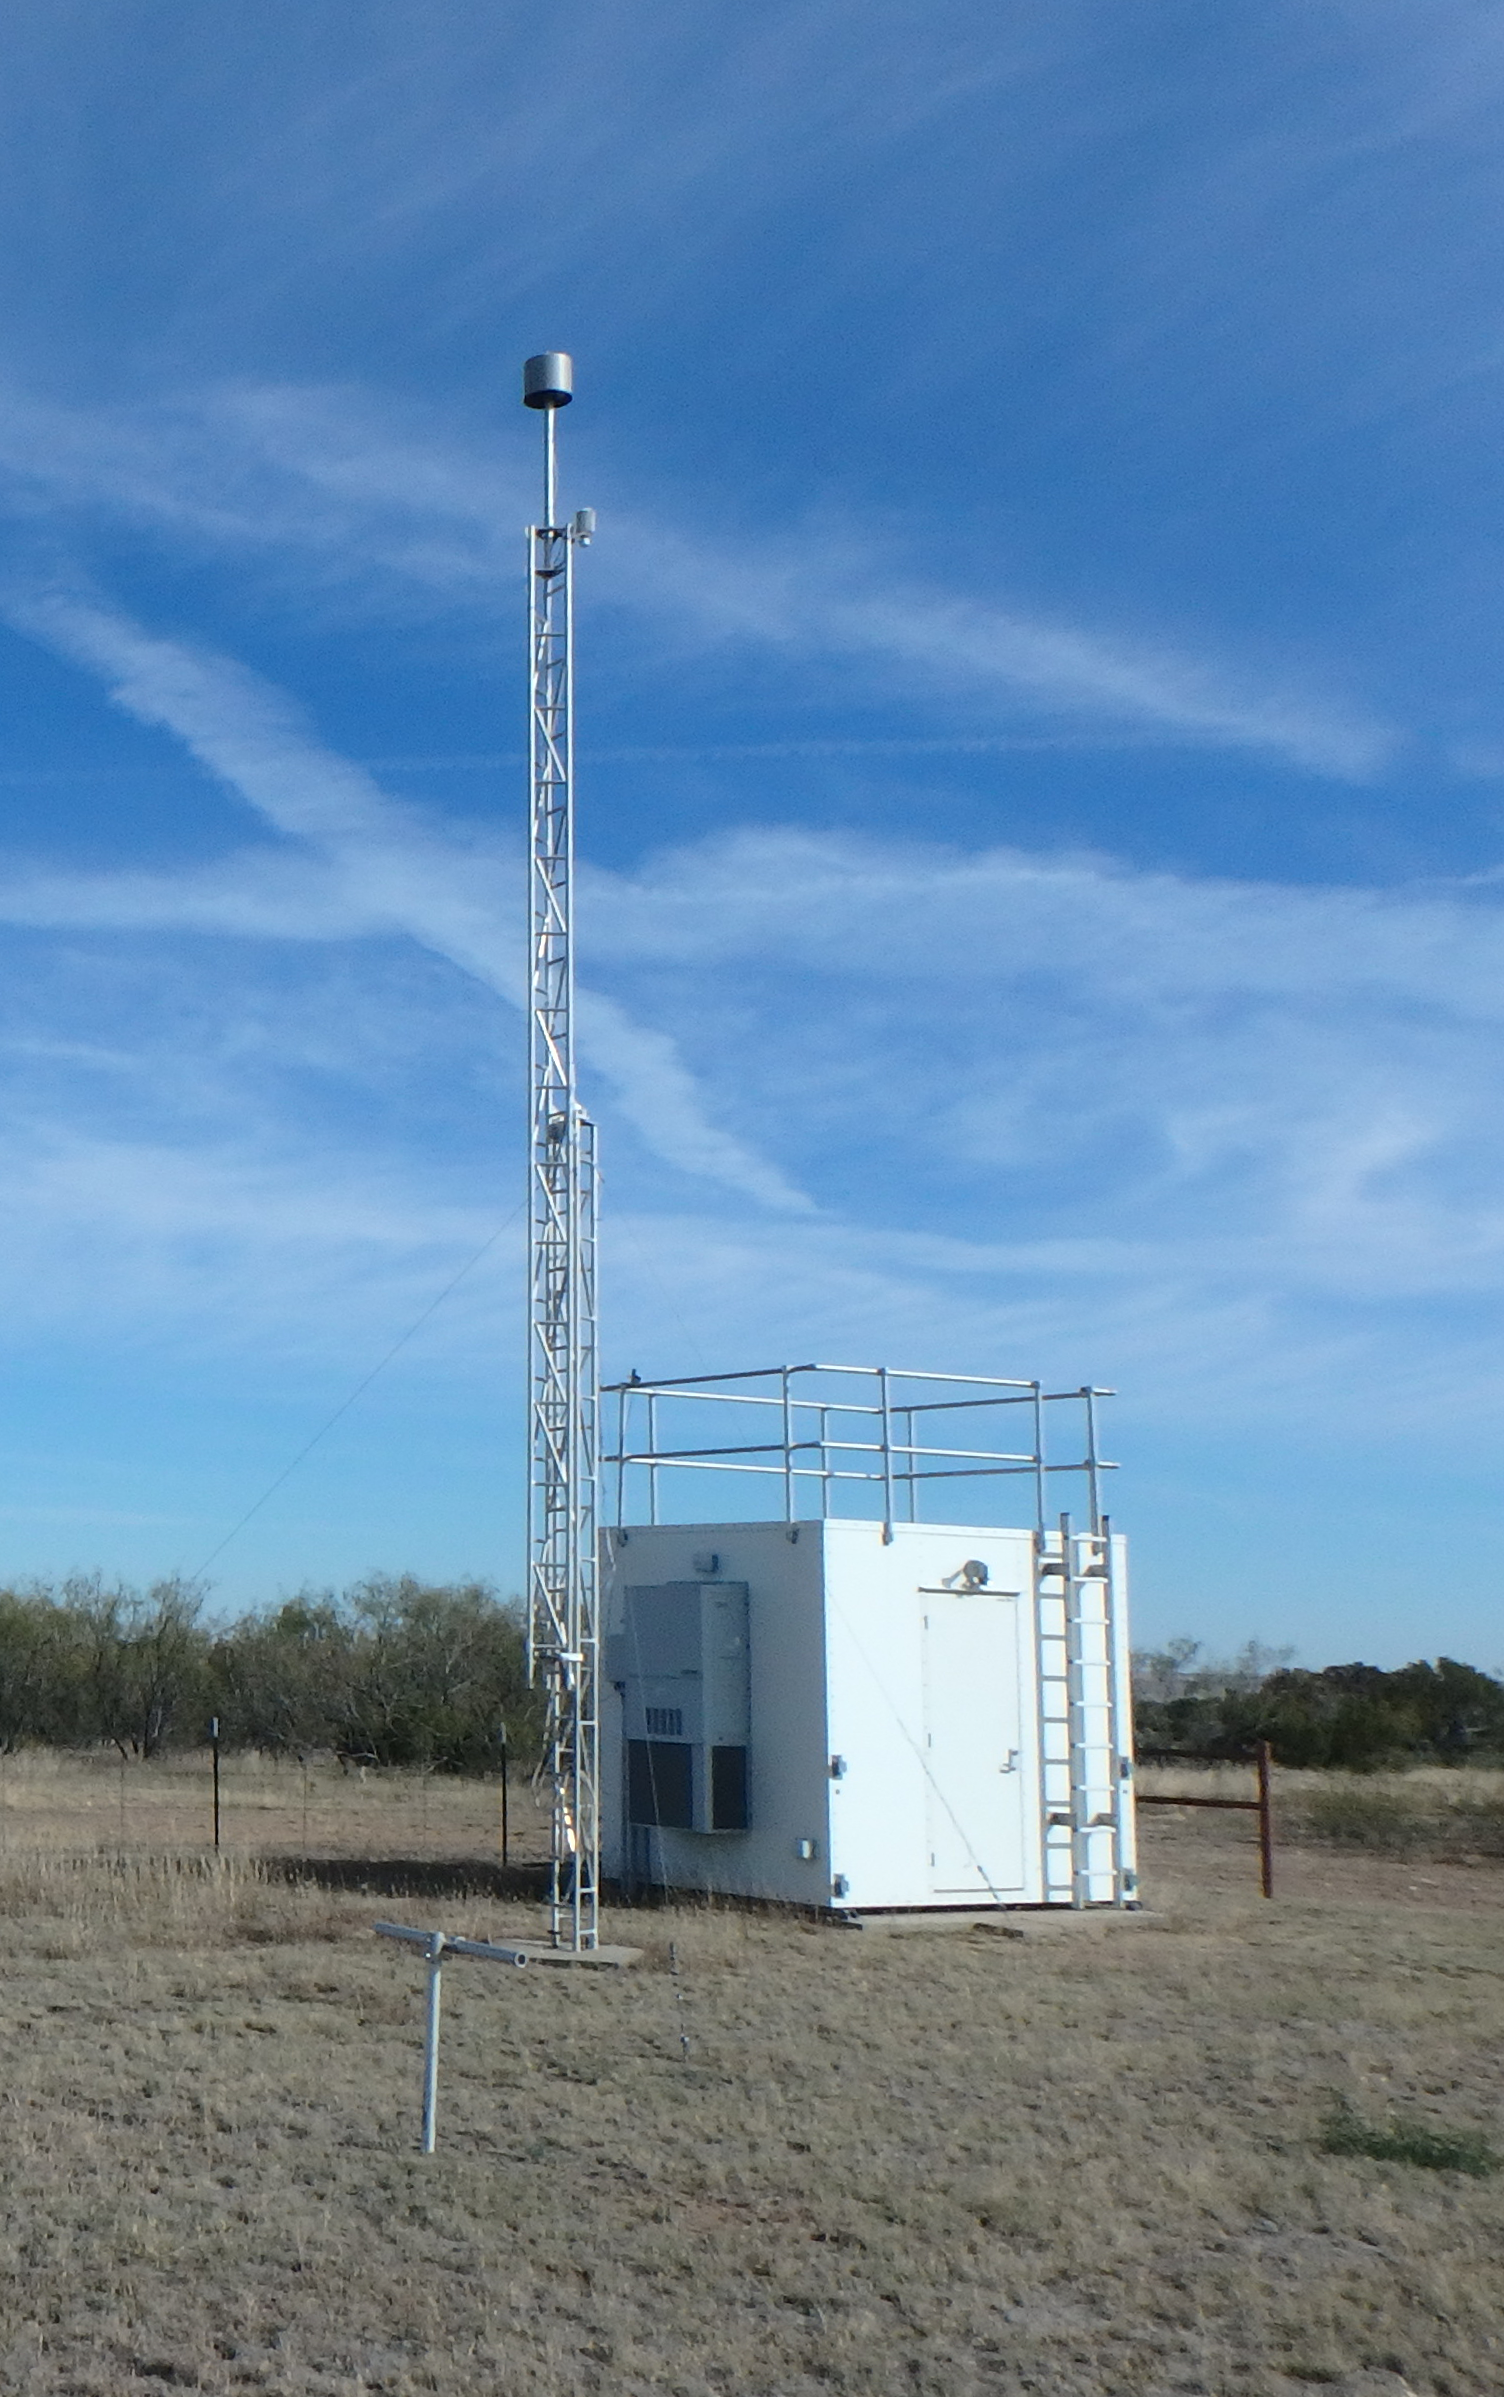
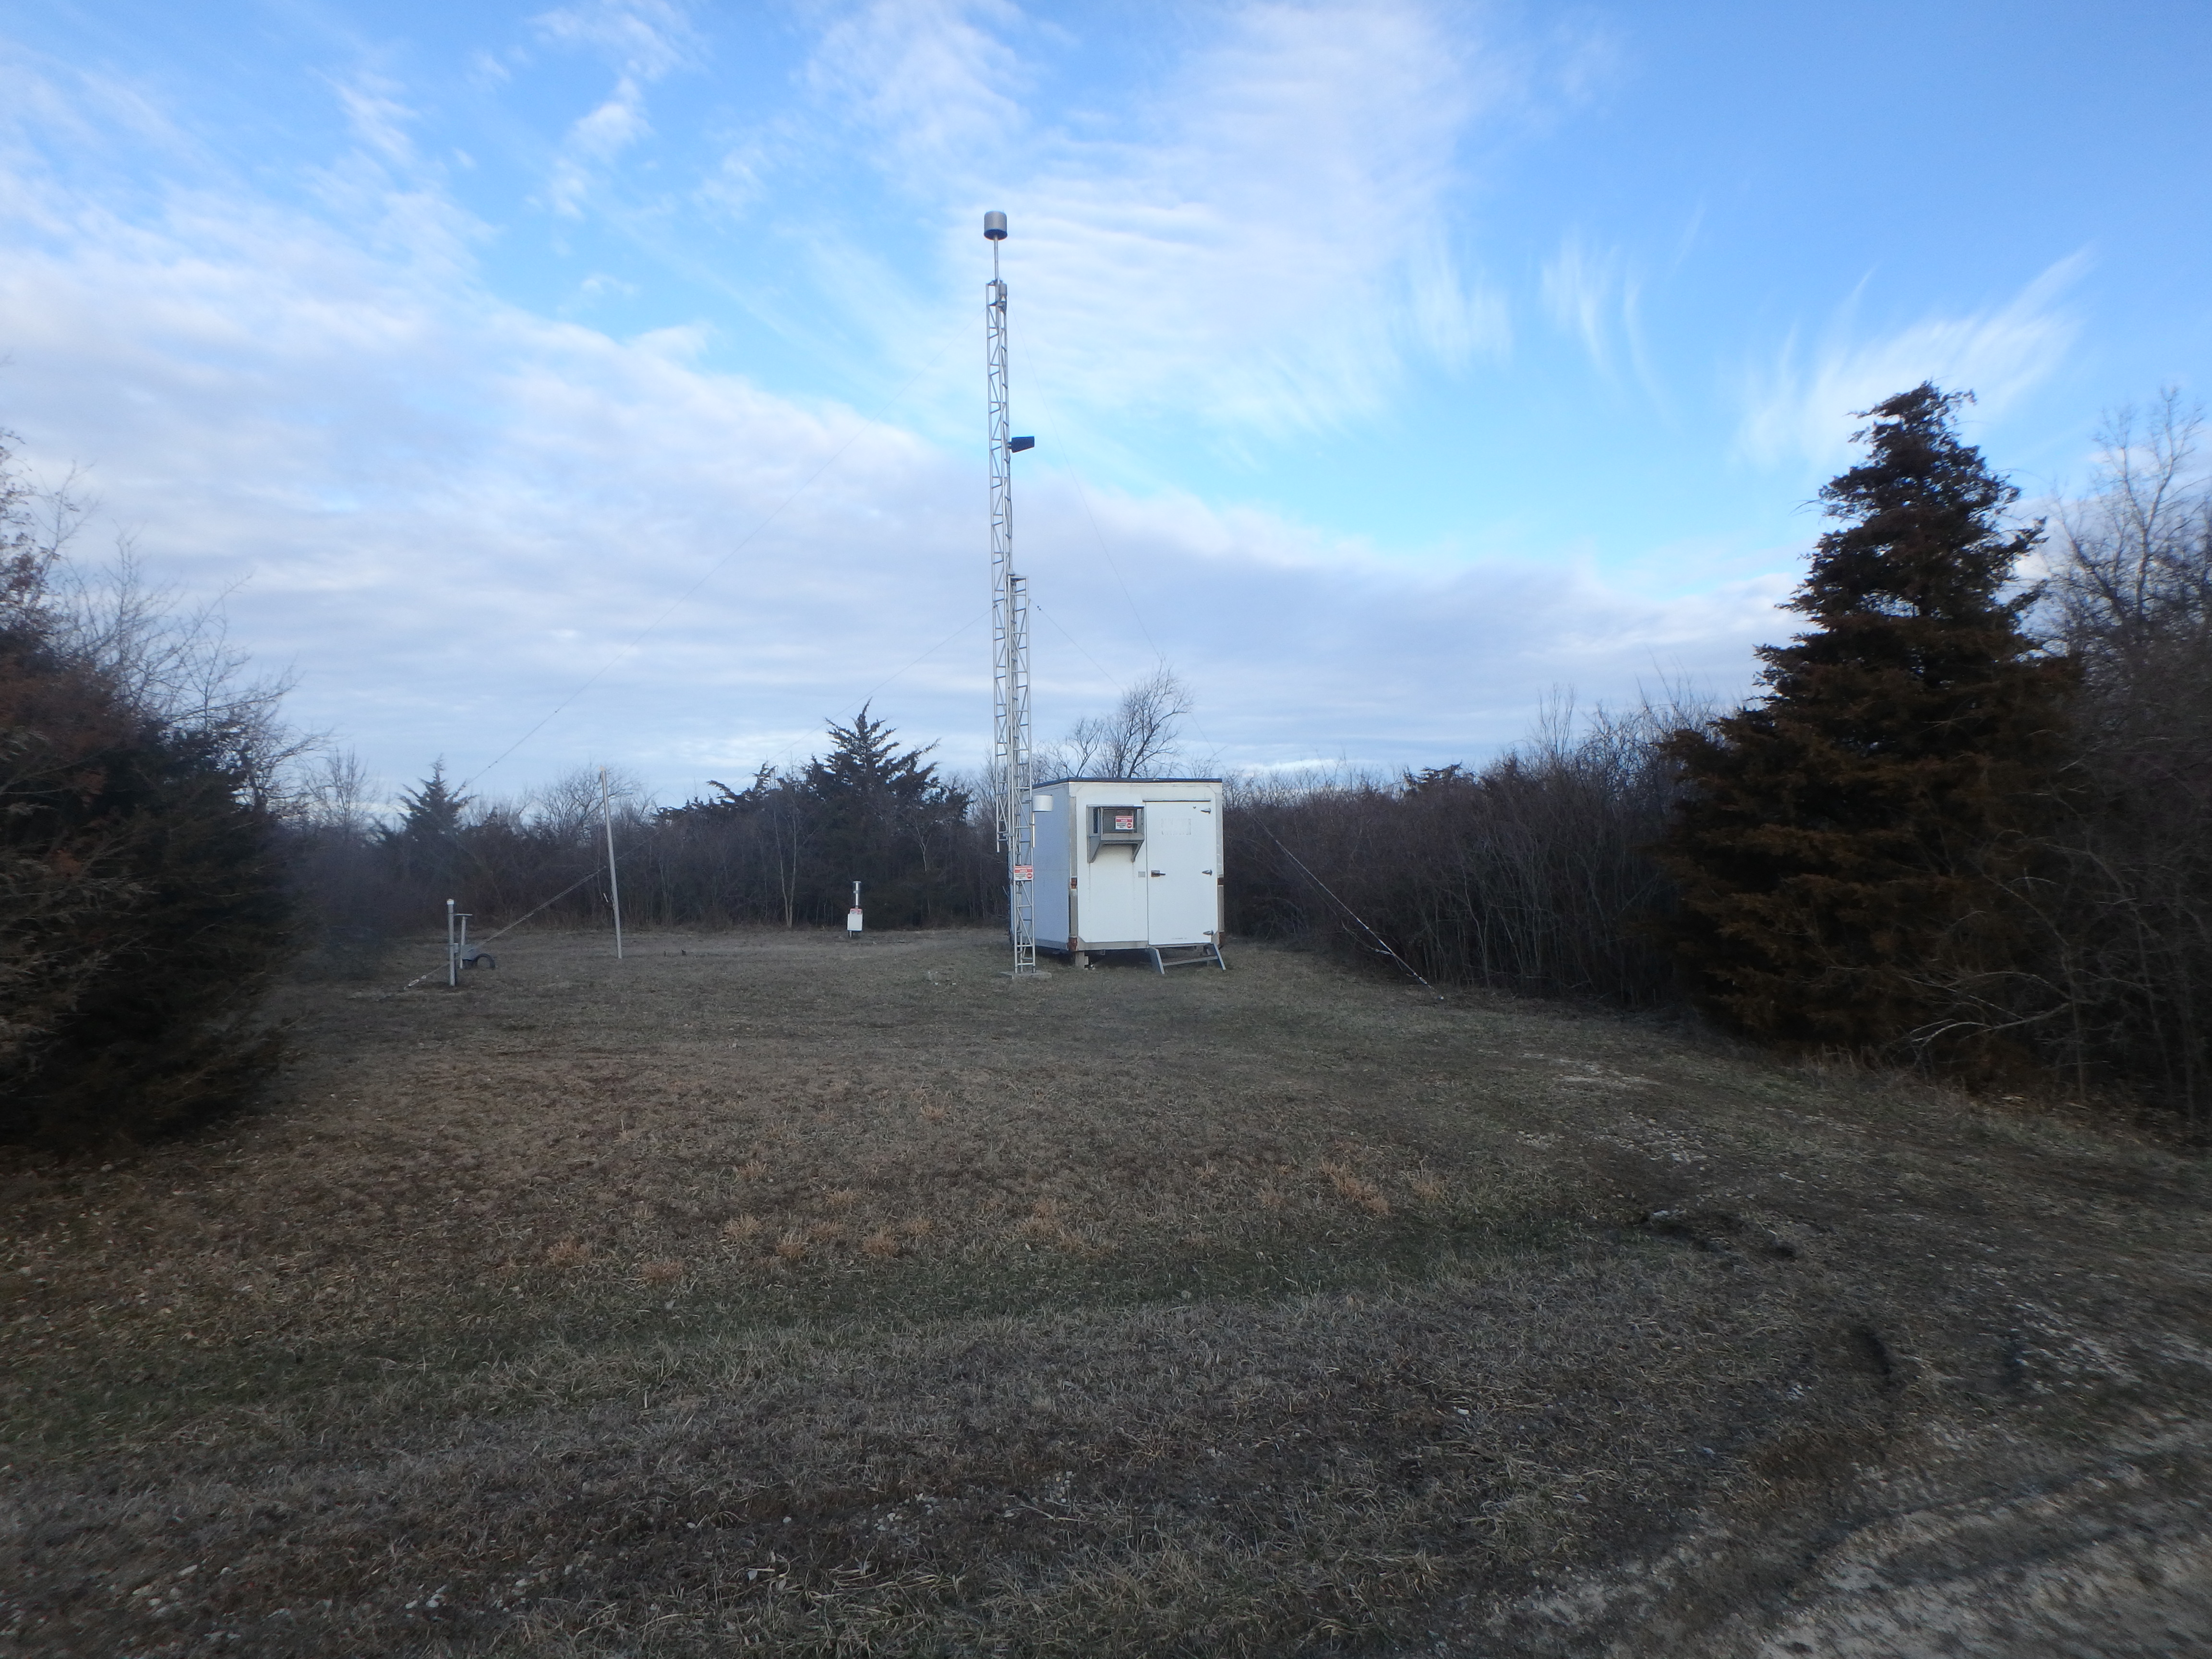
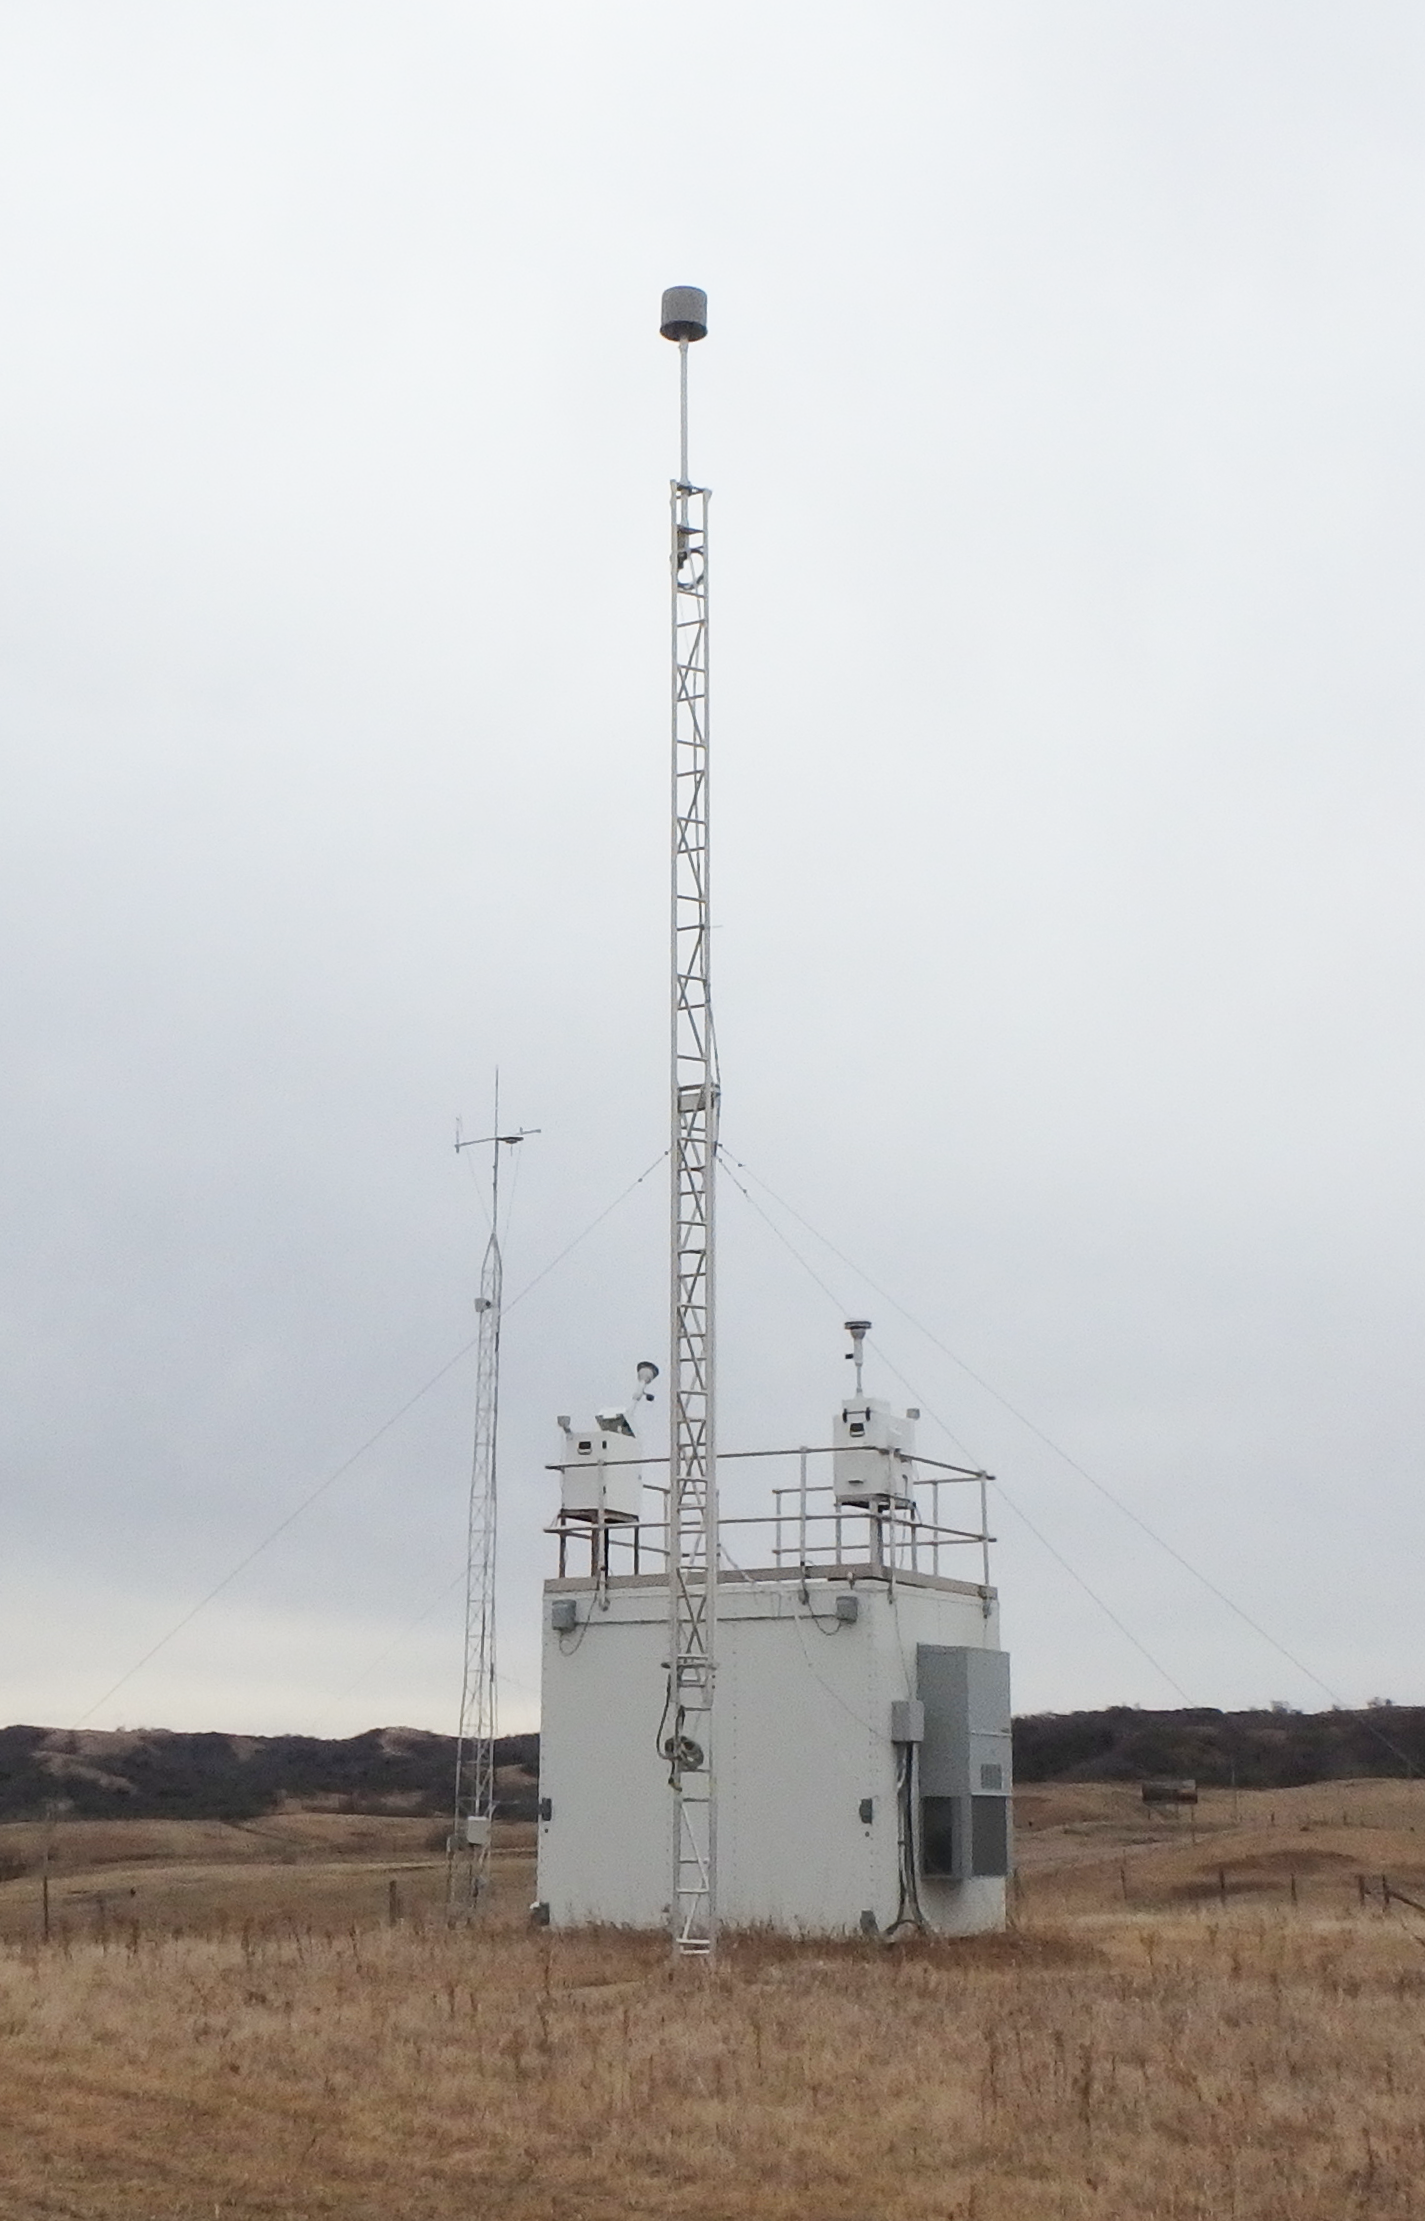
Most CASTNET sites include a temperature-controlled shelter and continuous O3 monitoring system. CASTNET also deploys a small-footprint monitoring station that does not require a walk-in shelter. These sites can be operated using conventional or alternative power sources (wind/solar). The ability to use alternative power sources allows these sites to be placed in remote areas that are off the electrical grid. During 2021, CASTNET operated 12 small-footprint sites. Ozone concentrations were measured at 88 of the 100 sites. The O3 inlet and filter pack are located atop a 10-meter (m) tower. Some CASTNET sites also measure trace-level NO/total nitrogen oxides (NOx), SO2, carbon monoxide, and nitric oxide/total reactive oxides of nitrogen (NO/NOy). In 2021, meteorological parameters were measured at 5 EPA-, 31 NPS-, and 5 BLM-sponsored CASTNET sites. Measured meteorological parameters include 2-m temperature, wind speed and direction, standard deviation of the wind direction, solar radiation, relative humidity, precipitation, and surface wetness (at select sites).
Trends in fourth highest daily maximum 8-hour average (DM8A) O3 concentrations and annual sulfur and nitrogen levels are depicted in the following sections using box plots showing 1-year mean, median, and annual distributions of concentrations aggregated from 34 eastern reference sites for 1990 through 2021 and from 16 western reference sites for 1996 through 2021. The reference sites were selected for their long-term data records and consistent performance. All data used to create the figures and maps in this report are available on the CASTNET website
Related Air Quality Networks
CASTNET monitors air quality and deposition in cooperation with other long-term national and international networks, which produce data that EPA uses to assess the effectiveness of emission control programs and to characterize rural air quality nationwide. Although not shown in Figure 1, CASTNET sites are often co-located with one or more of the networks listed below. This includes the NADP and its other networks operated in addition to AMoN:
- National Trends Network (NTN)
- Mercury Deposition Network (MDN)
- Atmospheric Mercury Network (AMNet)
Other cooperating networks include:
- Canadian Air and Precipitation Monitoring Network (CAPMoN)
- EPA’s National Core Monitoring (NCore)
- BLM’s Wyoming Air Resources Monitoring System (WARMS)
- Interagency Monitoring of Protected Visual Environments (IMPROVE)
Building Tribal Partnerships with CASTNET Monitoring Sites
EPA partners with Cherokee Nation in Oklahoma (CHE185), the Alabama-Coushatta Tribe in Texas (ALC188), the Santee Sioux Tribe in Nebraska (SAN189), Kickapoo Tribe in Kansas (KIC003), the Red Lake Band of Chippewa Indians in Minnesota (RED004), the Nez Perce Tribe in Idaho (NPT006), and the Confederated Tribes of the Umatilla Indian Reservation in Washington (UMA009) to operate CASTNET sites on tribal lands. Most tribal sites utilize a small-footprint monitoring station that does not require a temperature-controlled shelter. The small-footprint design has produced cost savings and increased efficiency in terms of installation and power. EPA is interested in supporting additional tribal groups that want to establish small-footprint sites to monitor O3 concentrations and assess sulfur and nitrogen inputs to their surrounding ecosystems.
Air Quality Impacts Due to Climate Change
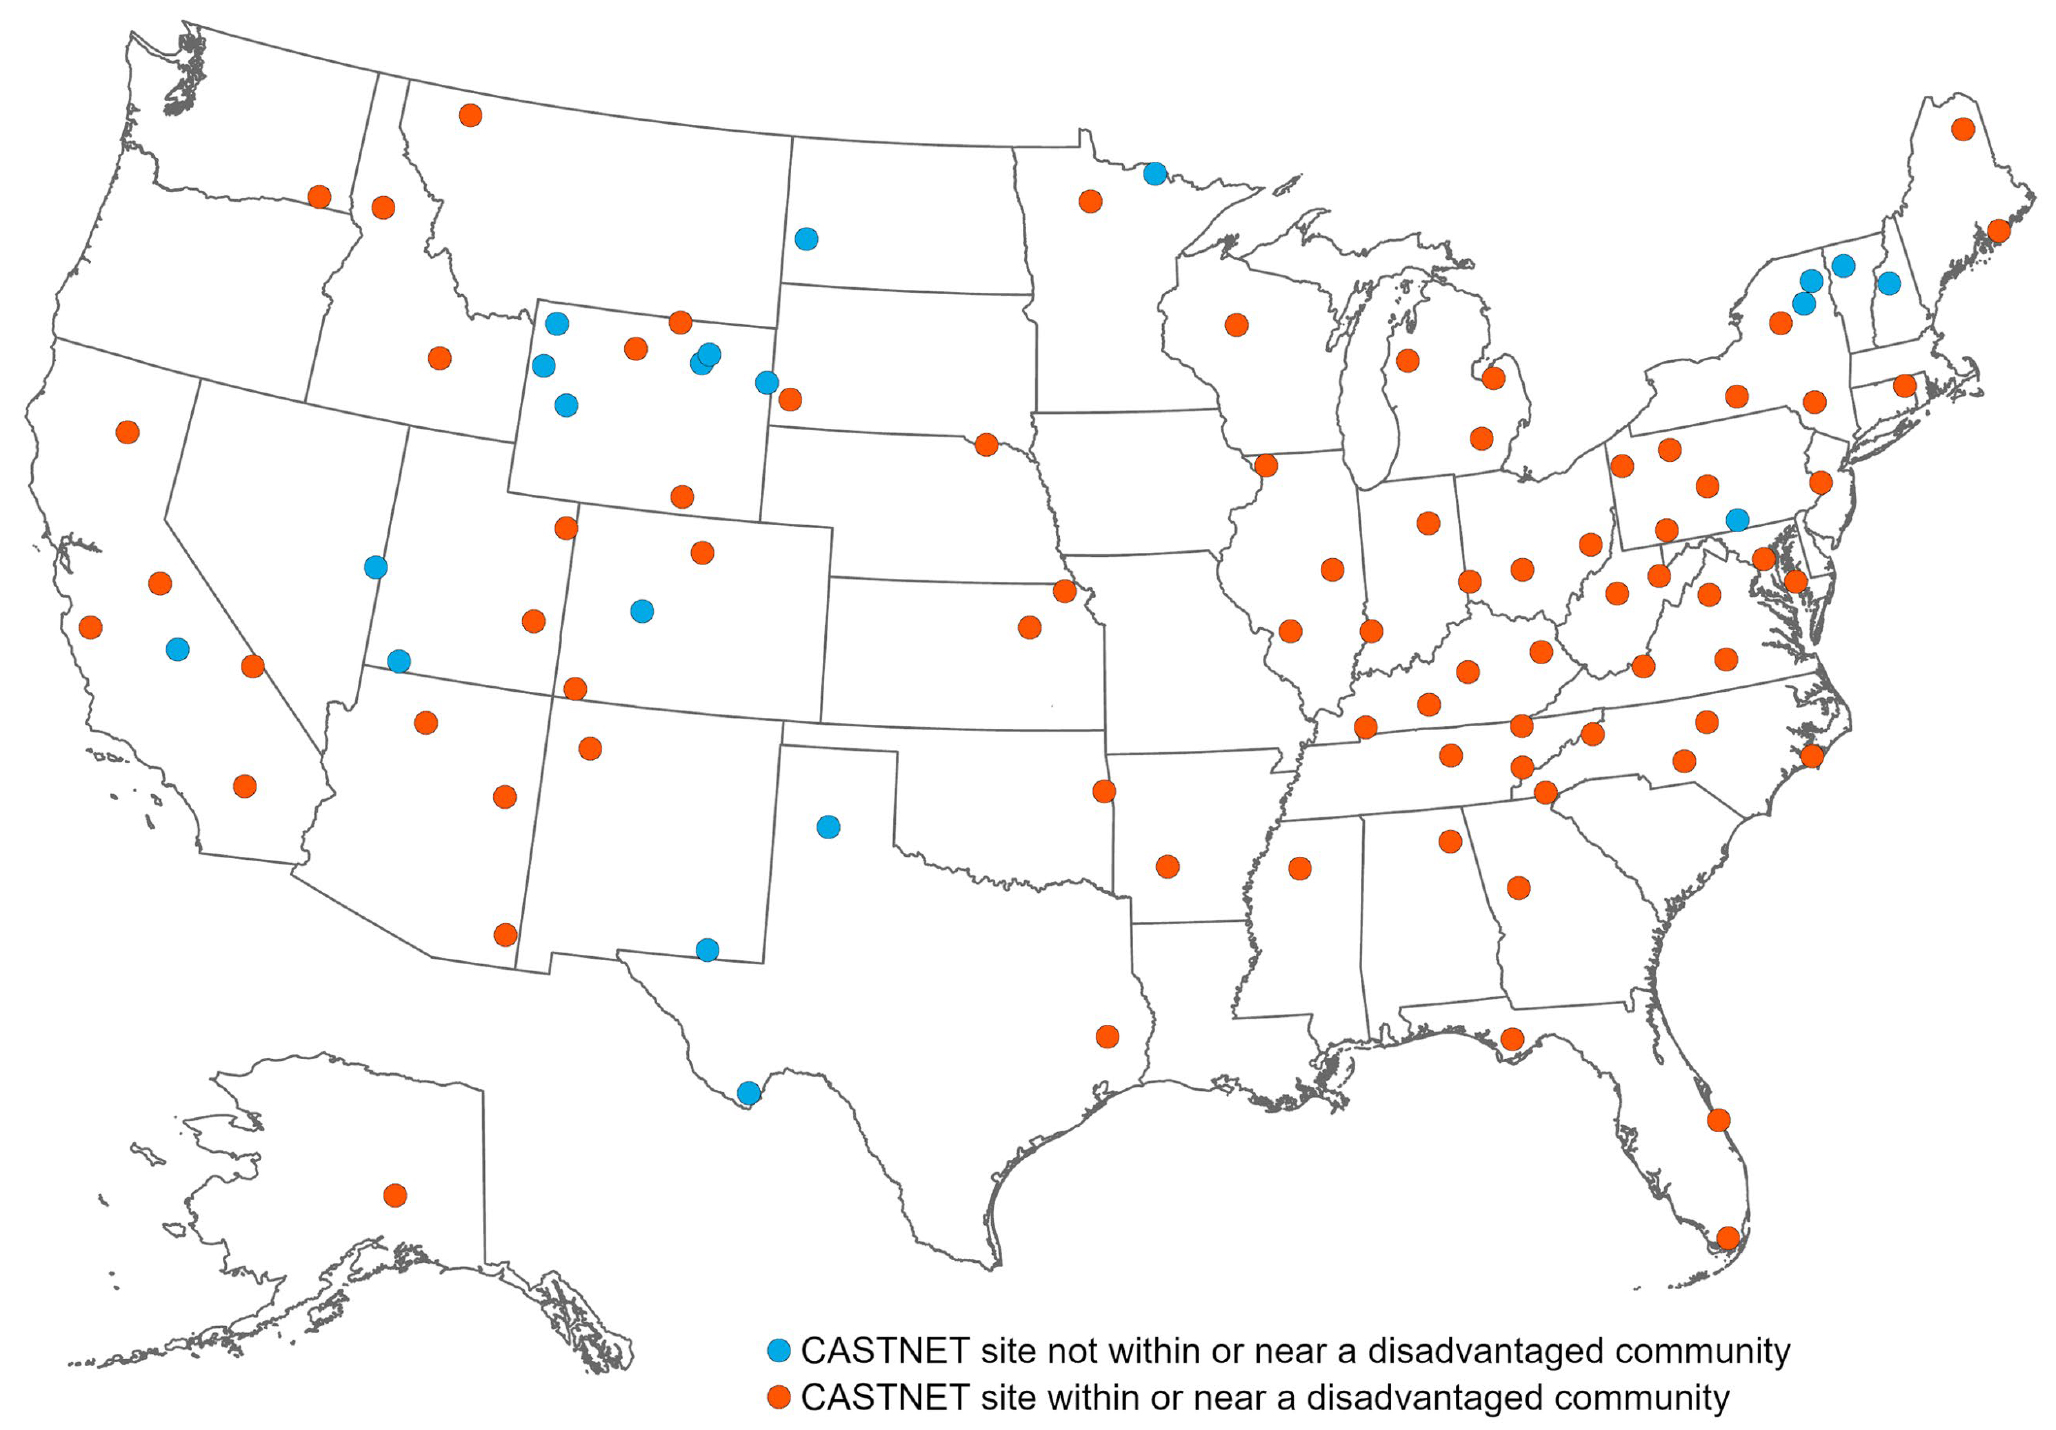
CASTNET provides a consistent data record that can be used to evaluate how short-term (extreme precipitation) and long-term (increasing temperature) changes impact air quality and the environment. CASTNET data are used to assess how and where emission reduction programs may become less effective due to climate change. CASTNET provides air quality data to communities that often lack state, local, or tribal monitors but have been disproportionately impacted by environmental or socioeconomic burdens. EPA has committed to reducing pollution within environmental justice communities. Figure 2 shows CASTNET sites in red that are located within or near (within 20 km) disadvantaged communities. These were identified using the Council on Environmental Quality’s Climate and Economic Justice Screening Tool.
Quality Assurance Program
The CASTNET quality assurance (QA) program was established to ensure that all reported data are of known and documented quality in order to meet CASTNET objectives. The QA program also ensures intra-network consistency and comparability and the delivery of data that are reproducible and comparable with data from other monitoring networks. The 2021 QA program elements are documented in the CASTNET Quality Assurance Project Plan (QAPP; WSP, 2020; 2021). The QAPP includes standards and policies for all components of project operation, from site selection through final data reporting, with appendices that provide standard operating procedures for CASTNET operations. QA program metrics are available in quarterly and annual QA reports posted on the EPA CASTNET website.
Ozone Concentrations
CASTNET O3 measurements are subject to rigorous QA/quality control procedures specified by federal regulations and the CASTNET QA Program. Hourly average concentrations were measured at 88 CASTNET sites in 2021. Data from 87 sites were delivered routinely to the EPA Air Quality System (AQS) database. One site, Duke Forest, NC (DUK008), is a research site operated by EPA’s Office of Research and Development and does not meet regulatory siting criteria. The O3 inlet at DUK008 is located above the forest canopy near the top of a 30 m tower. Two co-located monitors were designated as NAAQS-excluded, and the associated data from these monitors were used for QA purposes only. With the exception of DUK008 and the two NAAQS excluded sites, data were used to calculate the three-year average of the fourth highest DM8A O3 concentrations if three years of Title 40 Code of Federal Regulations Part 58-compliant data were available (Figure 3). CASTNET measurements provide data to support comparison with the O3 NAAQS and to assess long-term trends and geographic patterns in regional O3.
The primary O3 NAAQS is designed to protect public health. The secondary standard is designed to protect public welfare and the environment. On October 1, 2015, the EPA promulgated a revision to the O3 NAAQS, lowering the level of both the primary and secondary standards to 0.070 parts per million (ppm). On December 23, 2020, EPA decided to retain the 2015 O3 NAAQS without changes to the form or level. To attain the 2015 standard, the three-year average of the fourth highest DM8A O3 concentrations measured at each monitor within a specified area must not exceed 0.070 ppm or 70 parts per billion (ppb) in practice. For this report, the 2015 standard and related calculations were used. The design values for each standard can be downloaded from the EPA Air Quality Design Values website.
The EPA and other federal, tribal, state, and local agencies measure hourly O3 concentrations through national and local monitoring programs. Measurements potentially affected by exceptional events, i.e., unusual or natural events that can affect air quality but are not reasonably controllable, were not removed when calculating the fourth highest daily maximum values for this report (https://www.epa.gov/air-quality-analysis/exceptional-events-rule-and-guidance).
Three-year averages of the fourth highest DM8A O3 concentrations for 2019 through 2021 are presented in Figure 3. Ozone concentrations were not included on the map if the three-year average was not available because of incomplete data; these sites are shown as dots with no value. Table 1 lists sites with 2019–2021 O3 design values exceeding 70 ppb, the level of the 2015 O3 NAAQS.
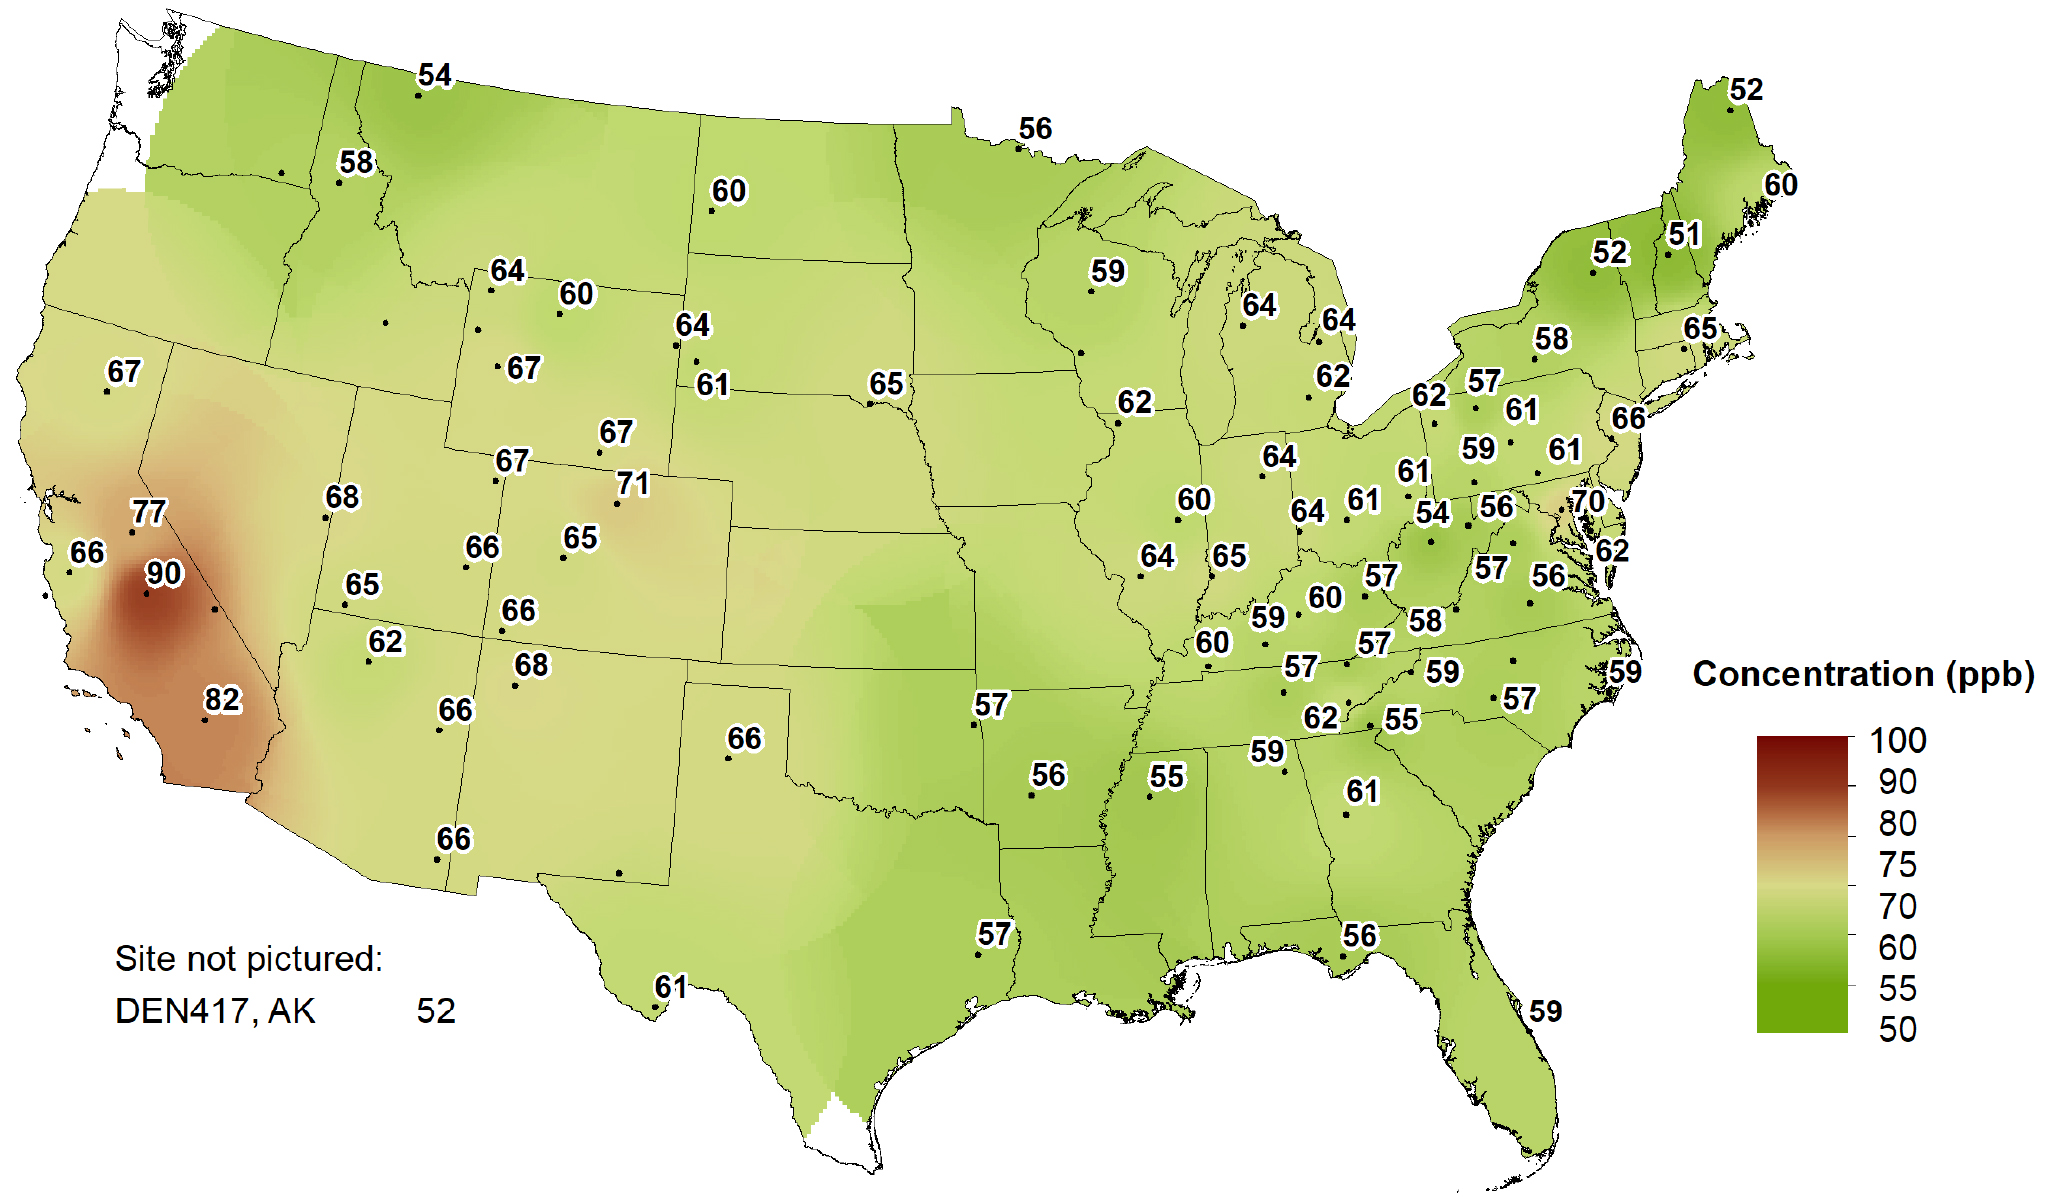
Table 1 2019–2021 O3 Design Values Greater than 70 ppb
| Site ID | State | Sponsor | 3-year Average |
|---|---|---|---|
| SEK430 | California | NPS | 90 |
| JOT403 | California | NPS | 82 |
| YOS404 | California | NPS | 77 |
| ROM406 | Colorado | NPS | 71 |
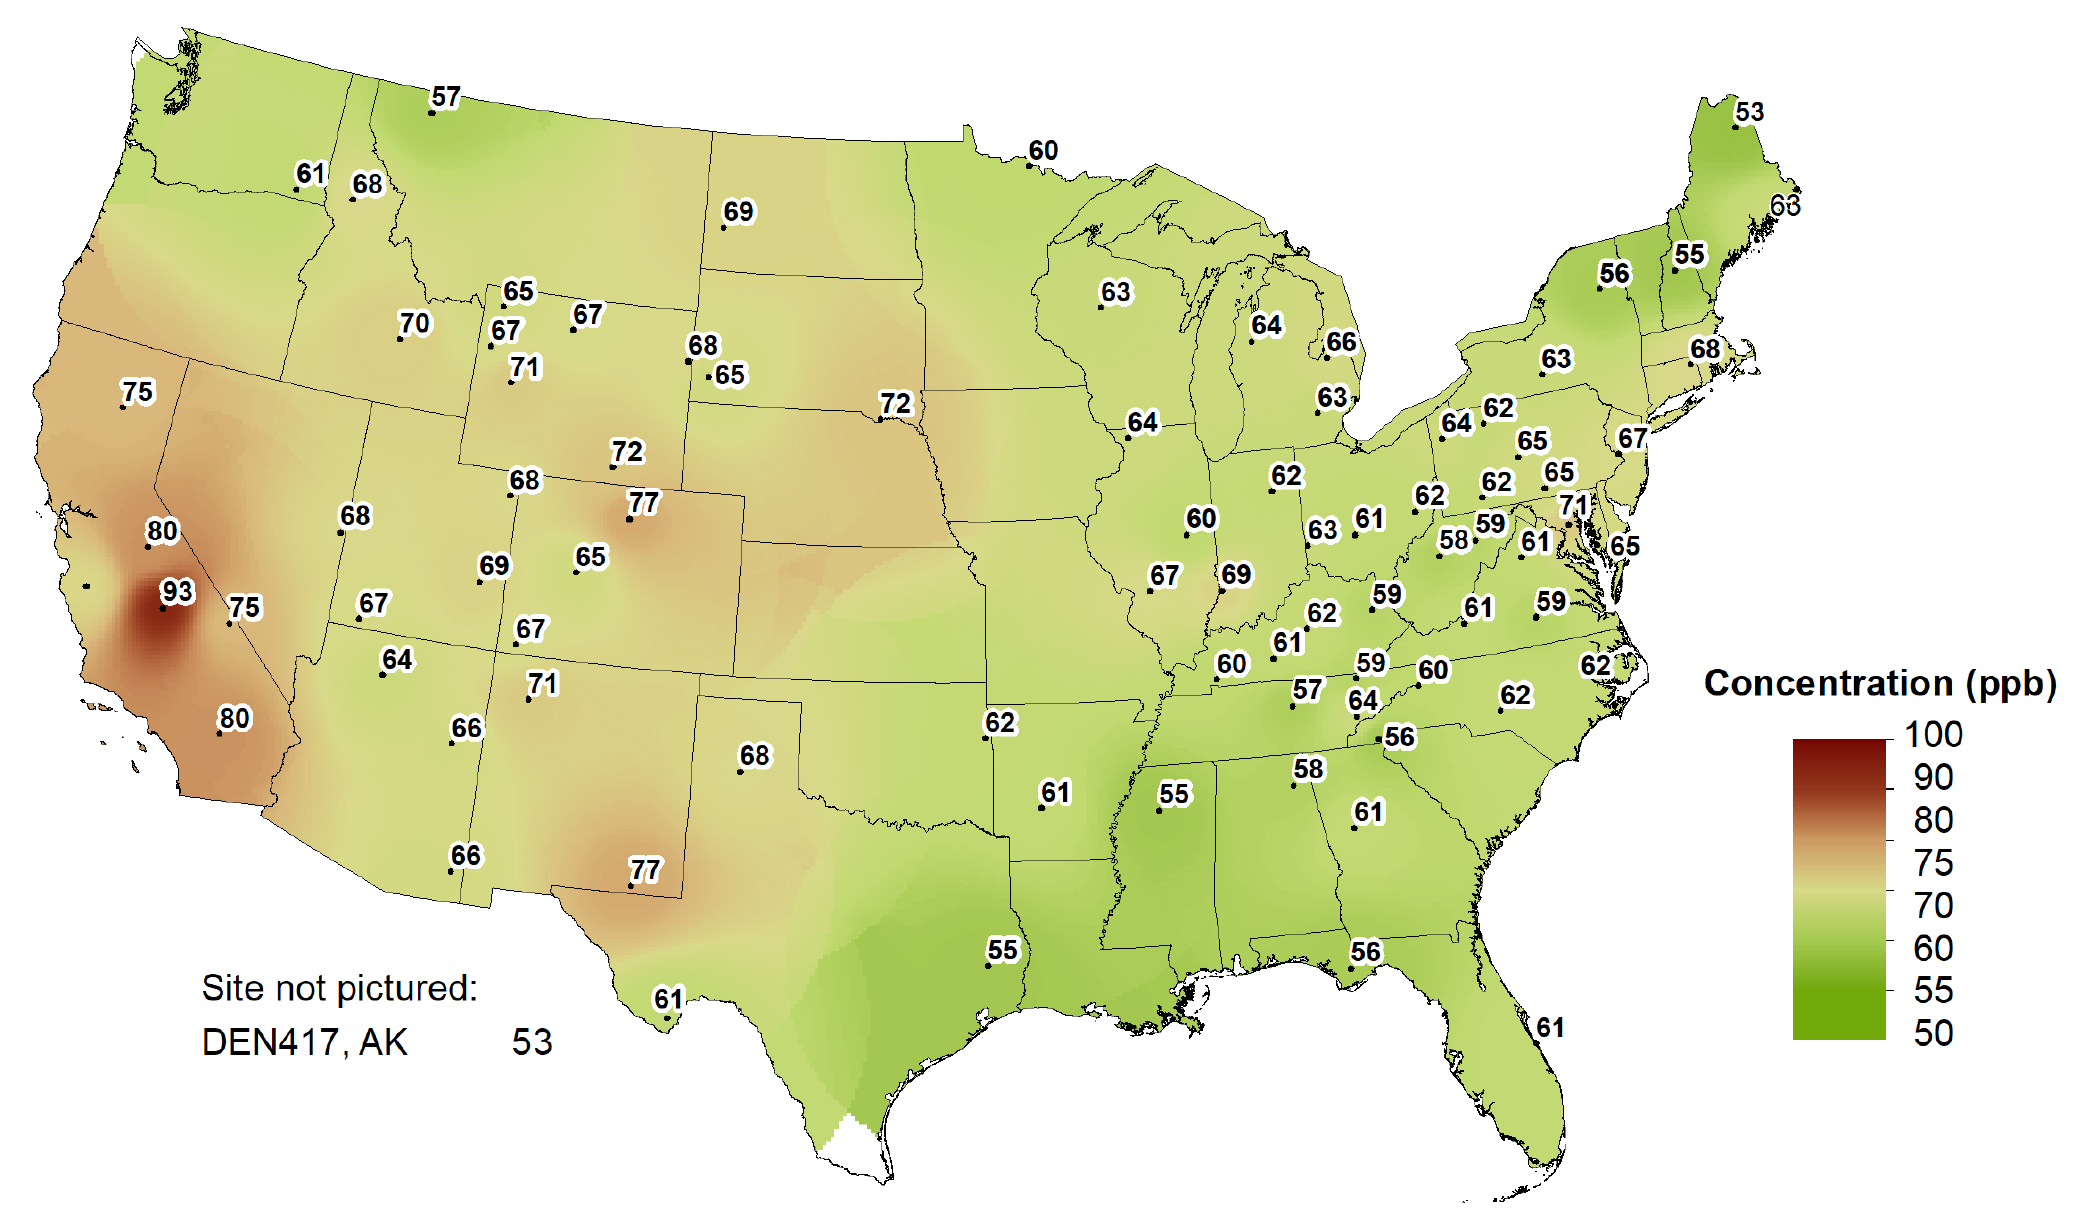
Figure 4 shows 2021 fourth highest DM8A O3 concentrations that met percent completeness criteria.
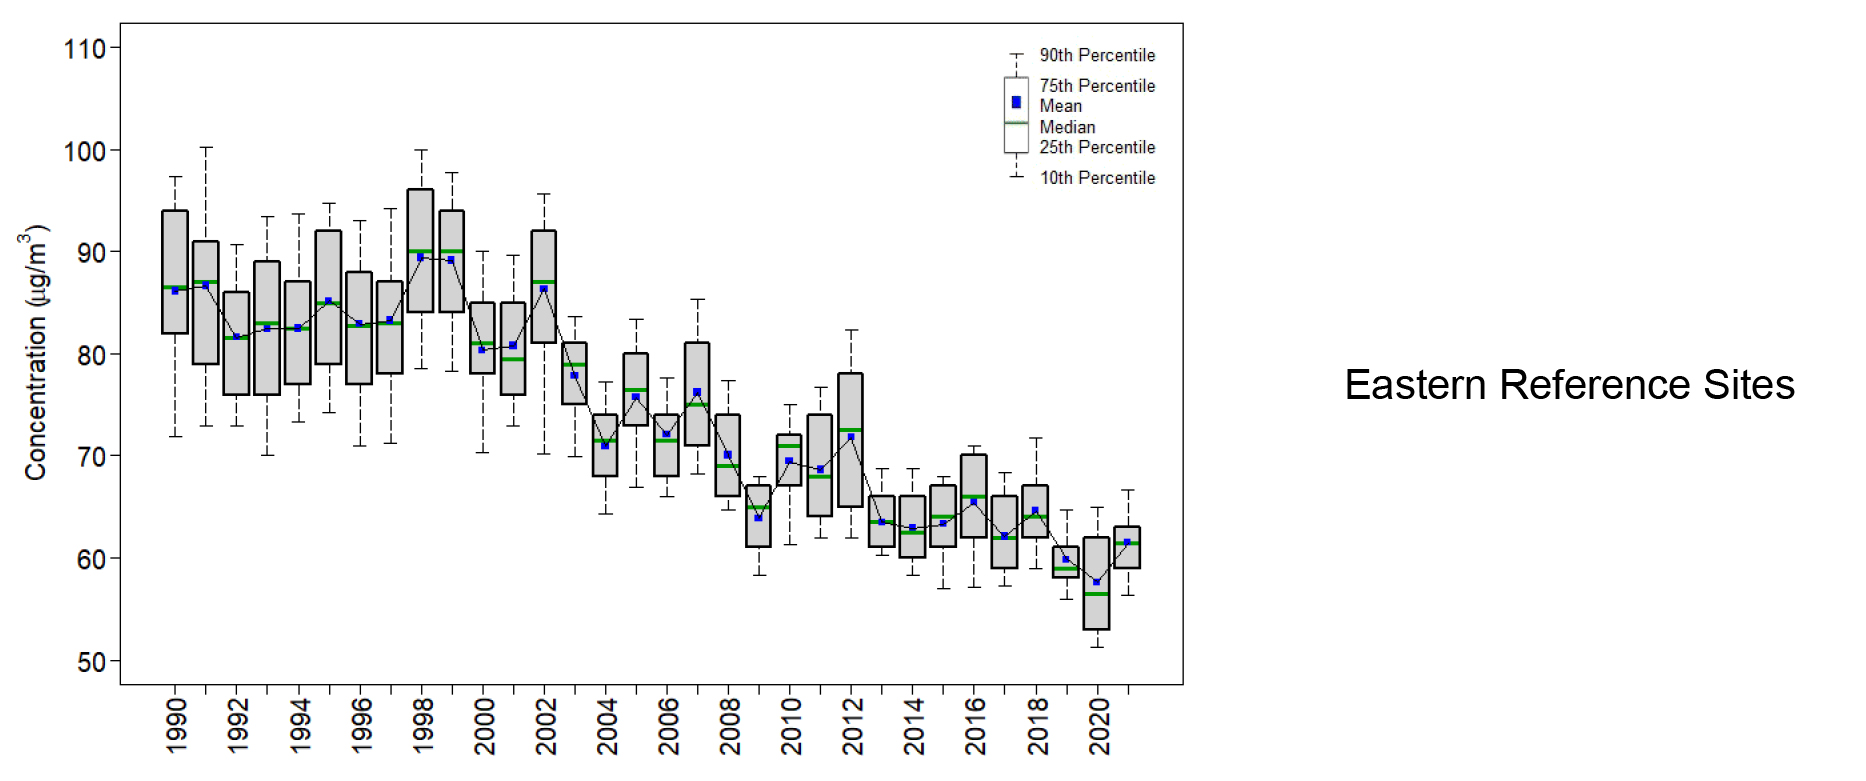
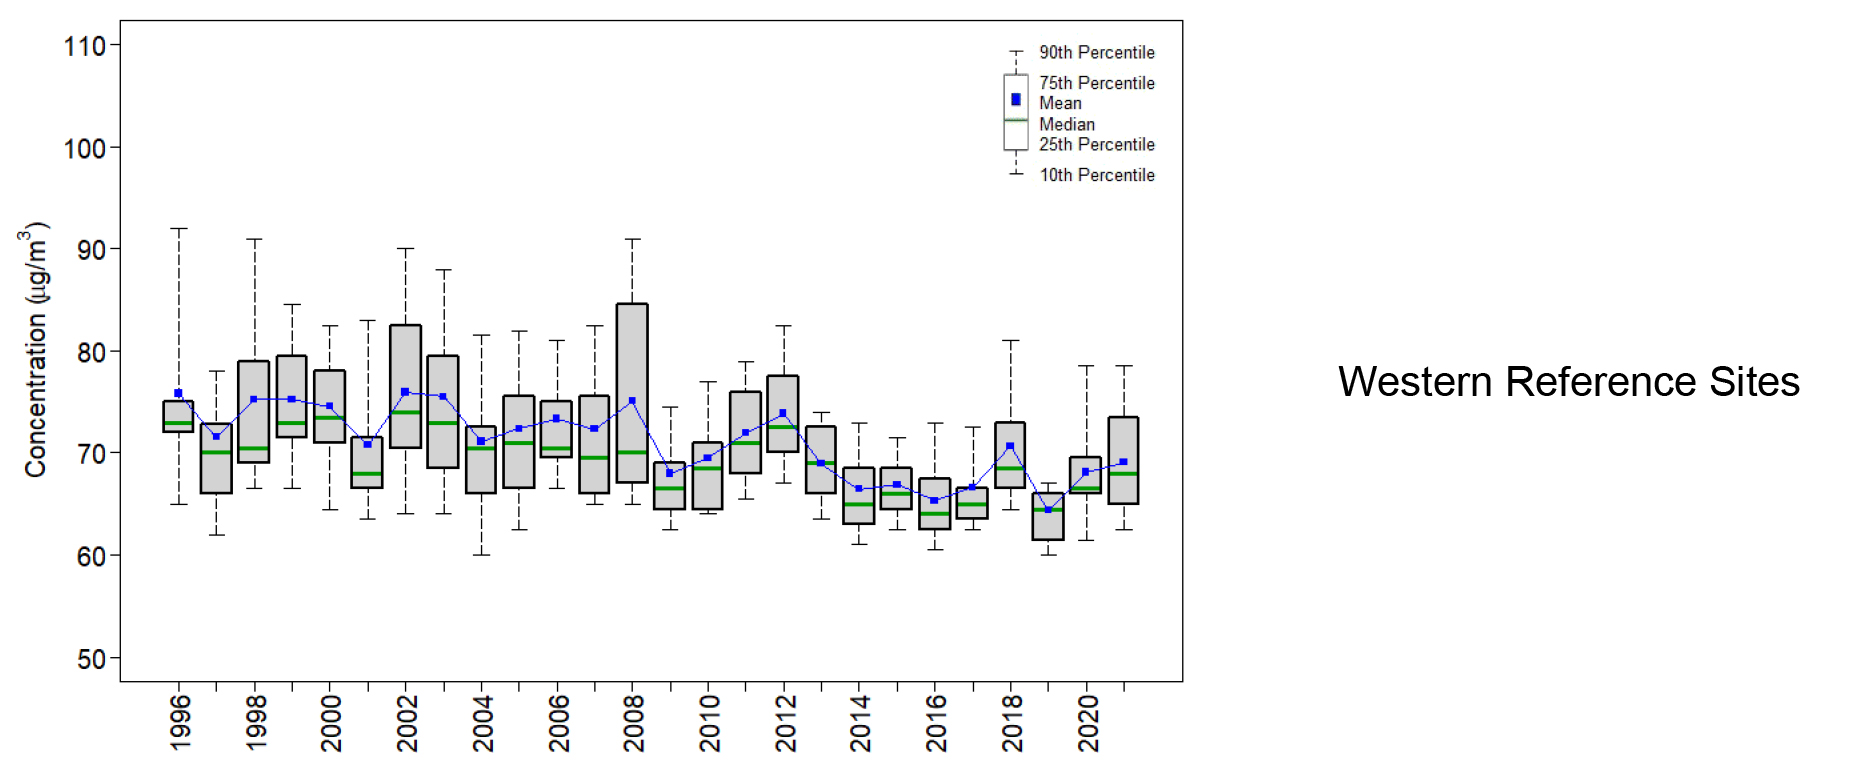
Figure 5 provides box plots depicting trends in 1-year mean, median, and annual distributions of fourth highest DM8A O3 concentrations from the 34 CASTNET eastern reference sites (Figure 5, 1 of 2) and the 16 western reference sites (Figure 5, 2 of 2)
Temperature Trends
Extensive scientific studies have demonstrated long-term increases in temperature across the United States and the world. Temperatures are rising, and rainfall and snow patterns are shifting. Extreme weather events such as heavy rainstorms and record high temperatures are becoming more common. Many of these observed weather and climate changes are linked to rising levels of greenhouse gases in the atmosphere. EPA provides information on temperature, precipitation, and other indicators that provide evidence of these long-term changes and their impacts on people and the environment. EPA partners with dozens of data contributors (e.g., National Oceanic and Atmospheric Administration [NOAA]) to compile and keep these indicators up to date.
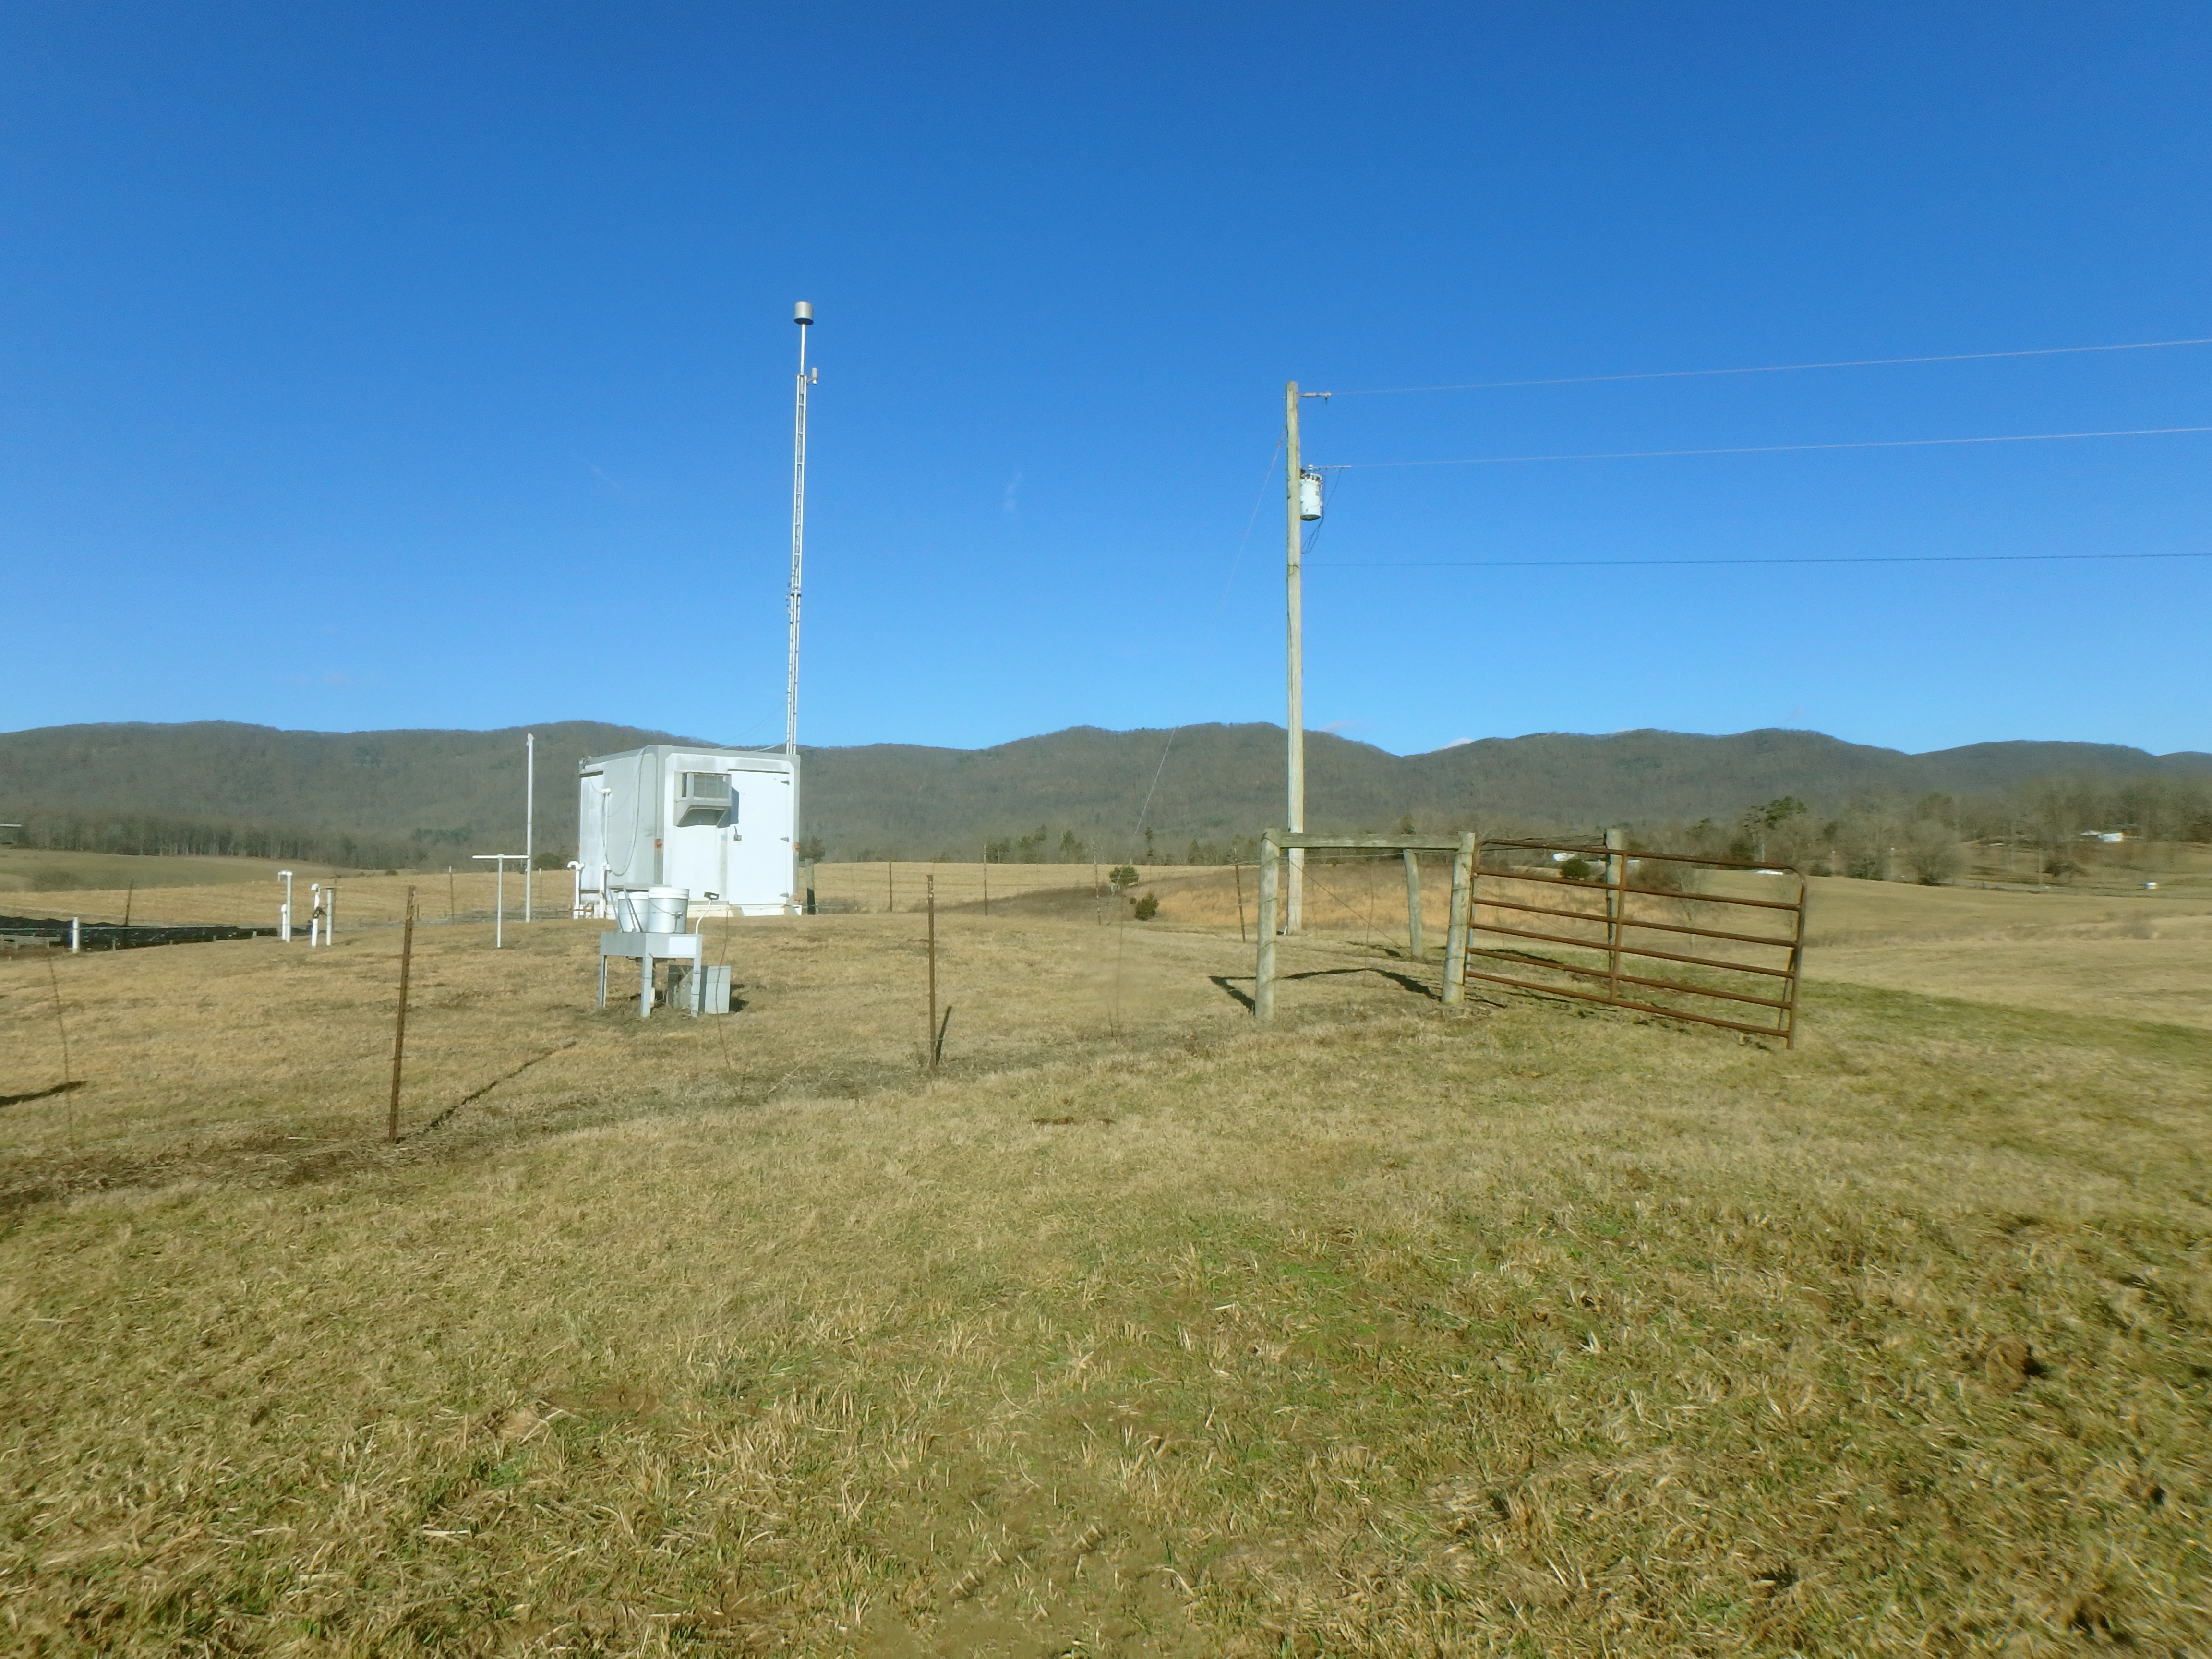
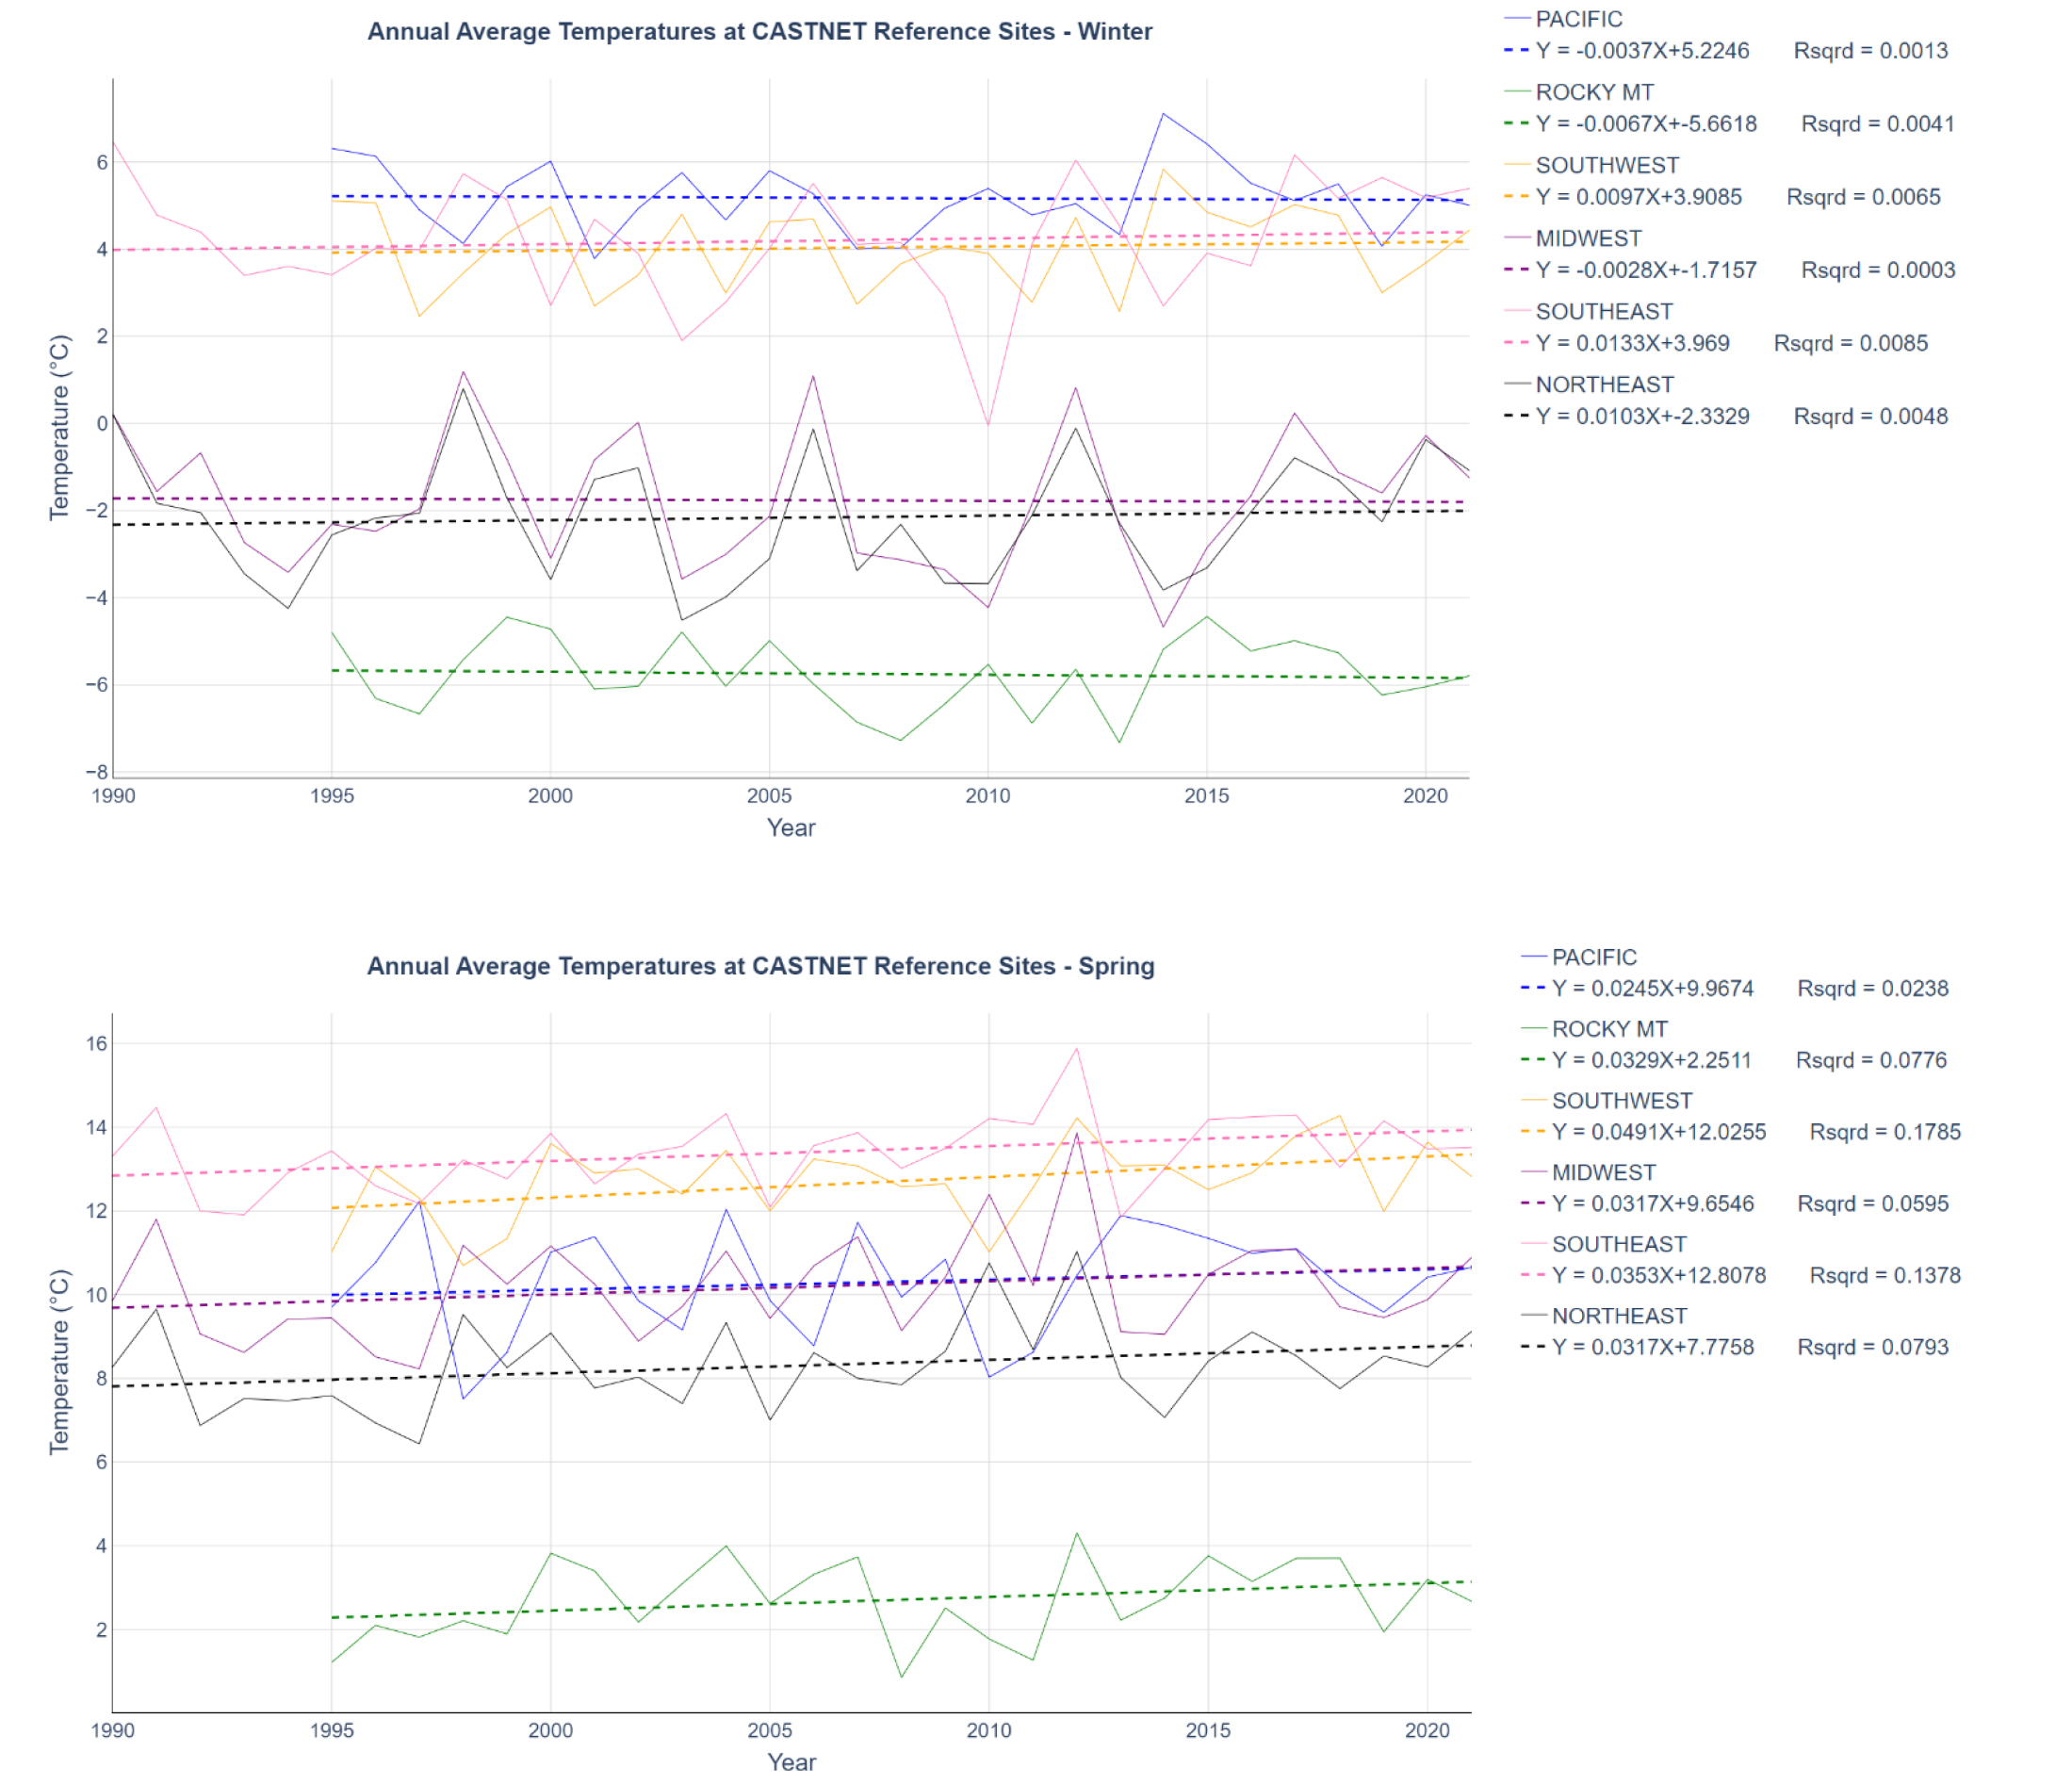
CASTNET sites were selected to characterize air quality in rural, regionally representative areas to avoid the undue influence of significant sources of air pollution from power plants and urban areas. The CASTNET eastern reference sites have been operating since 1990, and the CASTNET western reference sites have been operating since 1995. Therefore, CASTNET temperature measurements from 1990 through 2021 for the eastern reference sites and 1995 through 2021 for the western reference sites were selected to illustrate rural temperature changes. Seasons were defined as winter (December, January, February); spring (March, April, May); summer (June, July, August); and fall (September, October, November).
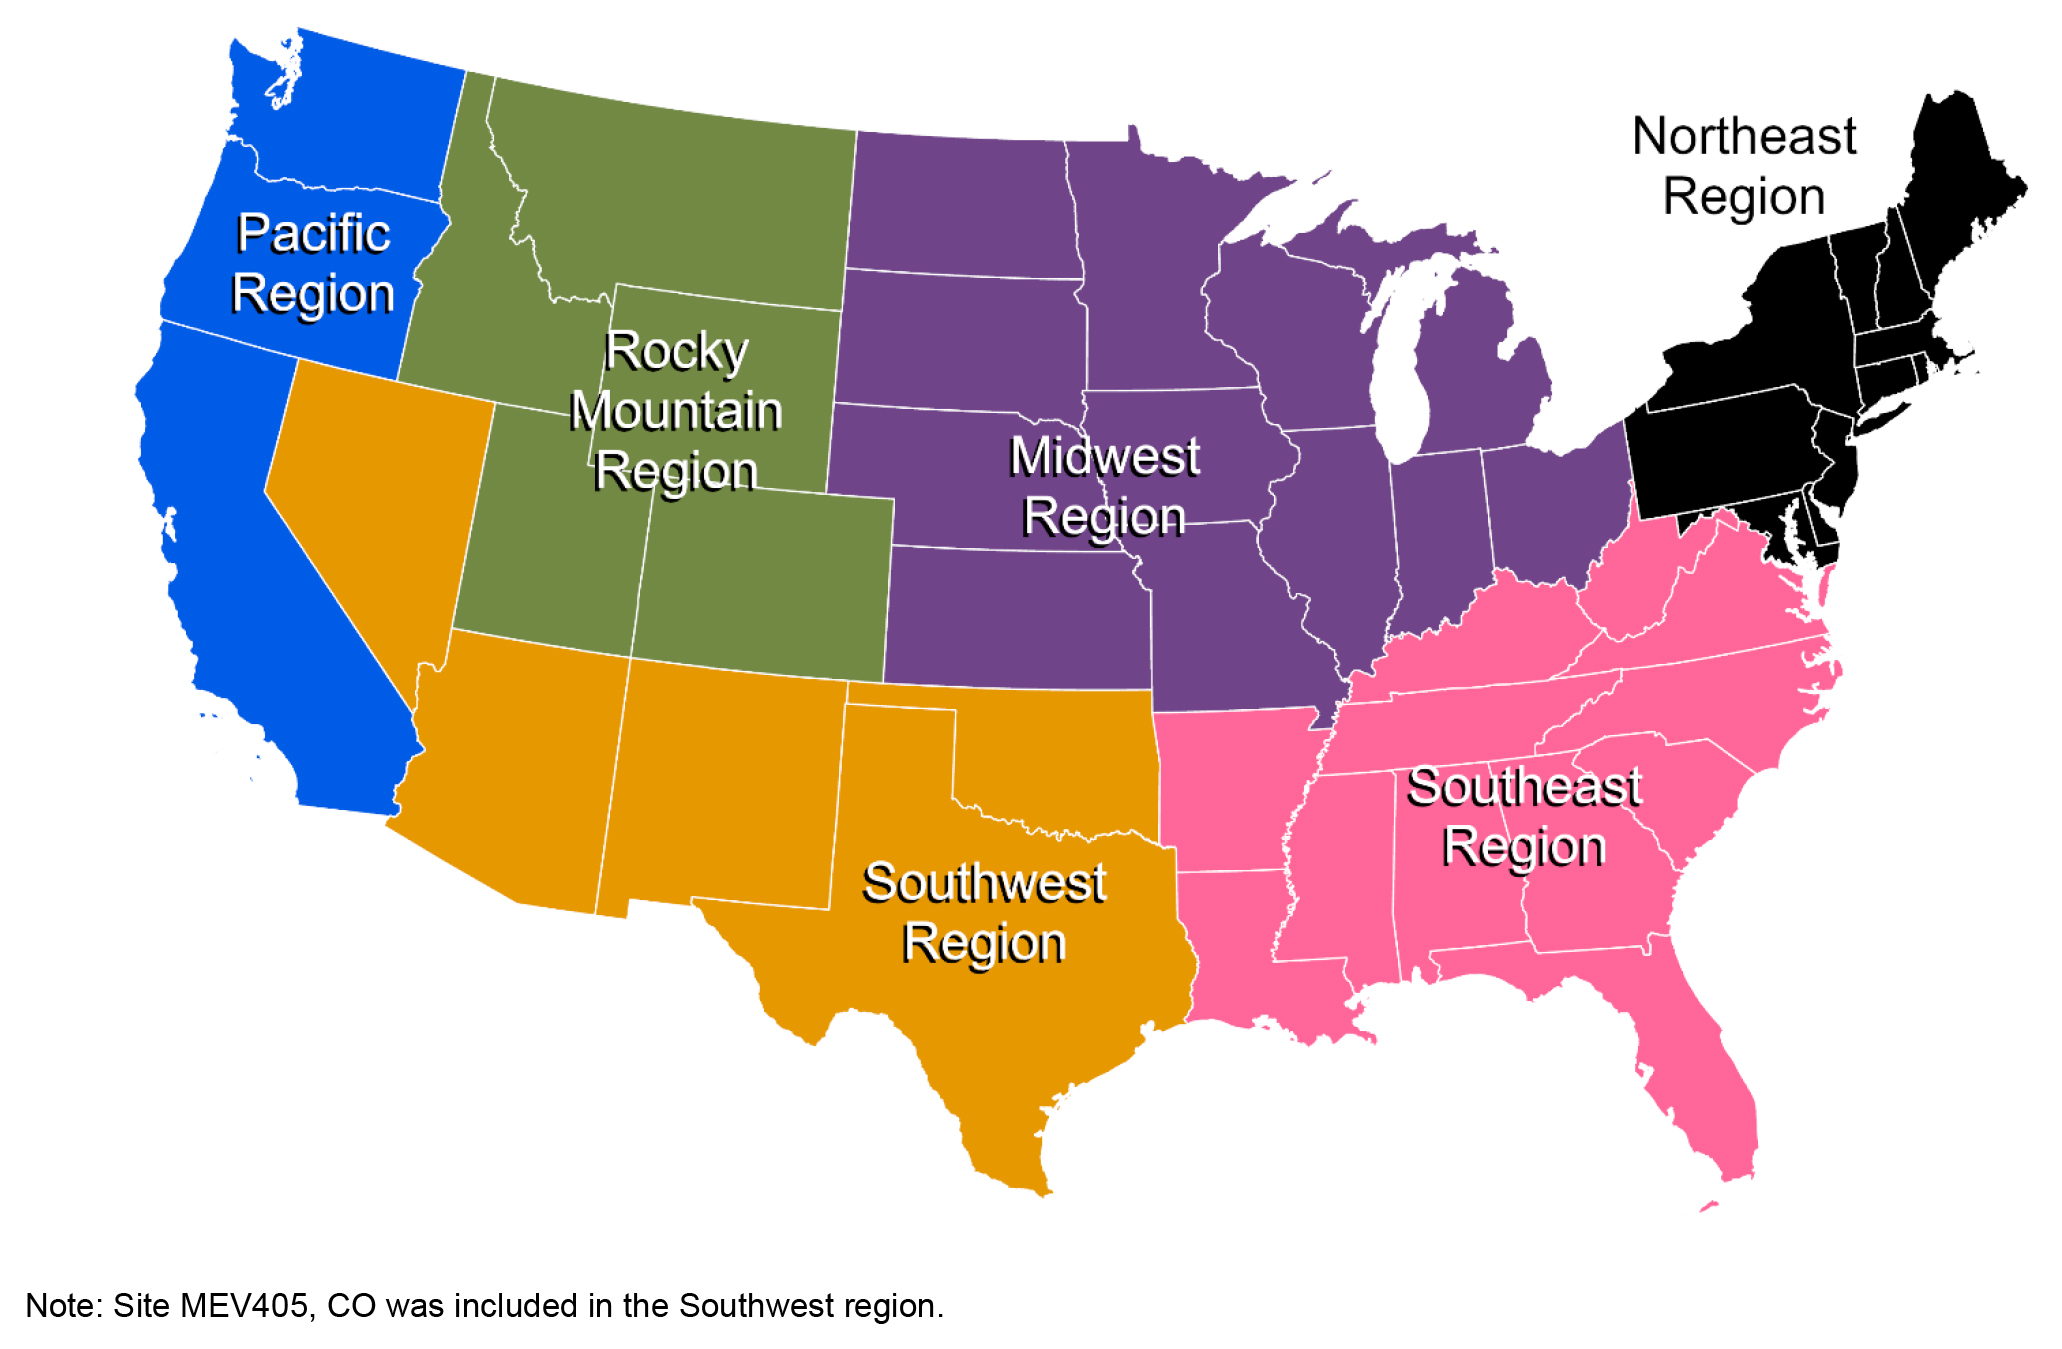
Temperature data were collected hourly at each site over the periods 1990 through 2021 (eastern sites) or 1995 through 2021 (western sites). The sites were divided into six geographic regions (Figure 6). The eastern sites were sorted into the Midwest, Southeast, and Northeast regions. The western sites were sorted into the Pacific, Rocky Mountain, and Southwest regions. Table 2 lists the sites by region with the data collection period for each site. Each site produced more than 200,000 hourly temperature values
To ensure these data sets were as complete and rigorous as possible, the data were analyzed for missing data and outliers. Missing data might affect calculation of trends and other analyses and, if extensive, might influence conclusions. Data were estimated for gaps in months that had less than 70 percent of the expected number of valid hourly temperature values for a given month with leap years taken into consideration. Linear interpolation was used on data gaps by the hour for a given month, day, and site location. The analysis was then done on the annual averages once the hourly data gaps were replaced. Outliers were caused by occasional system and instrument calibrations and power failures. They were detected and removed. The resulting temperature databases were considered sufficient for trends analyses.
| Site ID | Range of Years |
Percent Missing Data |
|---|---|---|
| Pacific | ||
| JOT403, CA | 1995–2021 | 0.91 |
| LAV410, CA | 1995–2021 | 2.41 |
| PIN414, CA | 1995–2021 | 1.22 |
| YOS404, CA | 1995–2021 | 5.73 |
| Rocky Mountain | ||
| CAN407, UT | 1995–2021 | 2.29 |
| CNT169, WY | 1995–2021 | 3.89 |
| GLR468, MT | 1995–2021 | 3.92 |
| GTH161, CO | 1995–2021 | 1.94 |
| PND165, WY | 1995–2021 | 3.89 |
| ROM406, CO | 1995–2021 | 1.77 |
| YEL408, WY | 1995–2021 | 6.67 |
| Southwest | ||
| BBE401, TX | 1995–2021 | 3.35 |
| CHA467, AZ | 1995–2021 | 1.21 |
| GRC474, AZ | 1995–2021 | 4.00 |
| GRB411, NV | 1995–2021 | 7.76 |
| MEV405, CO | 1995–2021 | 1.68 |
| Midwest | ||
| ALH157, IL | 1990–2021 | 7.47 |
| ANA115, MI | 1990–2021 | 3.28 |
| BVL130, IL | 1990–2021 | 8.07 |
| DCP114, OH | 1990–2021 | 6.03 |
| OXF122, OH | 1990–2021 | 1.41 |
| PRK134, WI | 1990–2021 | 1.97 |
| SAL133, IN | 1990–2021 | 2.84 |
| UVL124, MI | 1990–2021 | 2.88 |
| VIN140, IN | 1990–2021 | 1.76 |
| Site ID | Range of Years |
Percent Missing Data |
|---|---|---|
| Southeast | ||
| CAD150, AR | 1990–2021 | 4.09 |
| CDR119, WV | 1990–2021 | 3.37 |
| CND125, NC | 1990–2021 | 6.43 |
| COW137, NC | 1990–2021 | 0.85 |
| ESP127, TN | 1990–2021 | 4.51 |
| GAS153, GA | 1990–2021 | 3.58 |
| MCK131, KY | 1990–2021 | 6.29 |
| PAR107, WV | 1990–2021 | 0.66 |
| PED108, VA | 1990–2021 | 3.00 |
| PNF126, NC | 1990–2021 | 6.59 |
| SHN418, VA | 1990–2021 | 2.36 |
| SND152, AL | 1990–2021 | 3.12 |
| SPD111, TN | 1990–2021 | 5.10 |
| SUM156, FL | 1990–2021 | 2.66 |
| VPI120, VA | 1990–2021 | 3.32 |
| Northeast | ||
| ARE128, PA | 1990–2021 | 0.79 |
| ASH135, ME | 1990–2021 | 2.34 |
| BEL116, MD | 1990–2021 | 4.45 |
| CTH110, NY | 1990–2021 | 2.43 |
| KEF112, PA | 1990–2021 | 3.16 |
| LRL117, PA | 1990–2021 | 3.22 |
| MKG113, PA | 1990–2021 | 3.30 |
| PSU106, PA | 1990–2021 | 0.23 |
| WSP144, NJ | 1990–2021 | 3.81 |
| WST109, NH | 1990–2021 | 2.58 |
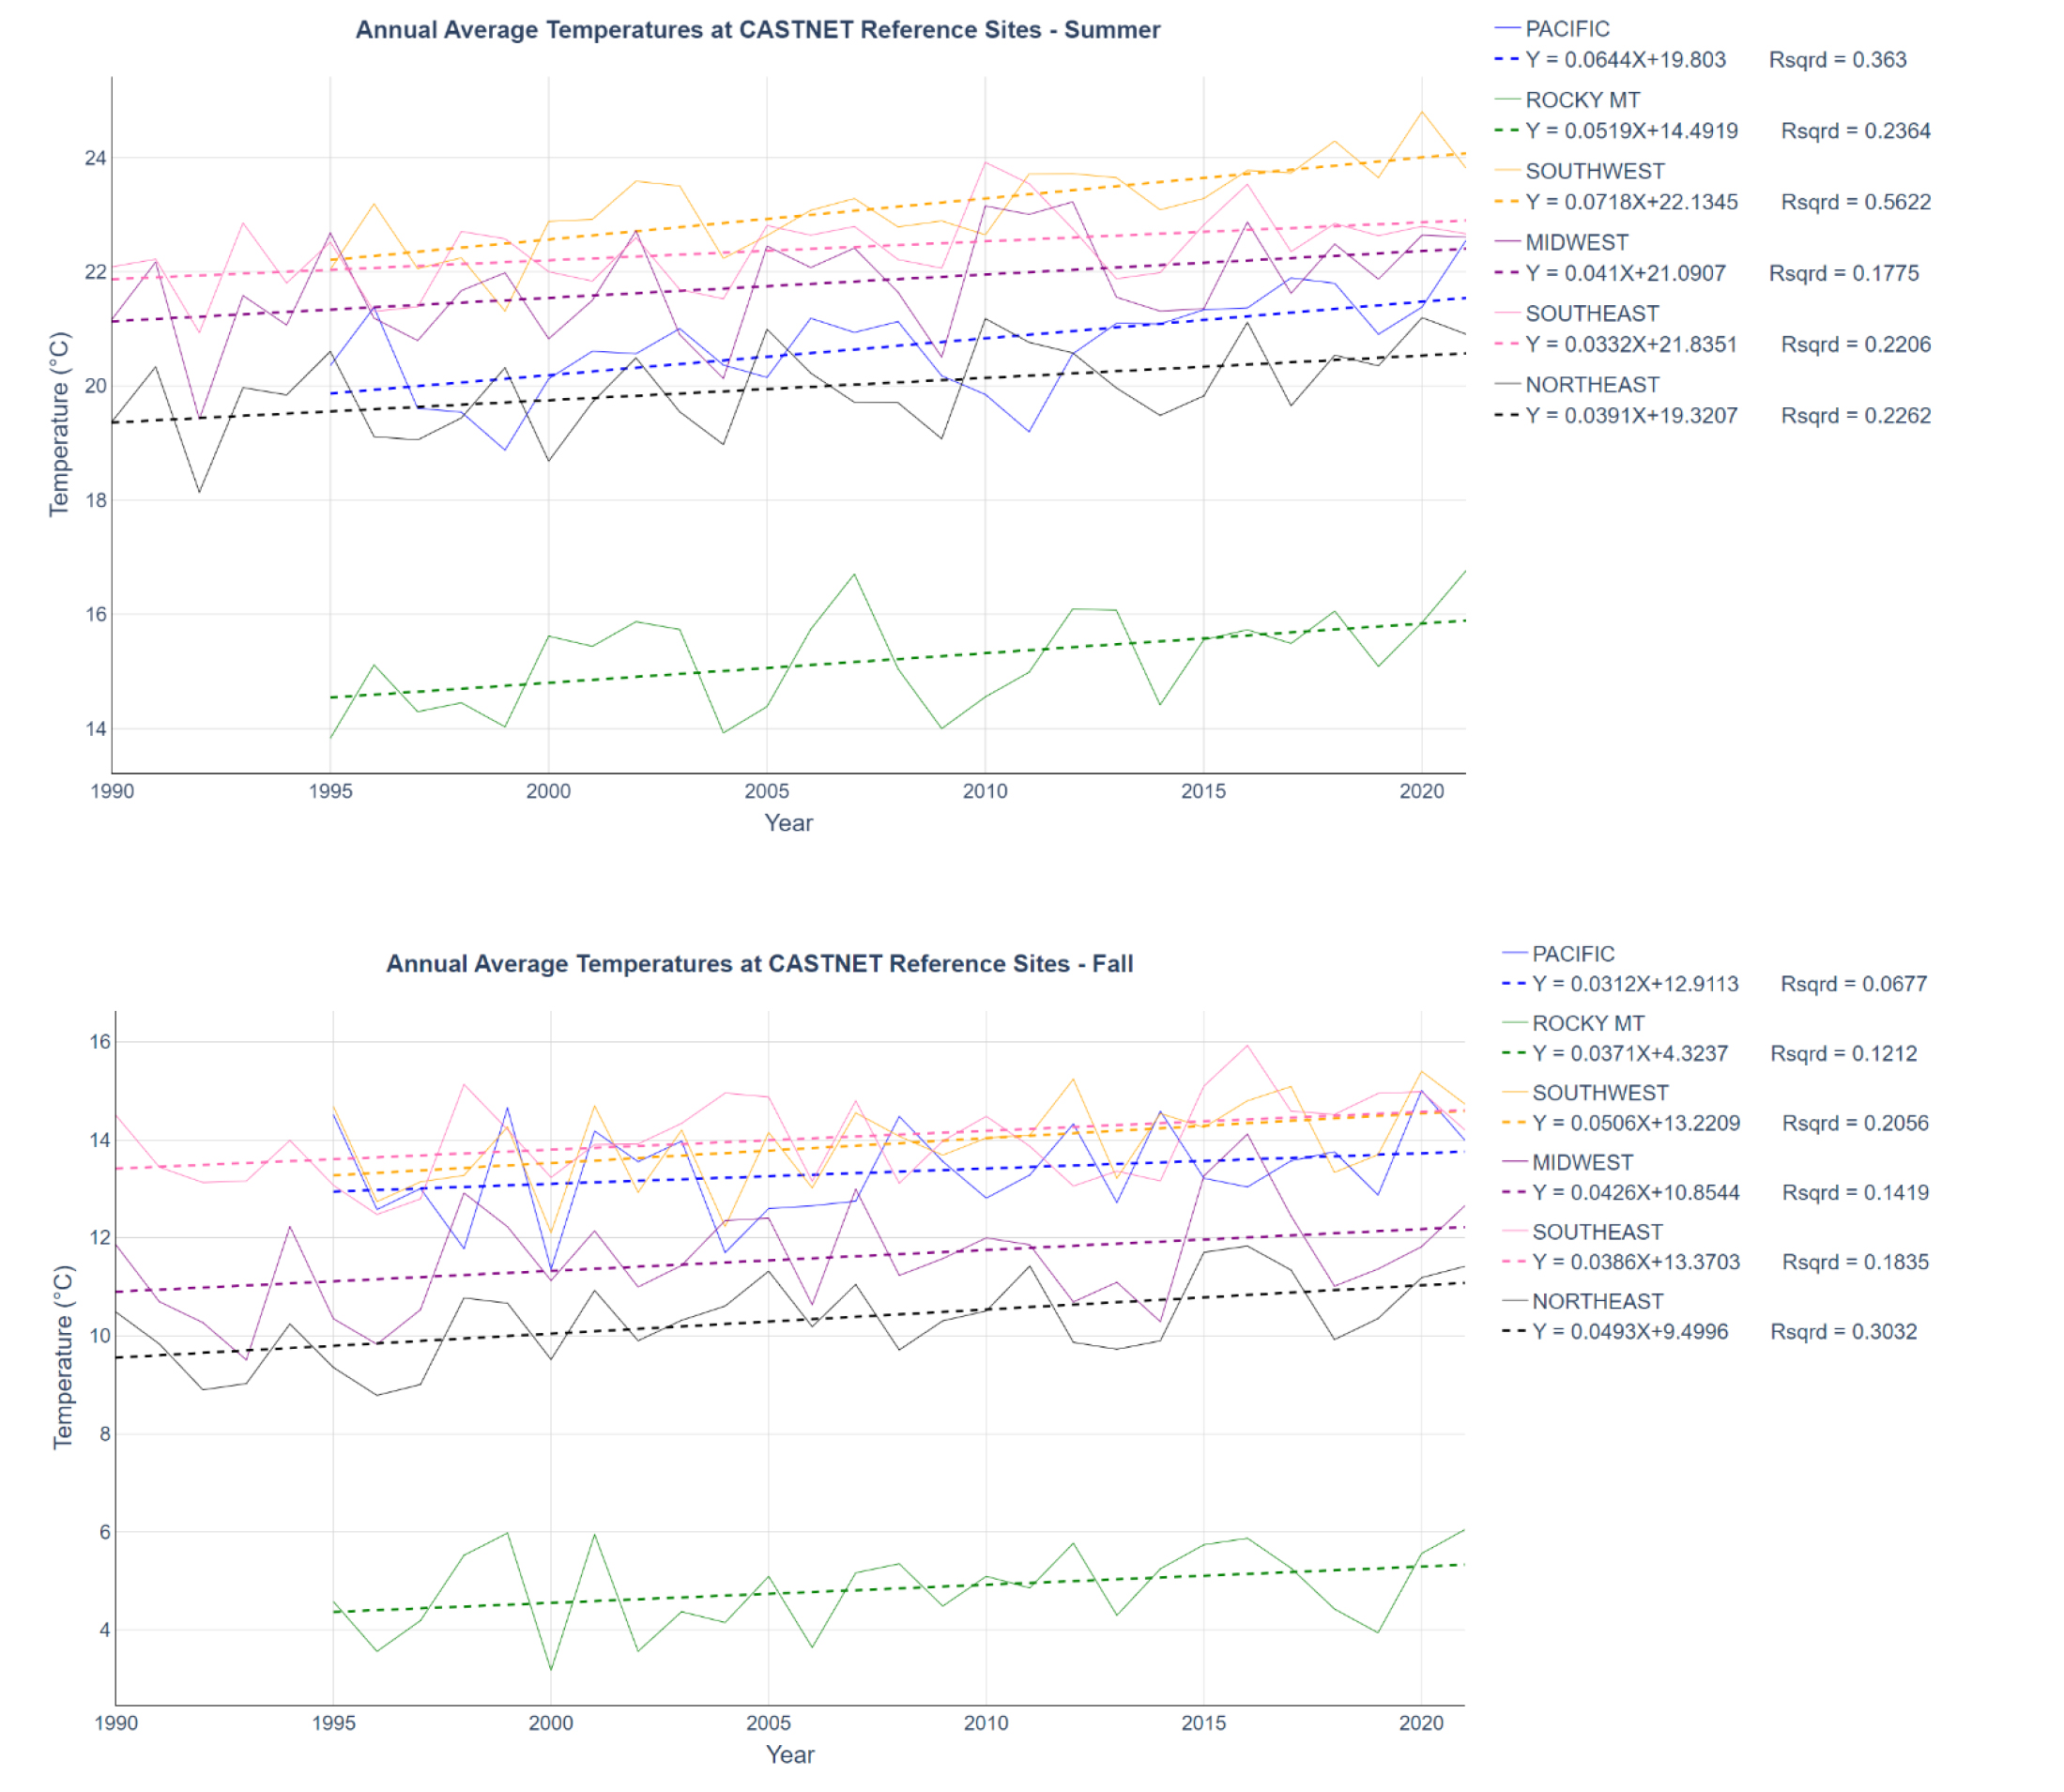
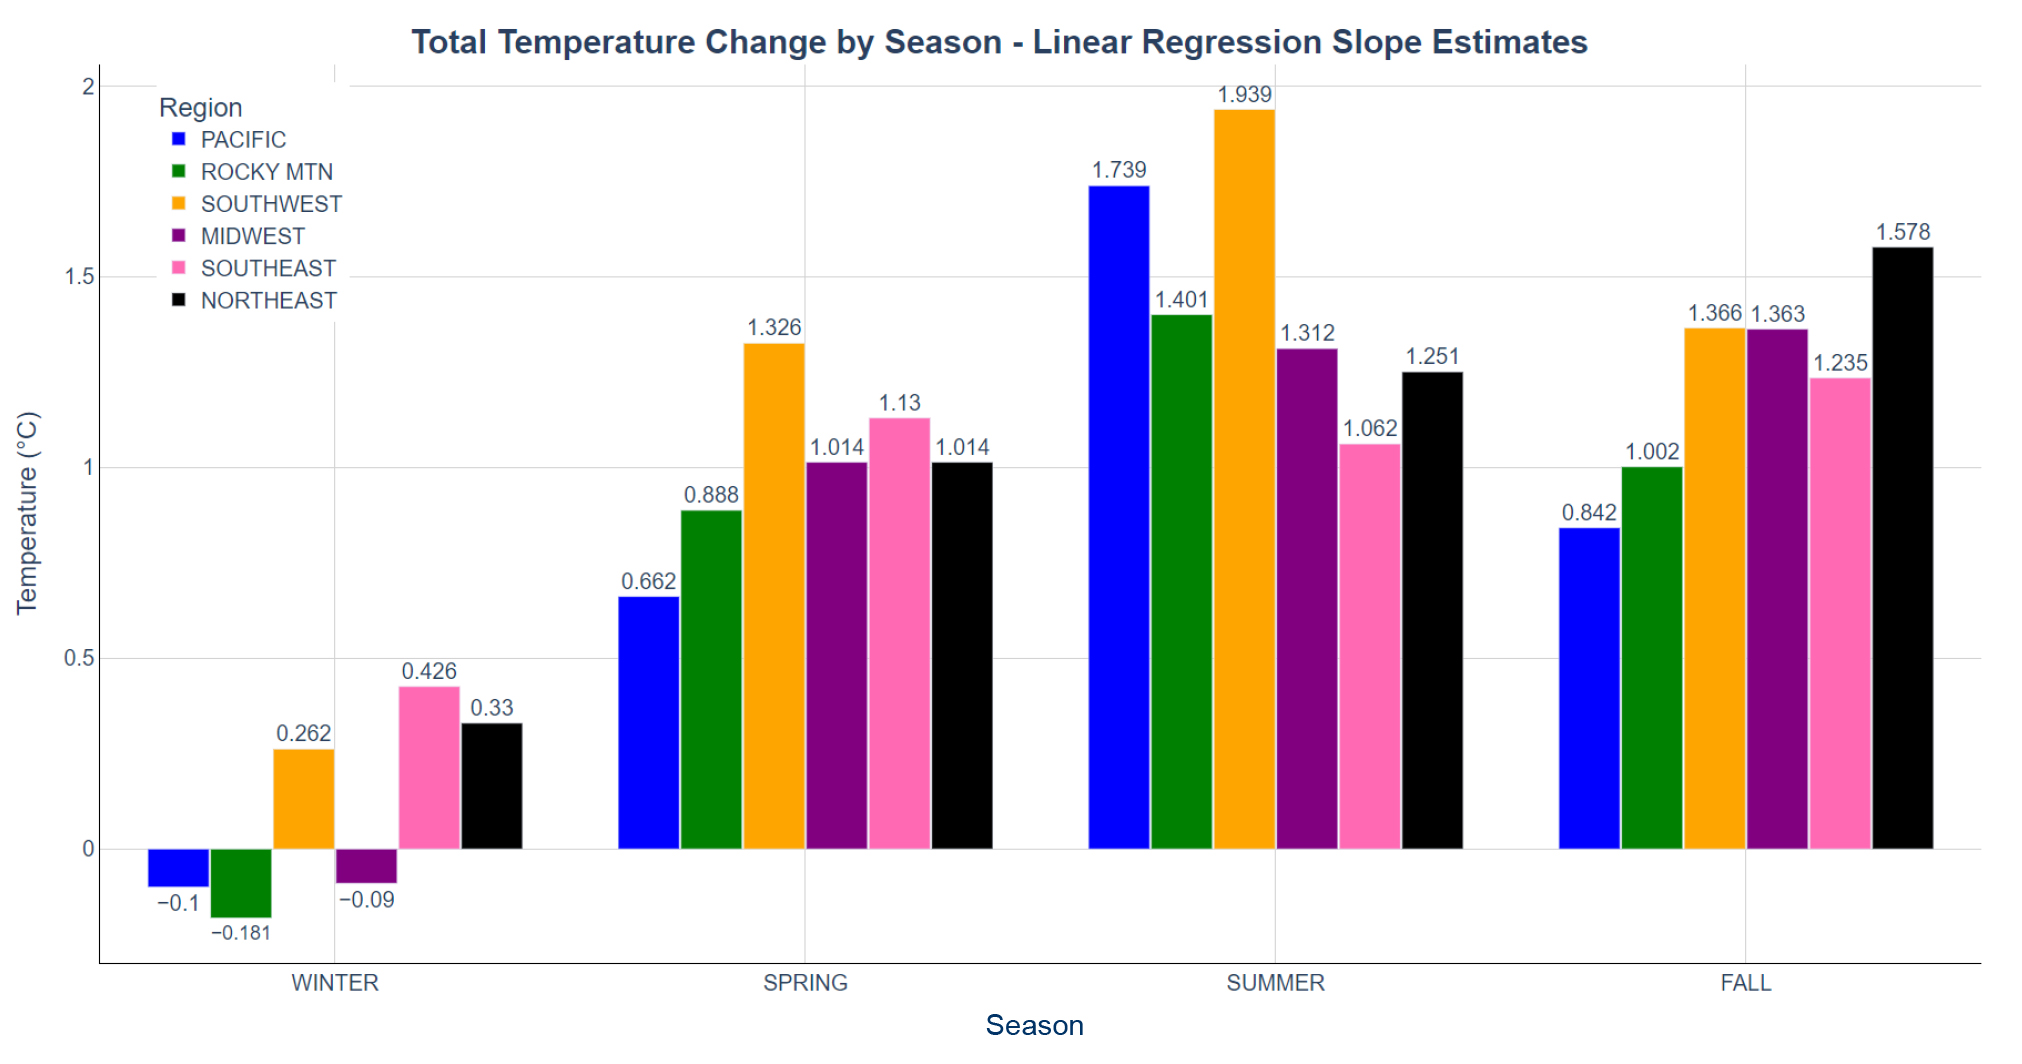
Linear regression was used to analyze regional temperature trends by season. The linear regression results for the four seasons (winter, spring, summer, and fall) are presented in Figure 7. Winter regression analyses show decreasing trends for three regions (Pacific, Rocky Mountain, and Midwest). The figure shows increasing temperatures for all regions for spring, summer, and fall.
Figure 8 illustrates total temperature change by season. Temperature change was calculated as the estimated slope times the range of years. The range of years for Pacific, Rocky Mountain, and Southwest was 27. For Midwest, Southeast, and Northeast, it was 32.
The annual average was calculated by grouping the temperature values of all the sites in each specified region. The assumption made was that all the sites are evenly distributed spatially. Future work will have to be done to calculate a more accurate annual average based on sites that are not evenly spaced. In addition, it is recommended that seasonal trend analysis is done on a data set that covers more than 30 years. This is especially true when looking at small geographical areas in a short time frame. Analyzing temperature trends over shorter time periods is difficult and is not consistent when compared with well-known, longer-term temperature trends. This report provides an overview of the temperature trends solely for data CASTNET has currently collected. CASTNET reports will continue to provide data and updated analyses in the future.
Nitrogen Atmospheric Concentrations
Annual mean concentrations of total NO3- (HNO3 + NO3-), NH4+ , and NH3 for 2021 are presented in three maps. Trends in annual mean concentrations of total NO3- and NH4+ over the 32-year period, 1990 through 2021, were calculated from the eastern reference sites and for the 26-year period, 1996 through 2021, from the western reference sites. Trends in NH3 were estimated from AMoN data from 2008 through 2021.
Trace-level gas analyzers measured NOy at five EPA-sponsored and two NPS-sponsored CASTNET sites during 2021. These are presented at the end of this section. Measurements were not made at DUK008, NC during January through November 2021 due to the collapse of the Duke Forest hardwood tower in December 2020. Filter pack sampling restarted at DUK008 in December 2021.
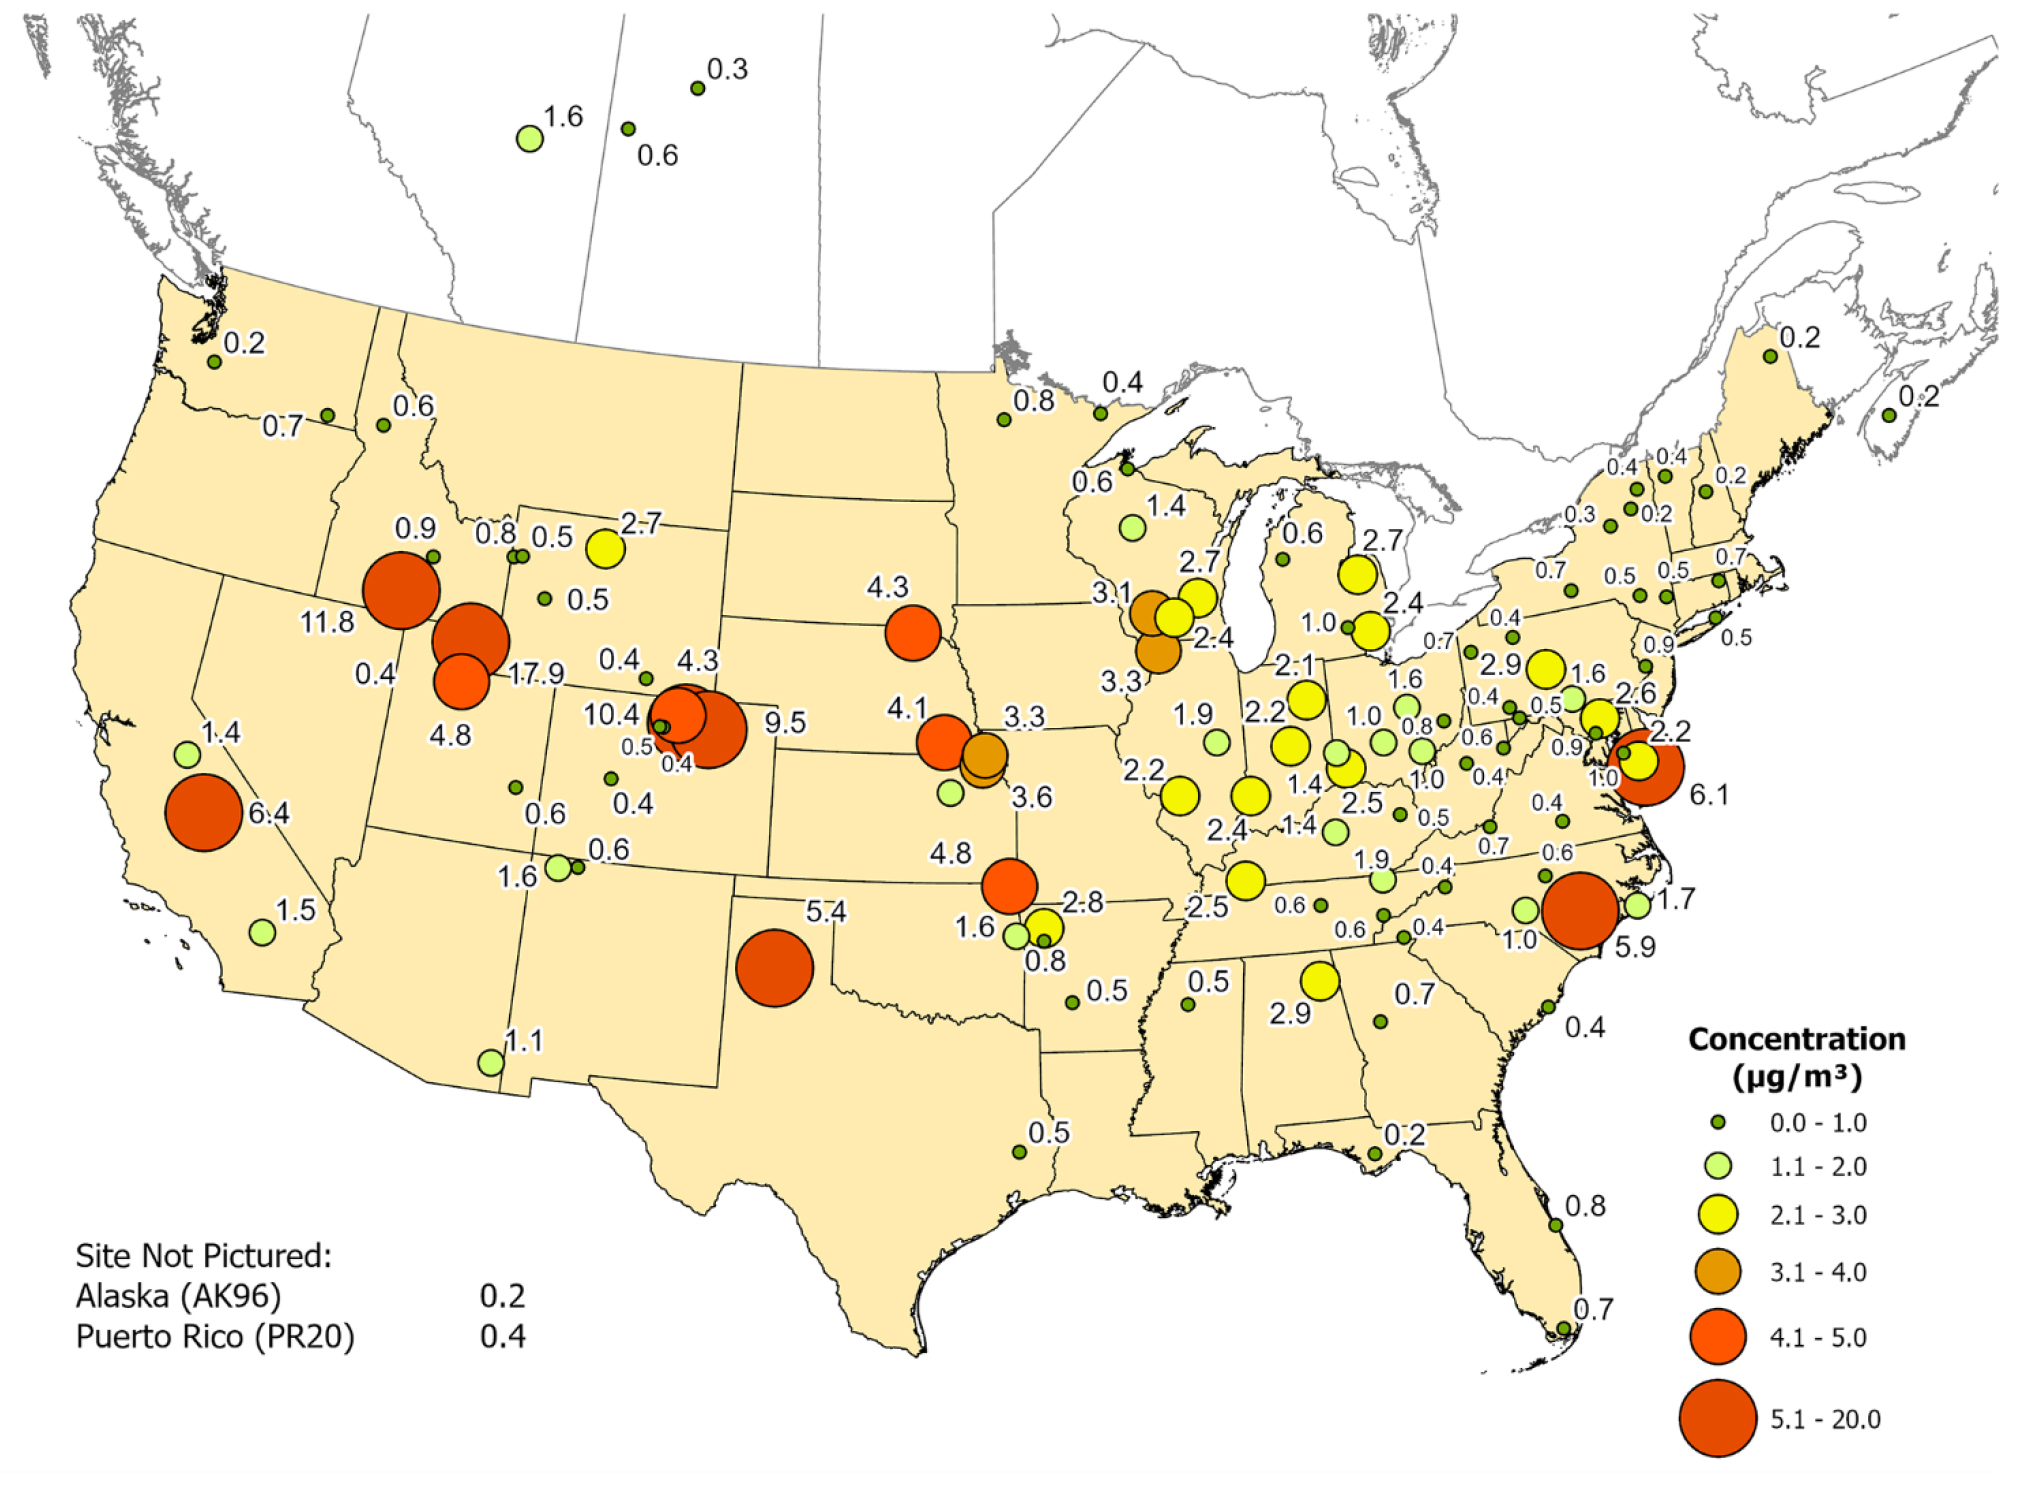
Total Nitrate Concentrations
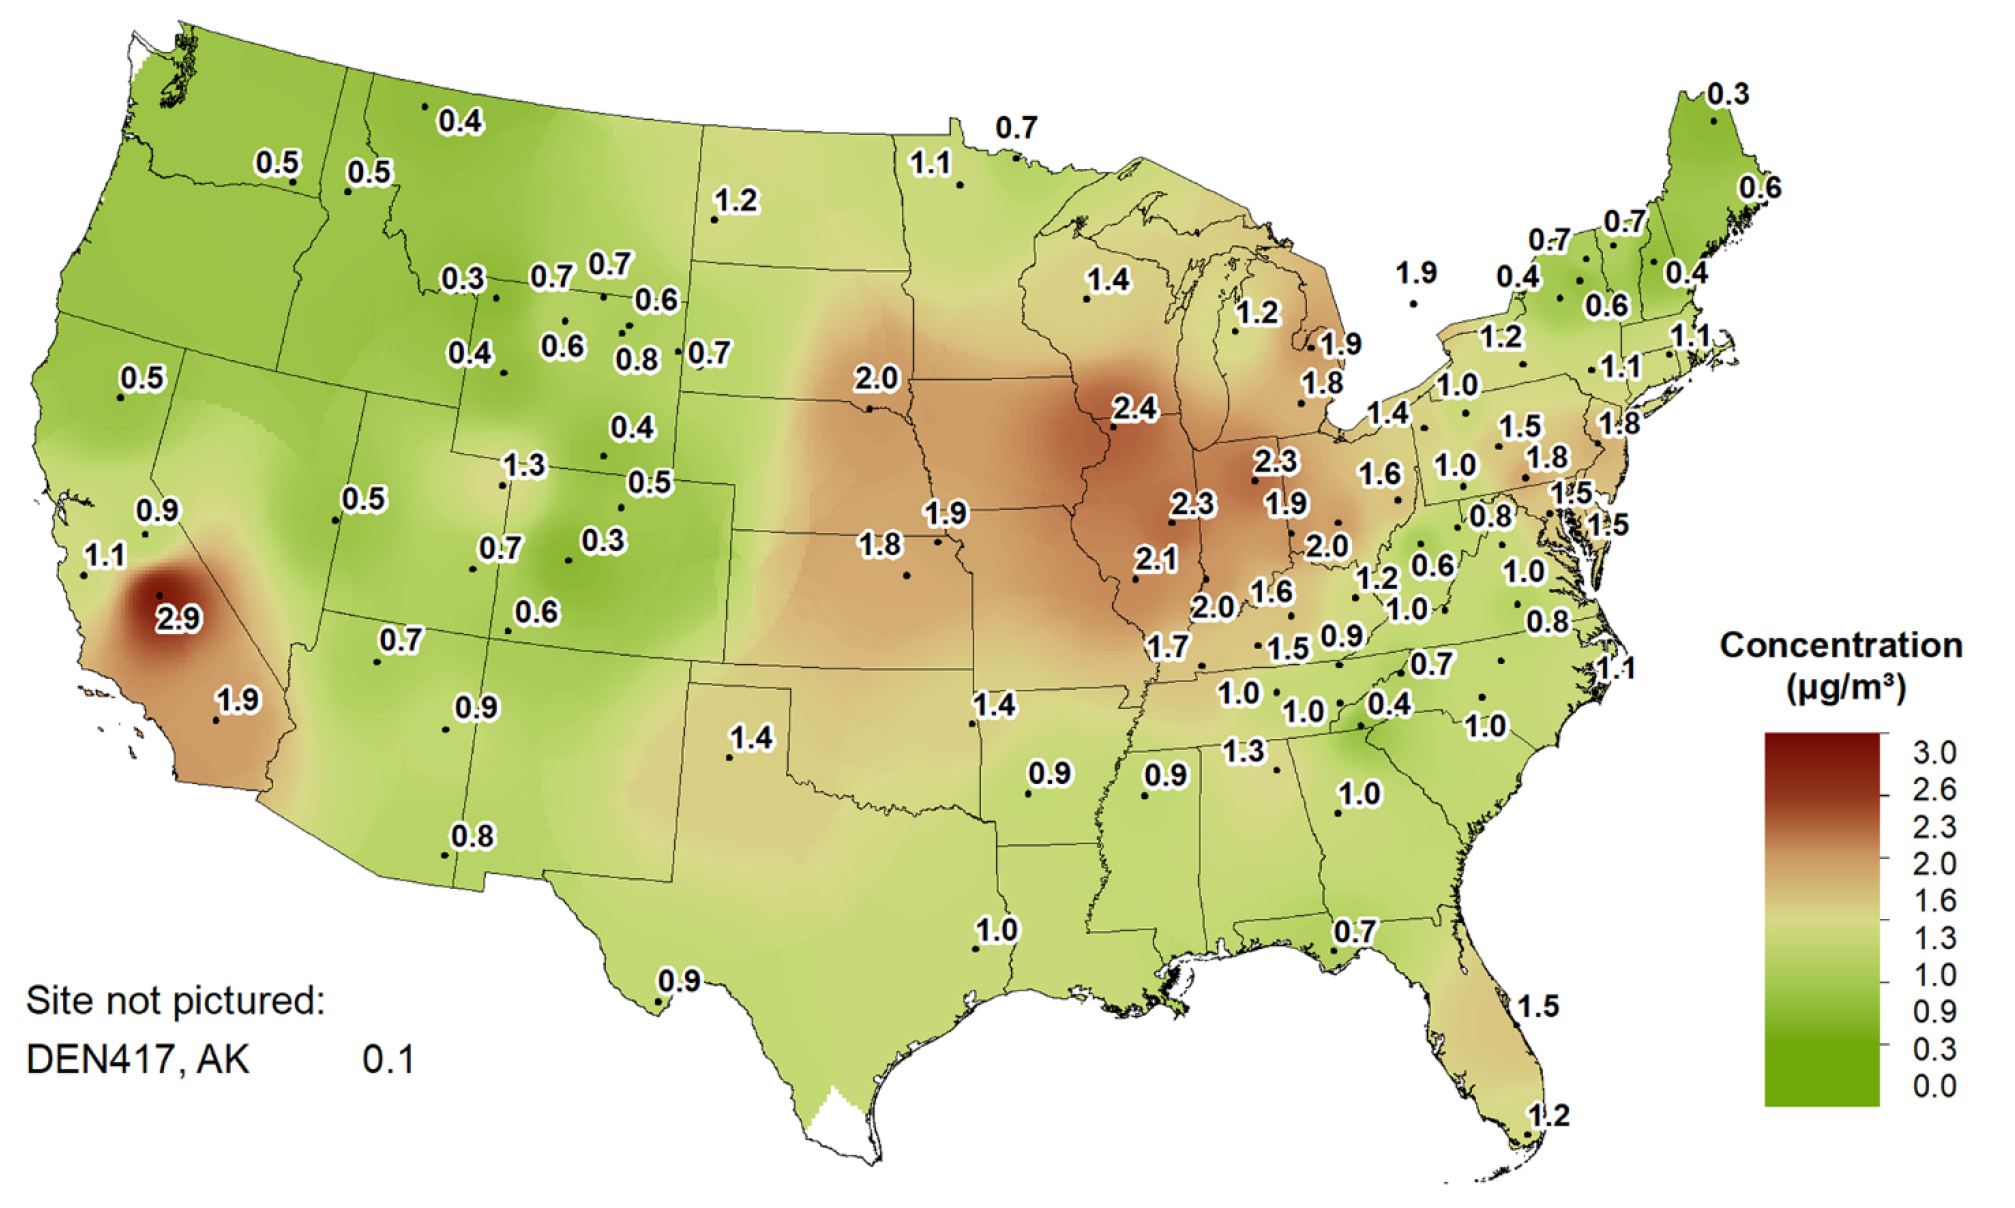
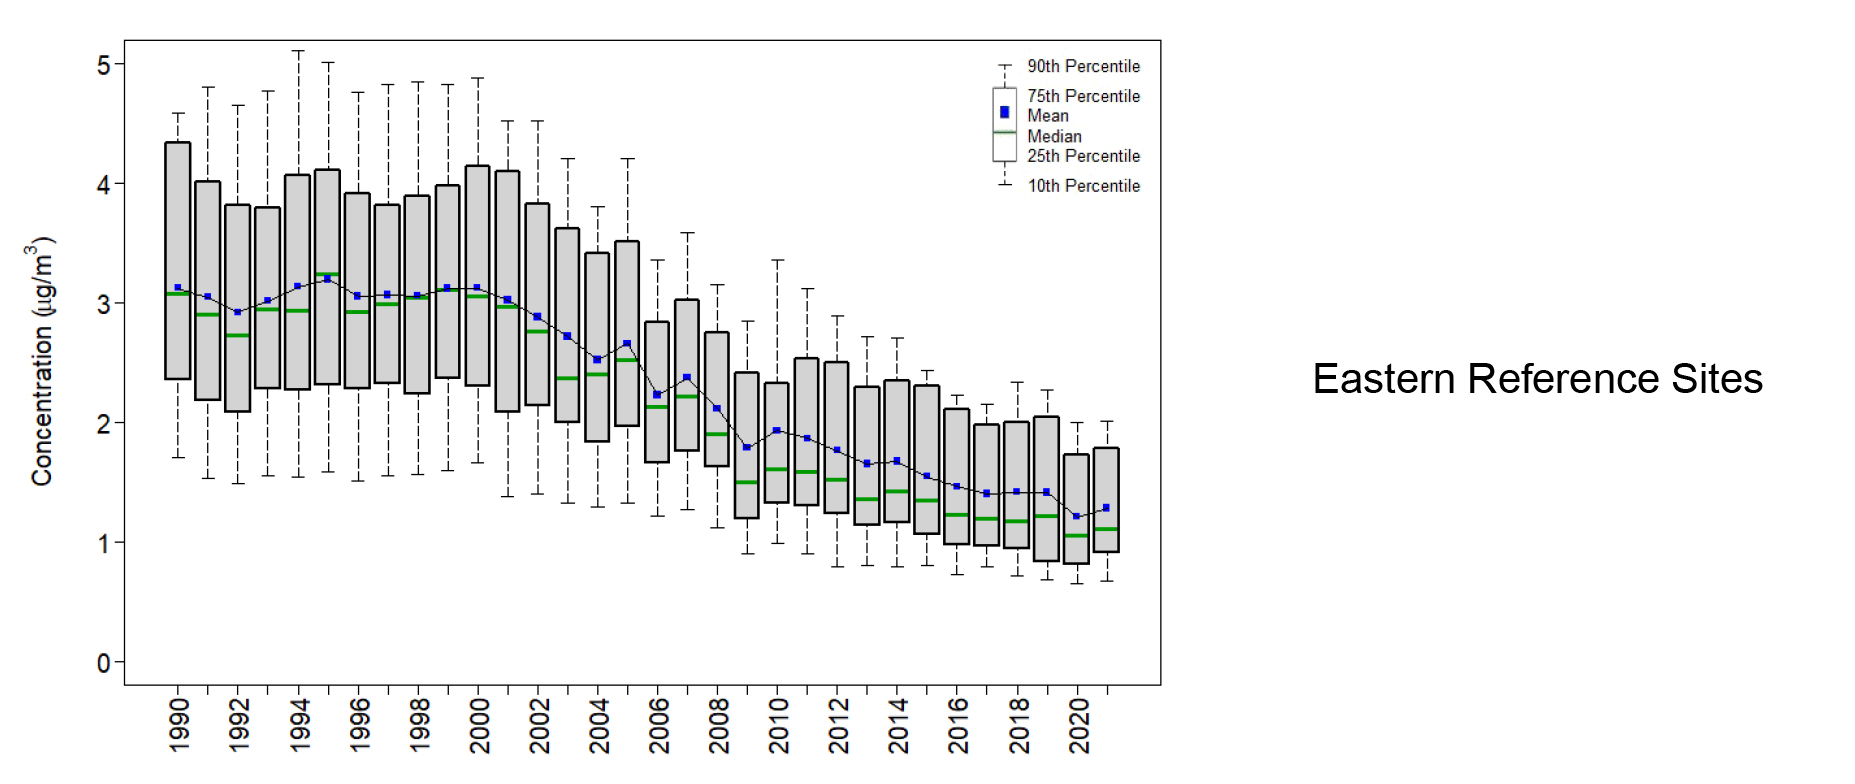
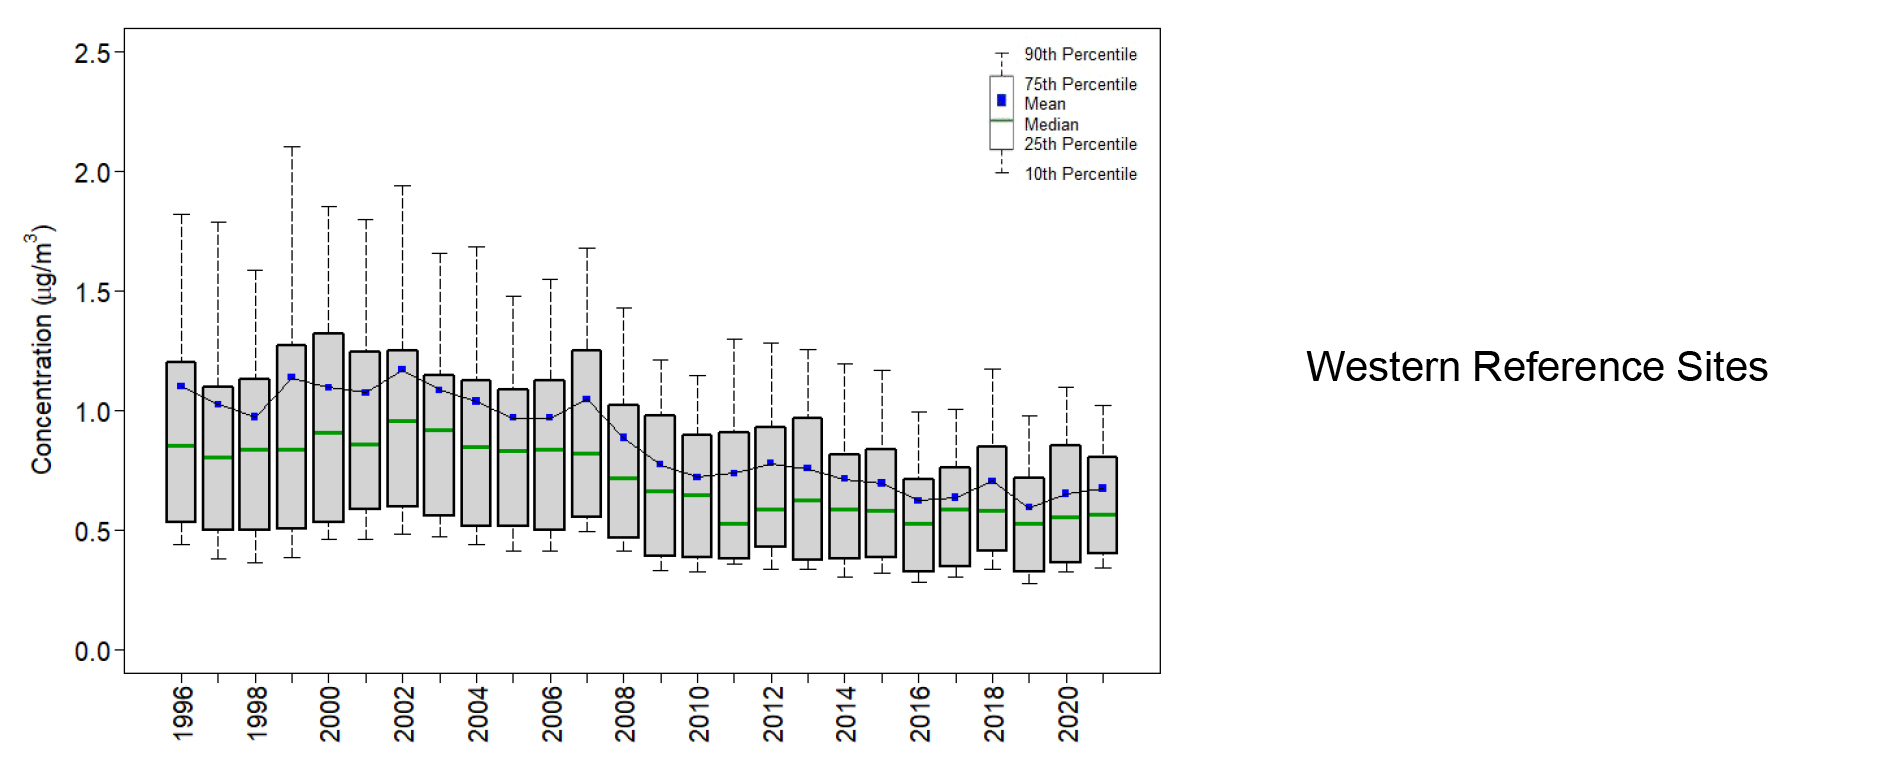
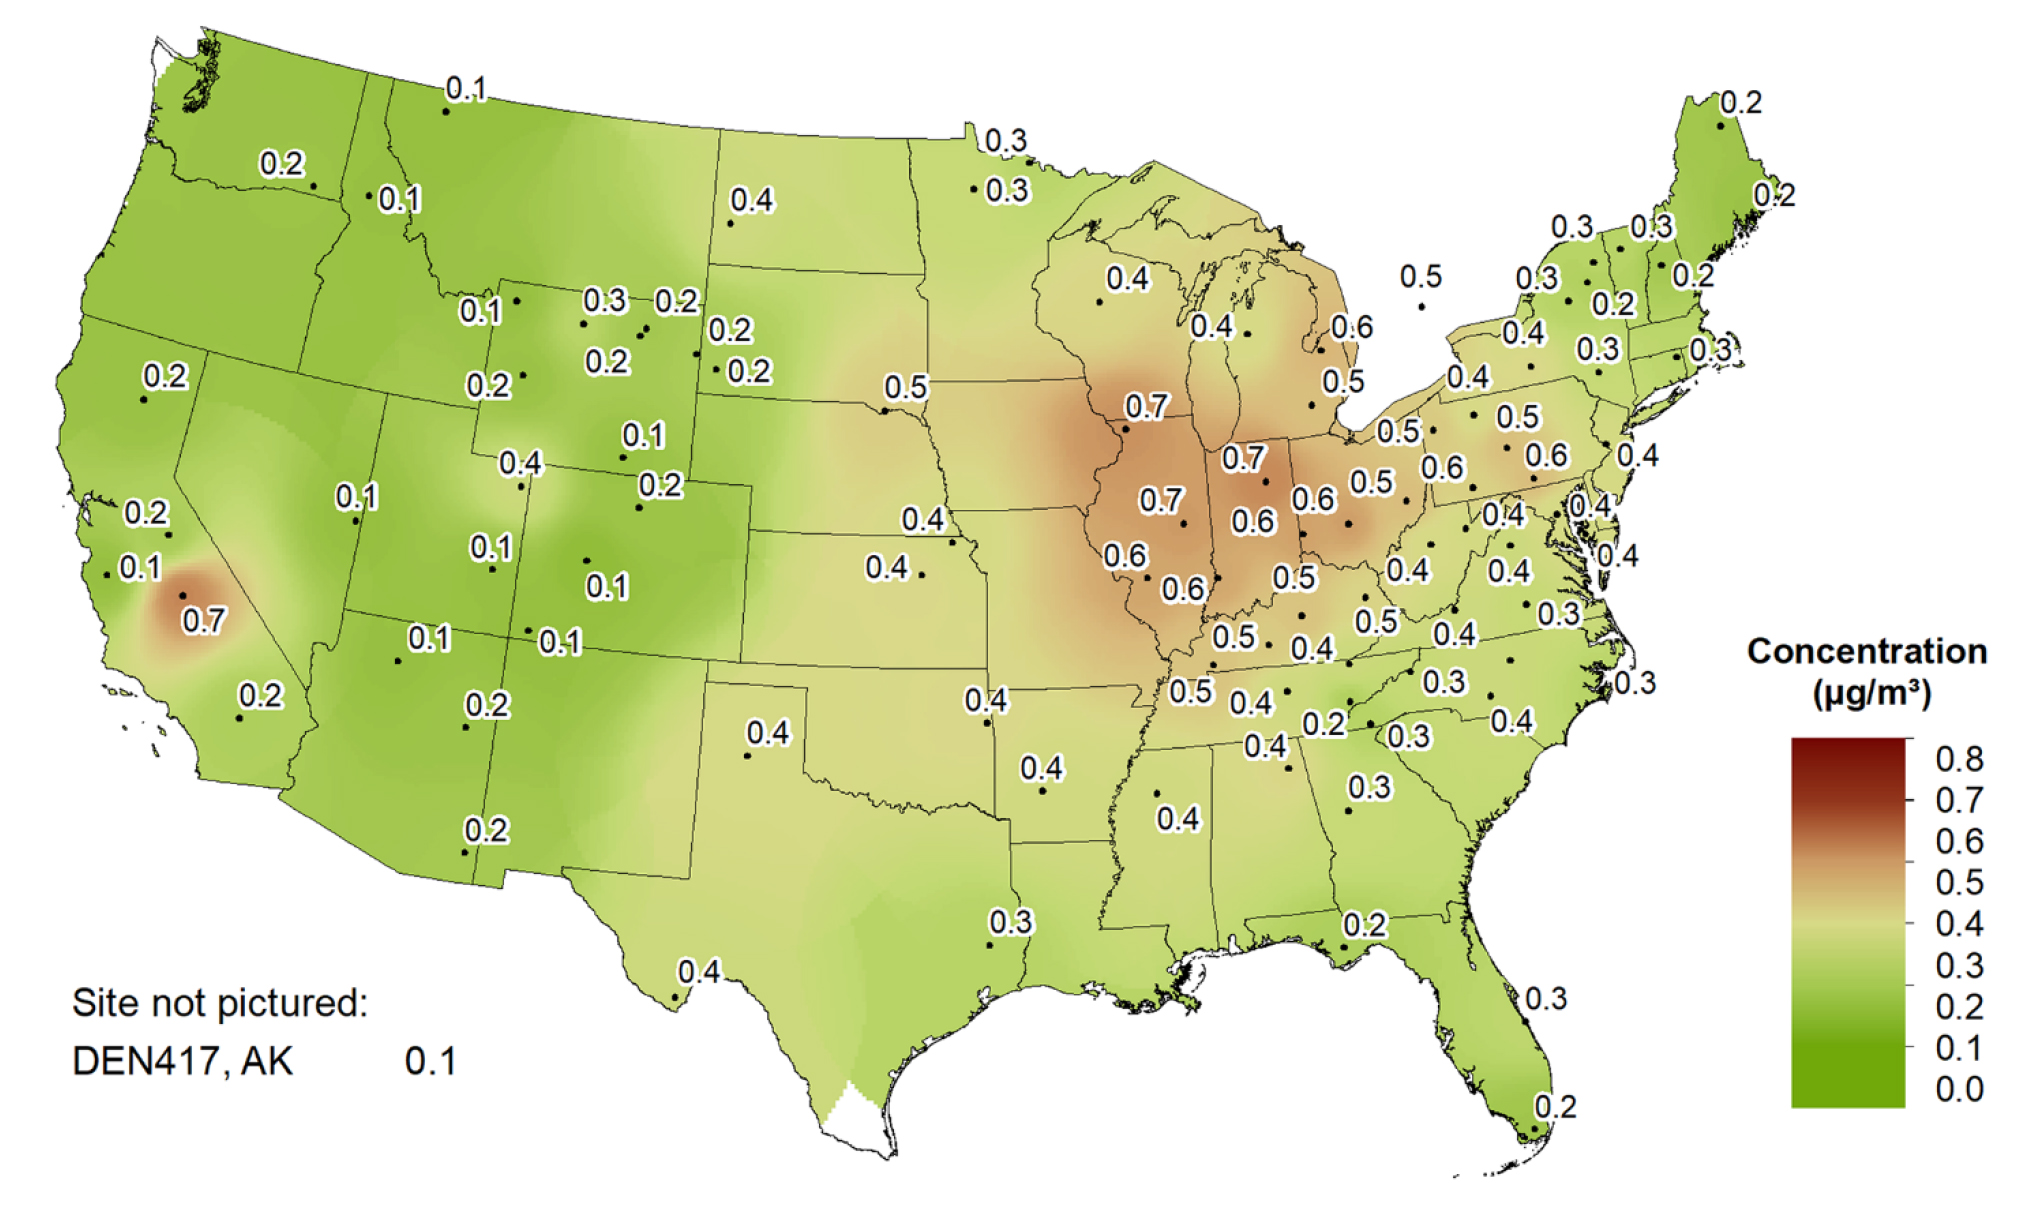
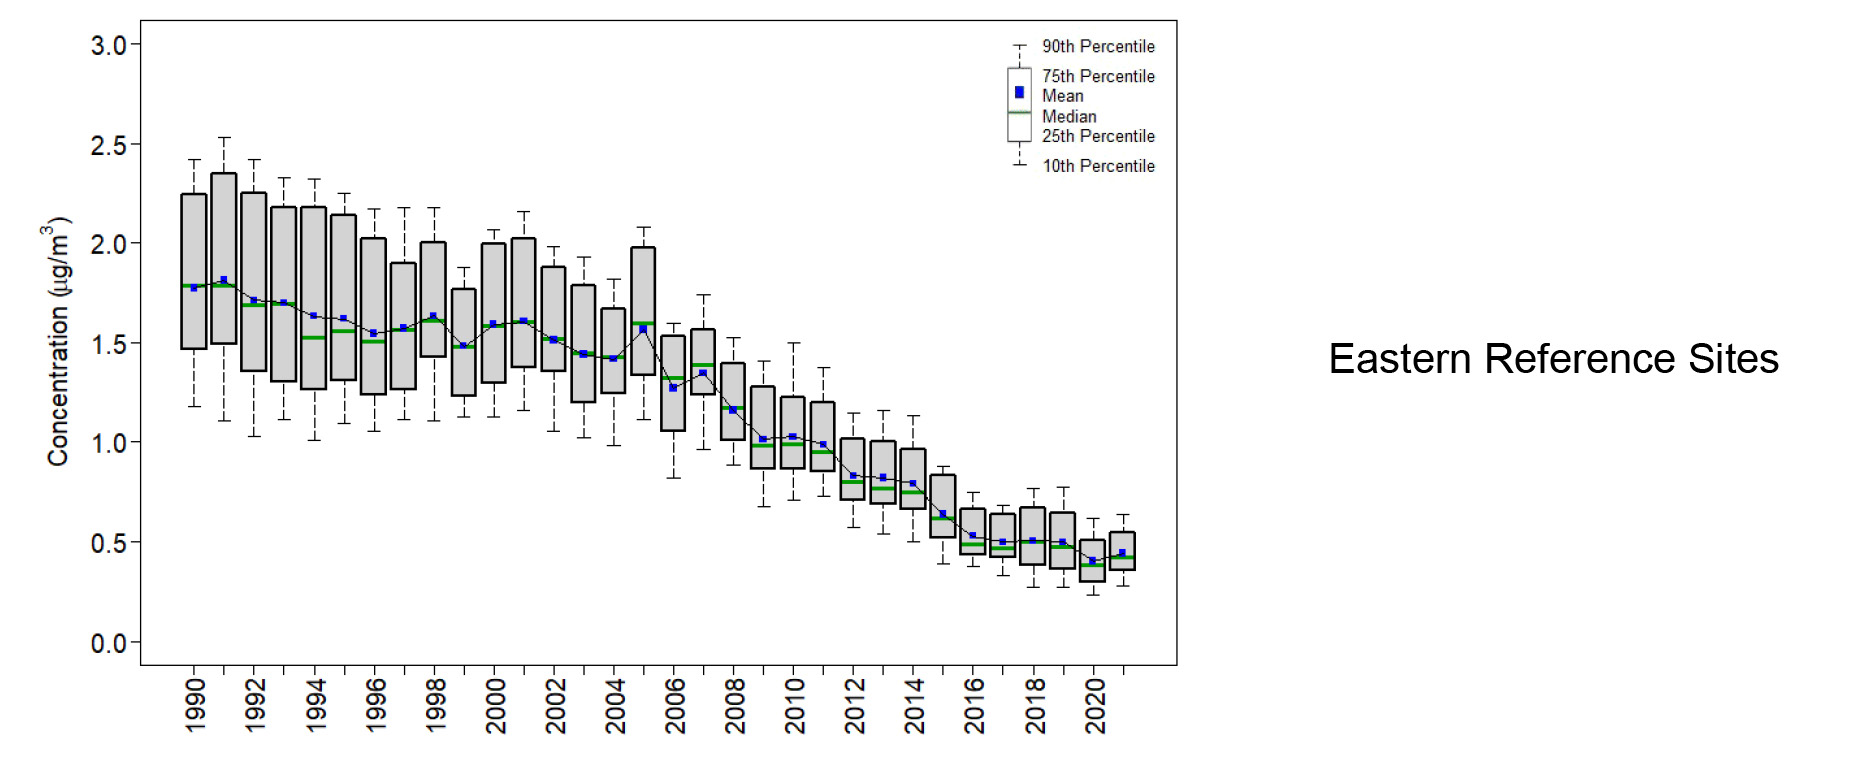
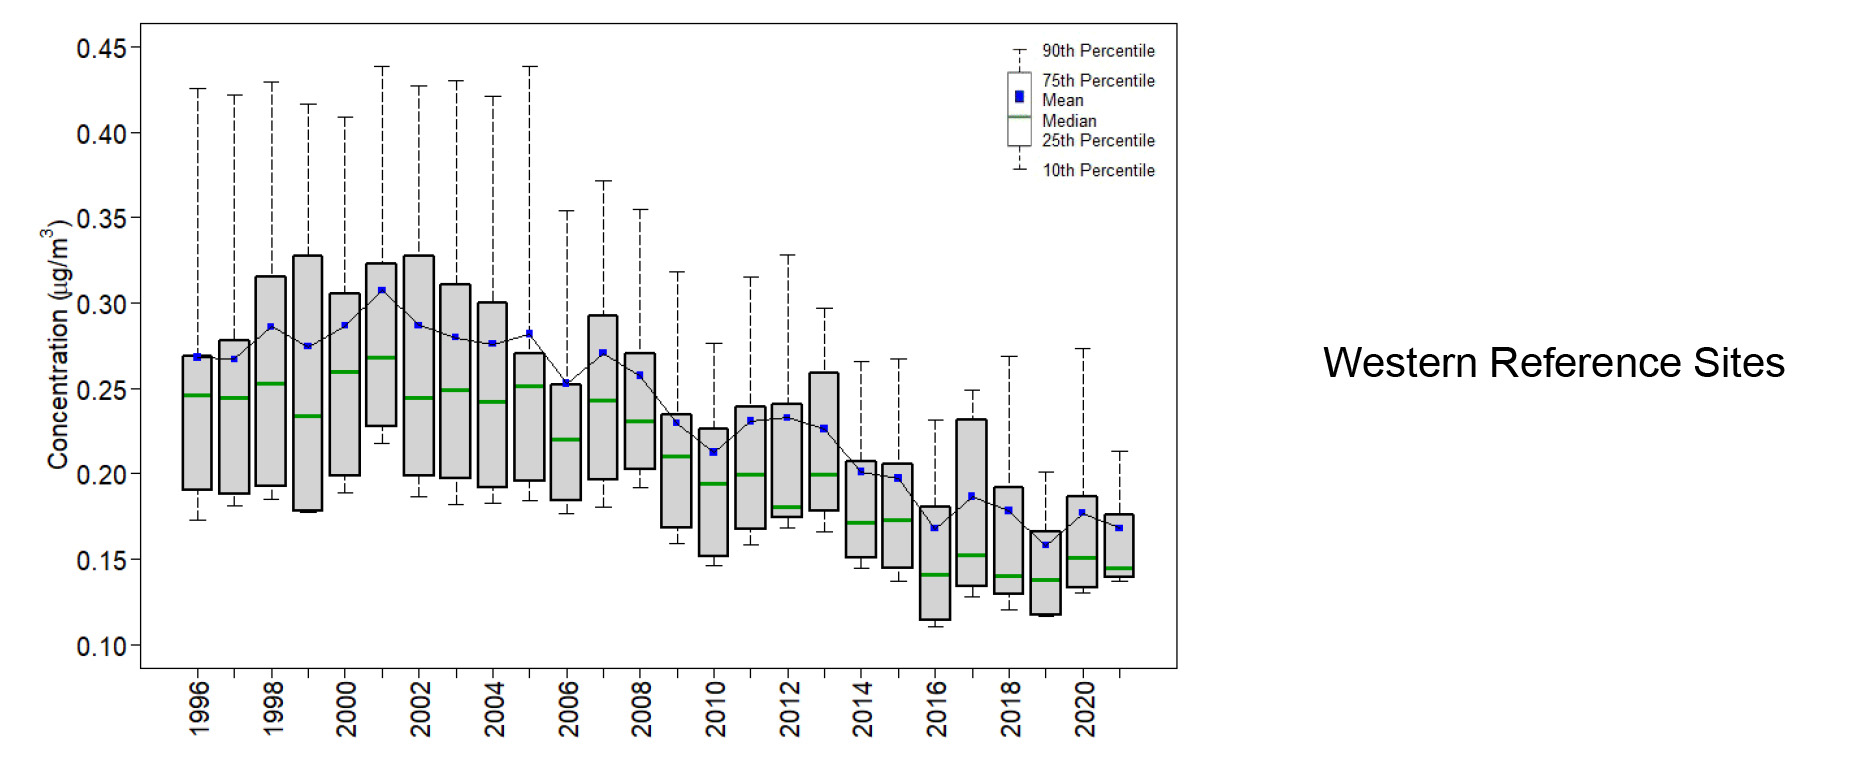
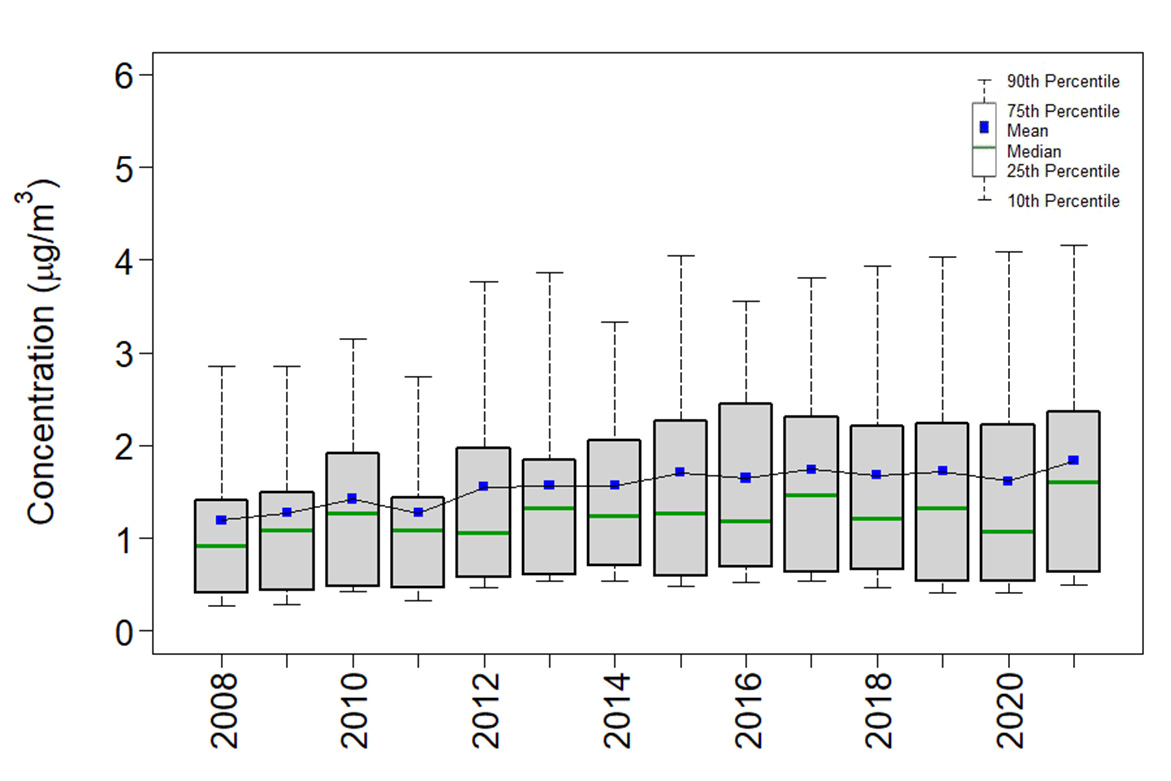
Nitric acid and particulate NO3- are measured on CASTNET filter packs, and the sum is reported as total NO3-. Annual mean total NO3- concentrations measured in 2021 are presented in the map in Figure 9. Sites that did not meet the completeness criterion appear as a dot with no value on the various concentration maps. To illustrate trends, Figure 10 provides box plots of total NO3- levels for the eastern and western reference sites through 2021.
Particulate Ammonium Concentrations
A map of 2021 annual mean particulate NH4+ concentrations is provided in Figure 11. Figure 12 shows box plots of NH4+ concentrations.
Ammonia Concentrations
Annual mean NH3 concentrations for 2021 from NADP/AMoN sites that met completeness requirements are mapped in Figure 13. Trends from NADP/AMoN sites that were active from 2008 through 2021 are shown in Figure 14.
Continuous Trace-level NOy and Filter Pack Total Nitrate Concentrations
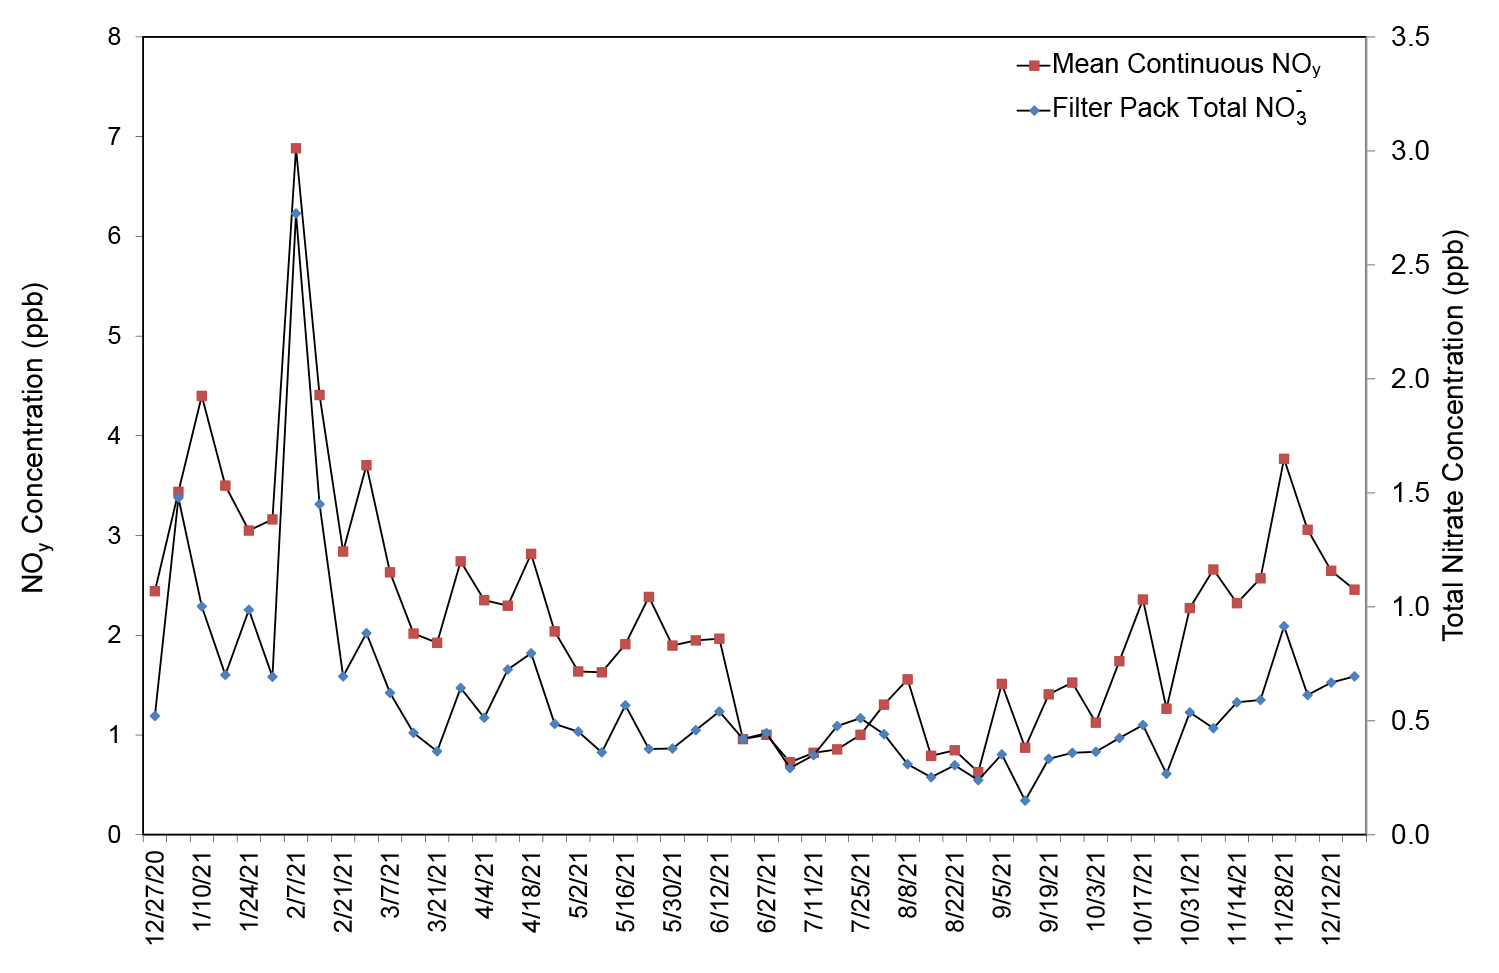
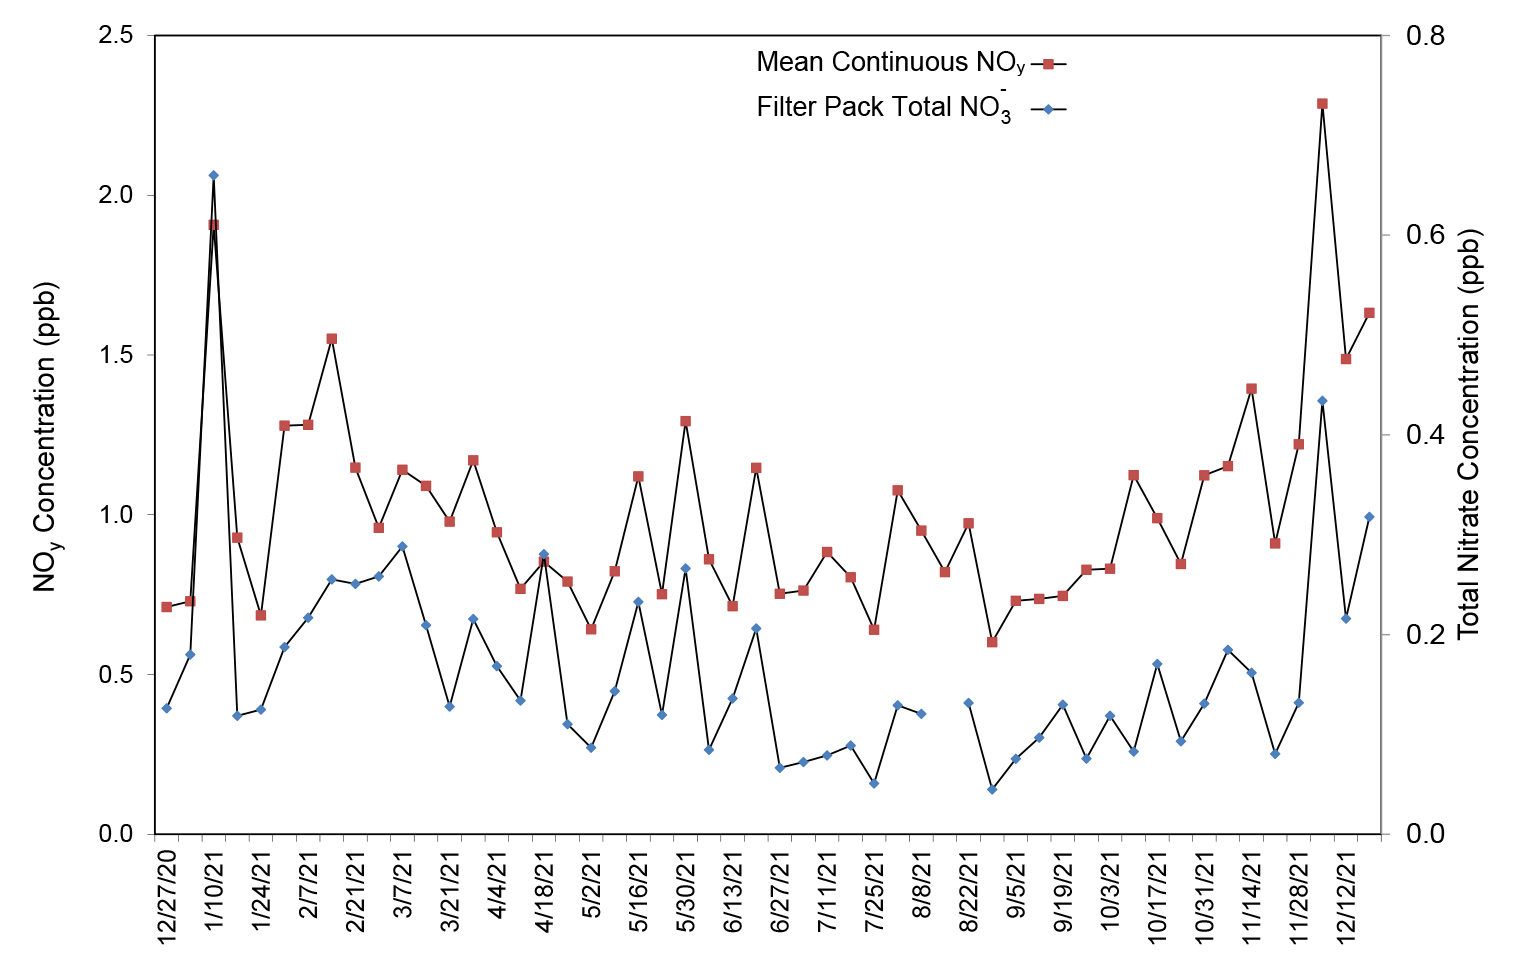
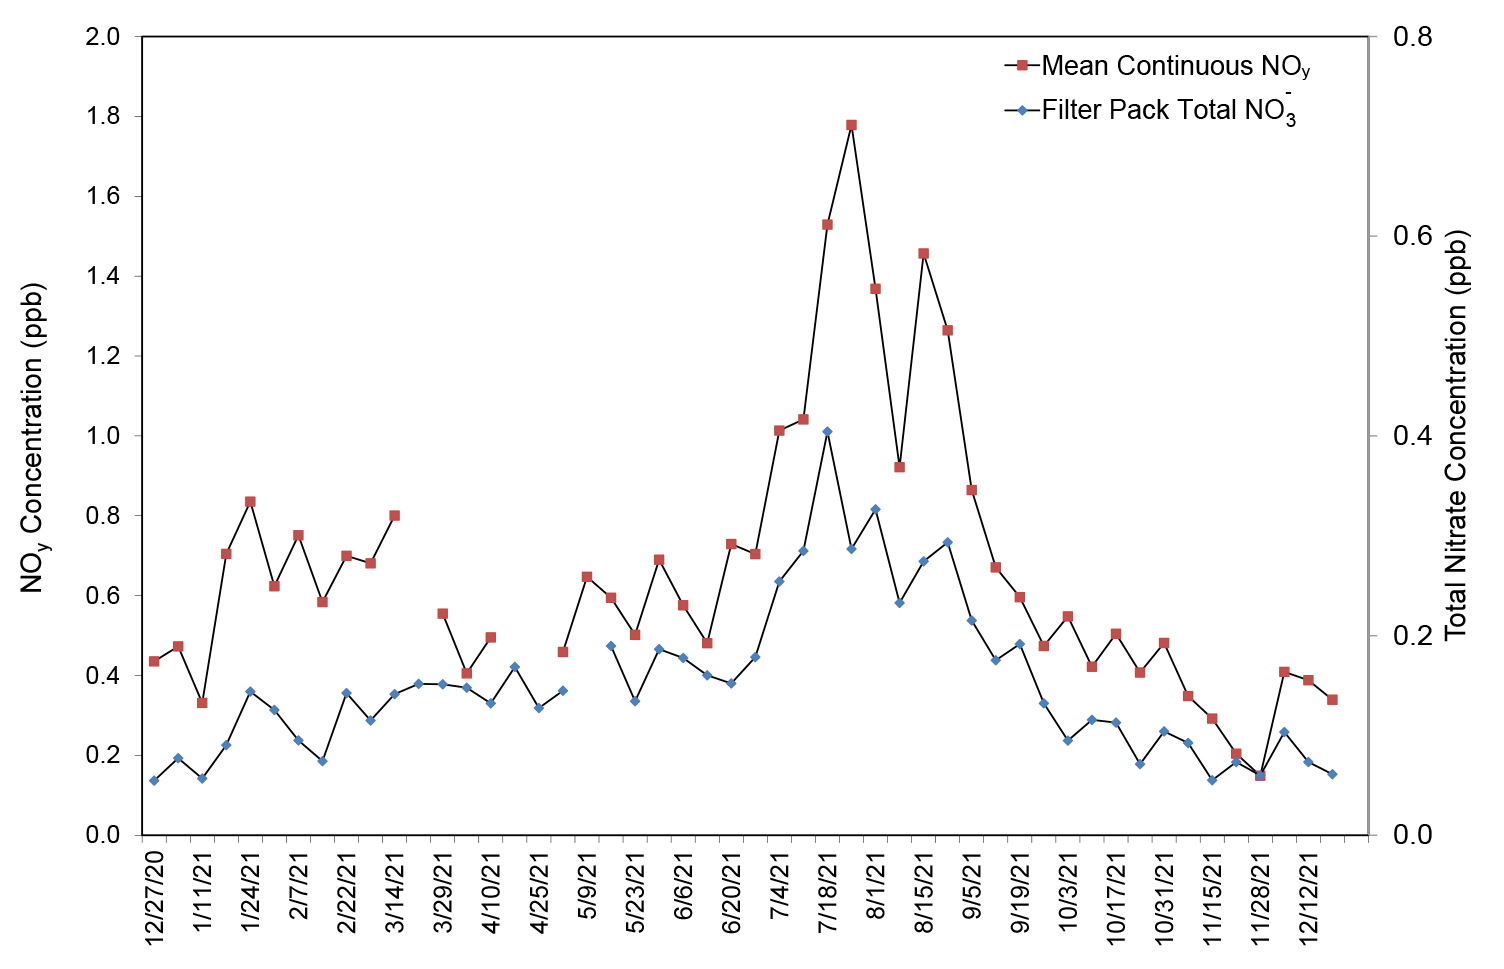
NOy is defined as NOx (NO + nitrogen dioxide) plus NOz (HNO3, nitrous acid, peroxyacetyl nitrate, peroxyproyl nitrate, other organic nitrates, and nitrite). It consists of reactive gases that are considered precursors of O3 and PM2.5. Because HNO3 and particulate NO3- are measured as components of NOy, NOy concentrations should always be higher than total NO3- levels (i.e., the ratio of NOy to total NO3- should always be greater than 1.0). A comparison of weekly mean continuous NOy concentrations with filter pack total NO3- levels at Mammoth Cave National Park, KY (MAC426); Huntington Wildlife Forest, NY (HWF187); and Pinedale, WY (PND165) for 2021 was used to evaluate the 2021 measurements (Figures 15 through 17). The scales for NOy and total NO3- levels are different in the three figures. The NOy concentrations were consistently higher than the total NO3- levels, as expected. The results are similar for all seven sites operating continuous NOy analyzers.
The weekly total NO3- concentrations, the average weekly NOy levels, and their ratios are listed in Table 3. These were calculated as the average of all valid weekly filter pack concentrations, the average of mean NOy values matching the run time of the weekly filter packs, and the average of the ratios calculated for each week.
Figure 15 Comparison of MAC426, KY Weekly Mean Continuous Trace-level NOy and Filter Pack Total NO3- Concentrations
 Download Figure
Figure 16 Comparison of HWF187, NY Weekly Mean Continuous Trace-level NOy and Filter Pack Total NO3- Concentrations
 Download Figure
Figure 17 Comparison of PND165, WY Weekly Mean Continuous Trace-level NOy and Filter Pack Total NO3- Concentrations
 Download Figure
Table 3 Summary of Total NO3- and NOy Measurements for 2021
| Site Location | Elevation (m) | Total NO3- (ppb) | NOy (ppb) | Ratio |
|---|---|---|---|---|
| BVL130, IL | 213 | 0.89 | 4.03 | 4.87 |
| MAC426, KY | 243 | 0.59 | 2.19 | 3.89 |
| HWF187, NY | 497 | 0.17 | 1.01 | 7.24 |
| GRS420, TN | 793 | 0.38 | 1.52 | 4.29 |
| PNF126, NC | 1216 | 0.29 | 0.89 | 3.09 |
| PND165, WY | 2386 | 0.15 | 0.66 | 4.63 |
| ROM206, CO | 2742 | 0.21 | 1.08 | 5.62 |
Sulfur Atmospheric Concentrations
Annual mean concentrations of SO2 and SO42- for 2021 are presented in Figures 18 and 20, respectively, in this section. Trends in annual mean concentrations are also shown in Figures 19 and 21. Sites that did not meet the completeness criterion appear as a dot with no value on the various concentration maps.
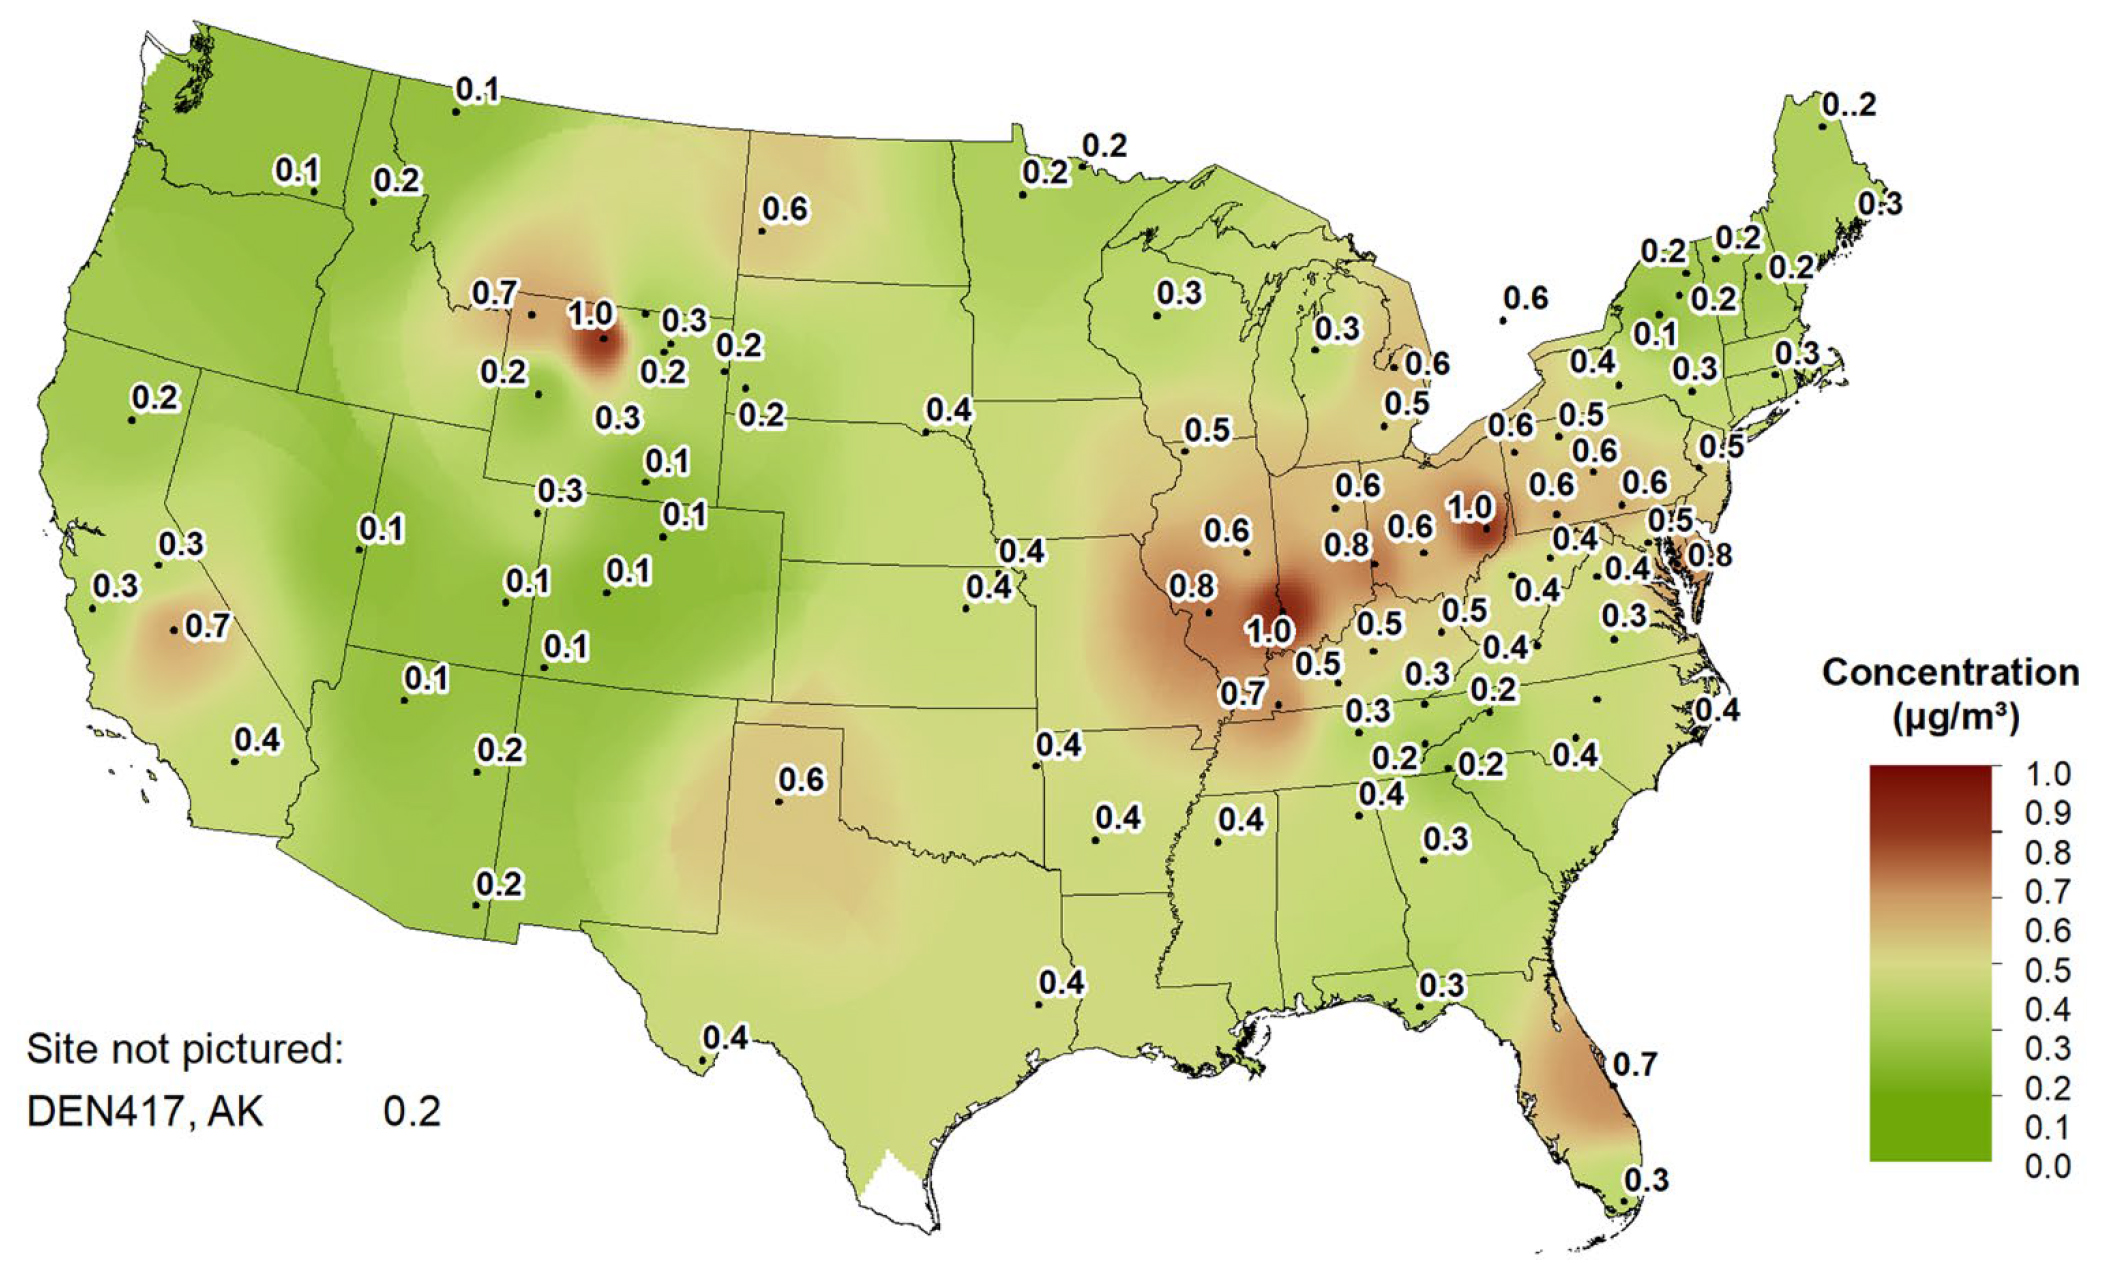
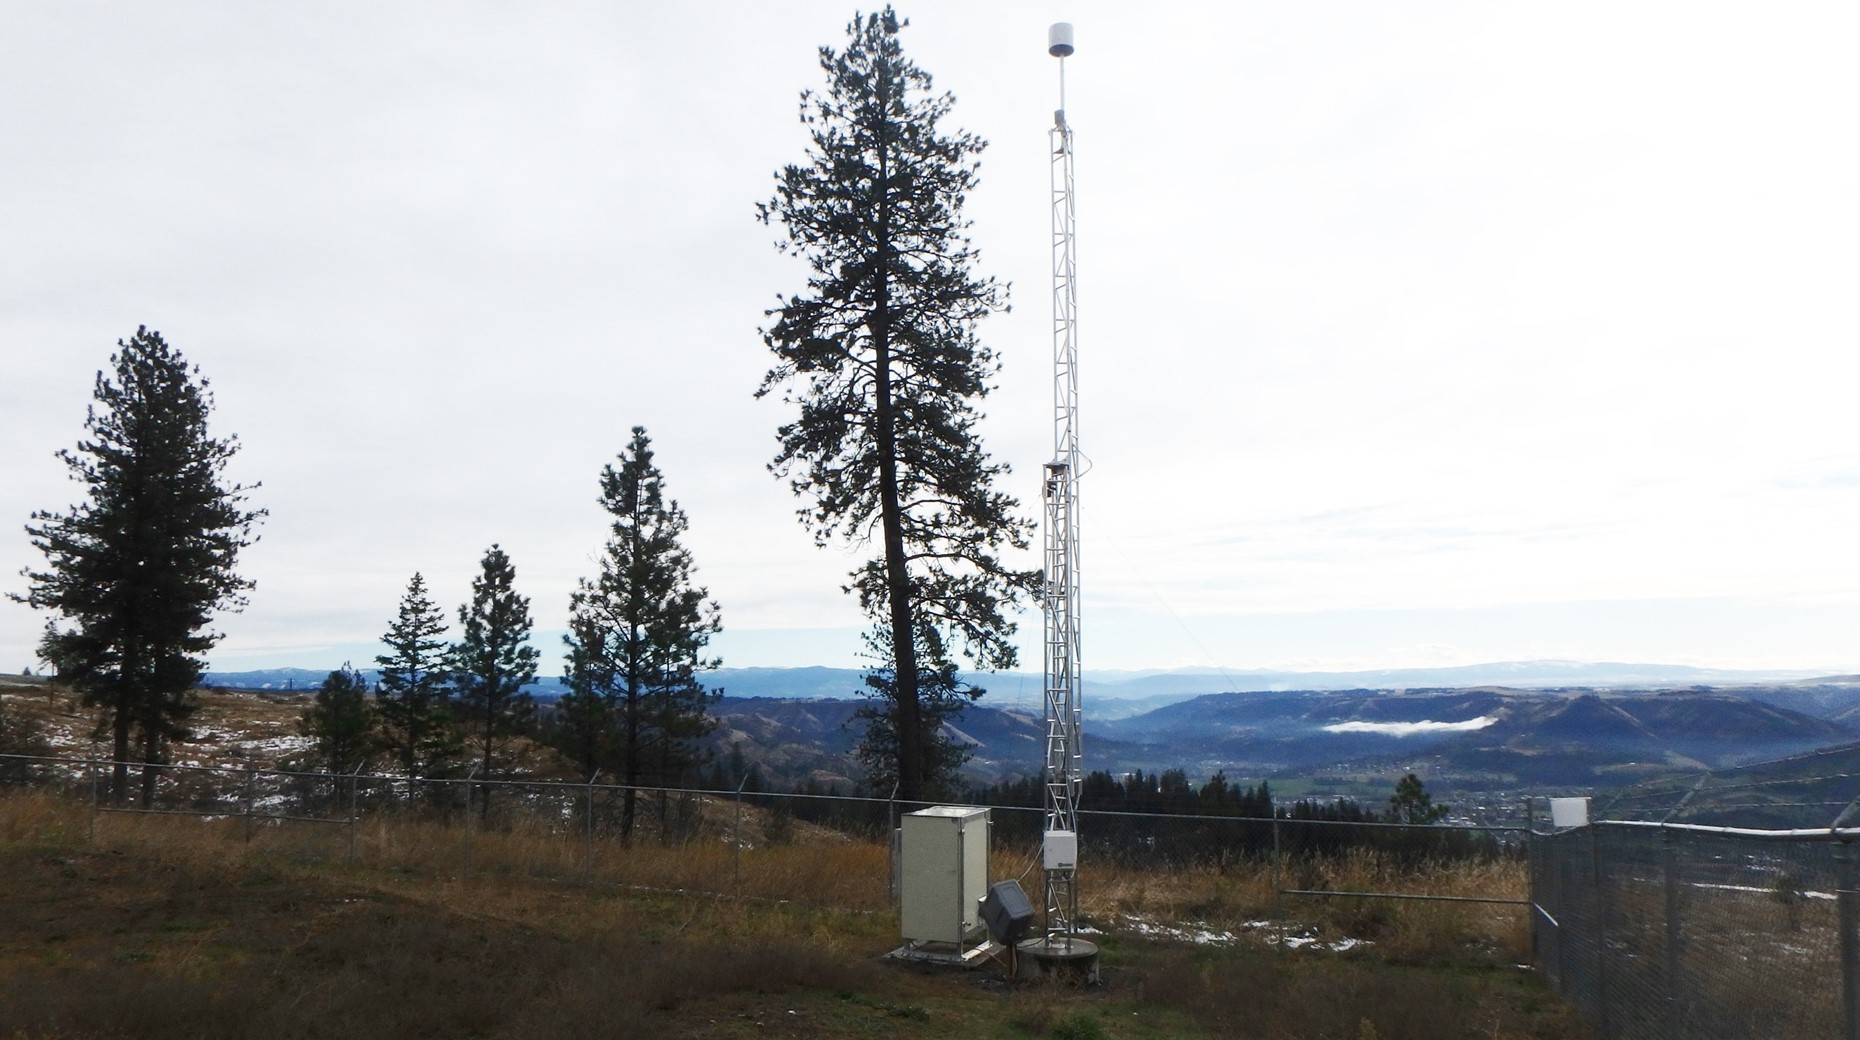
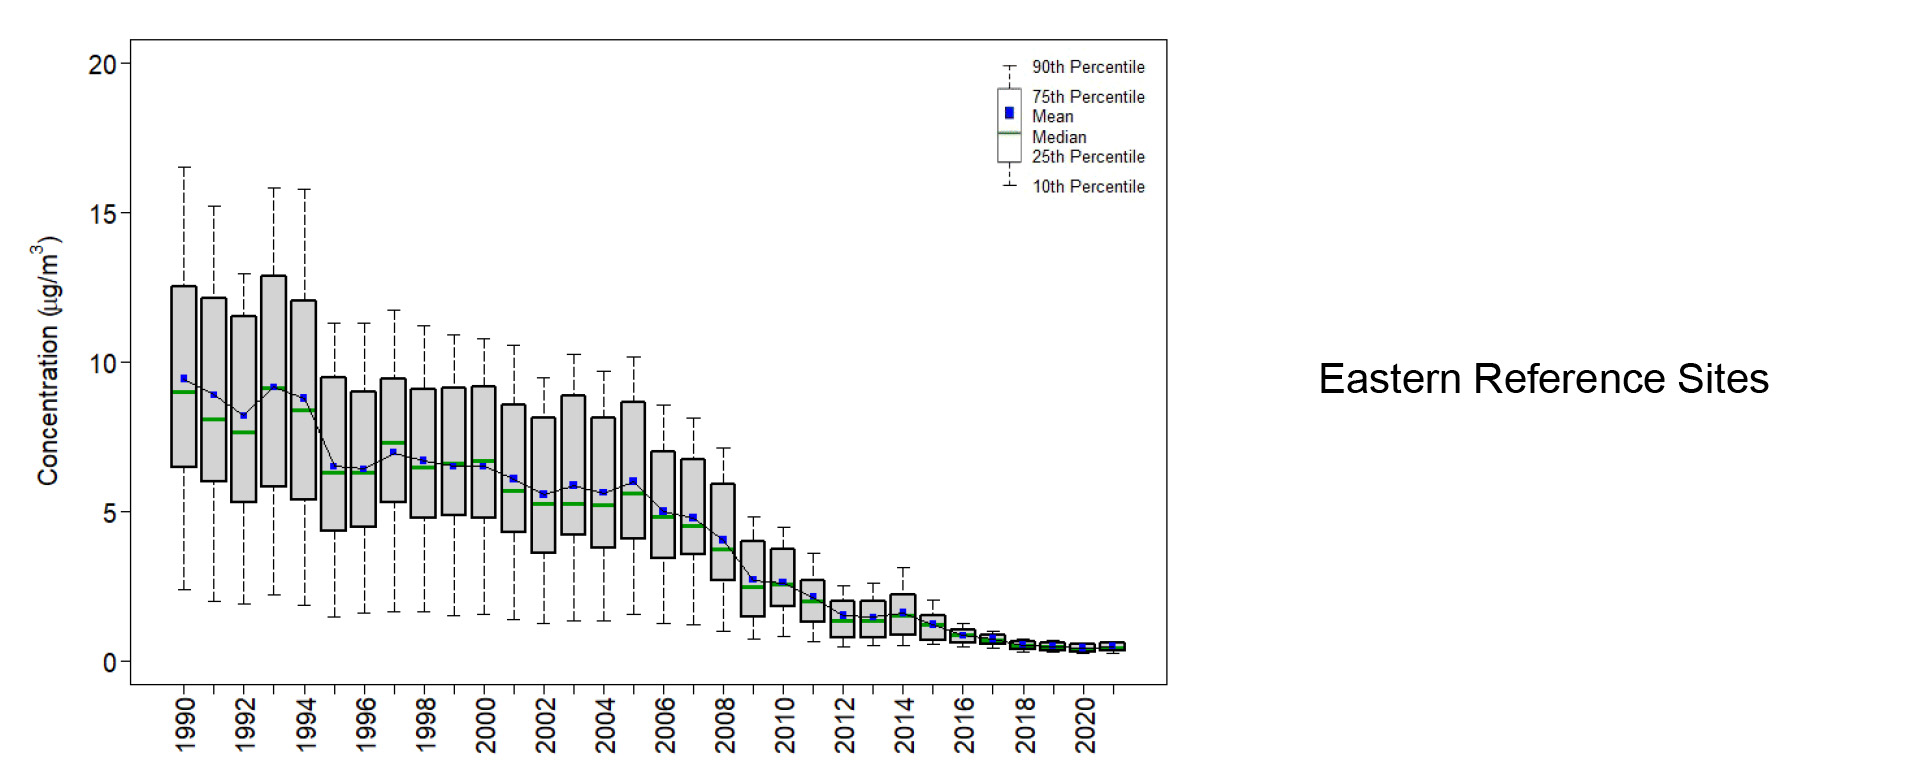
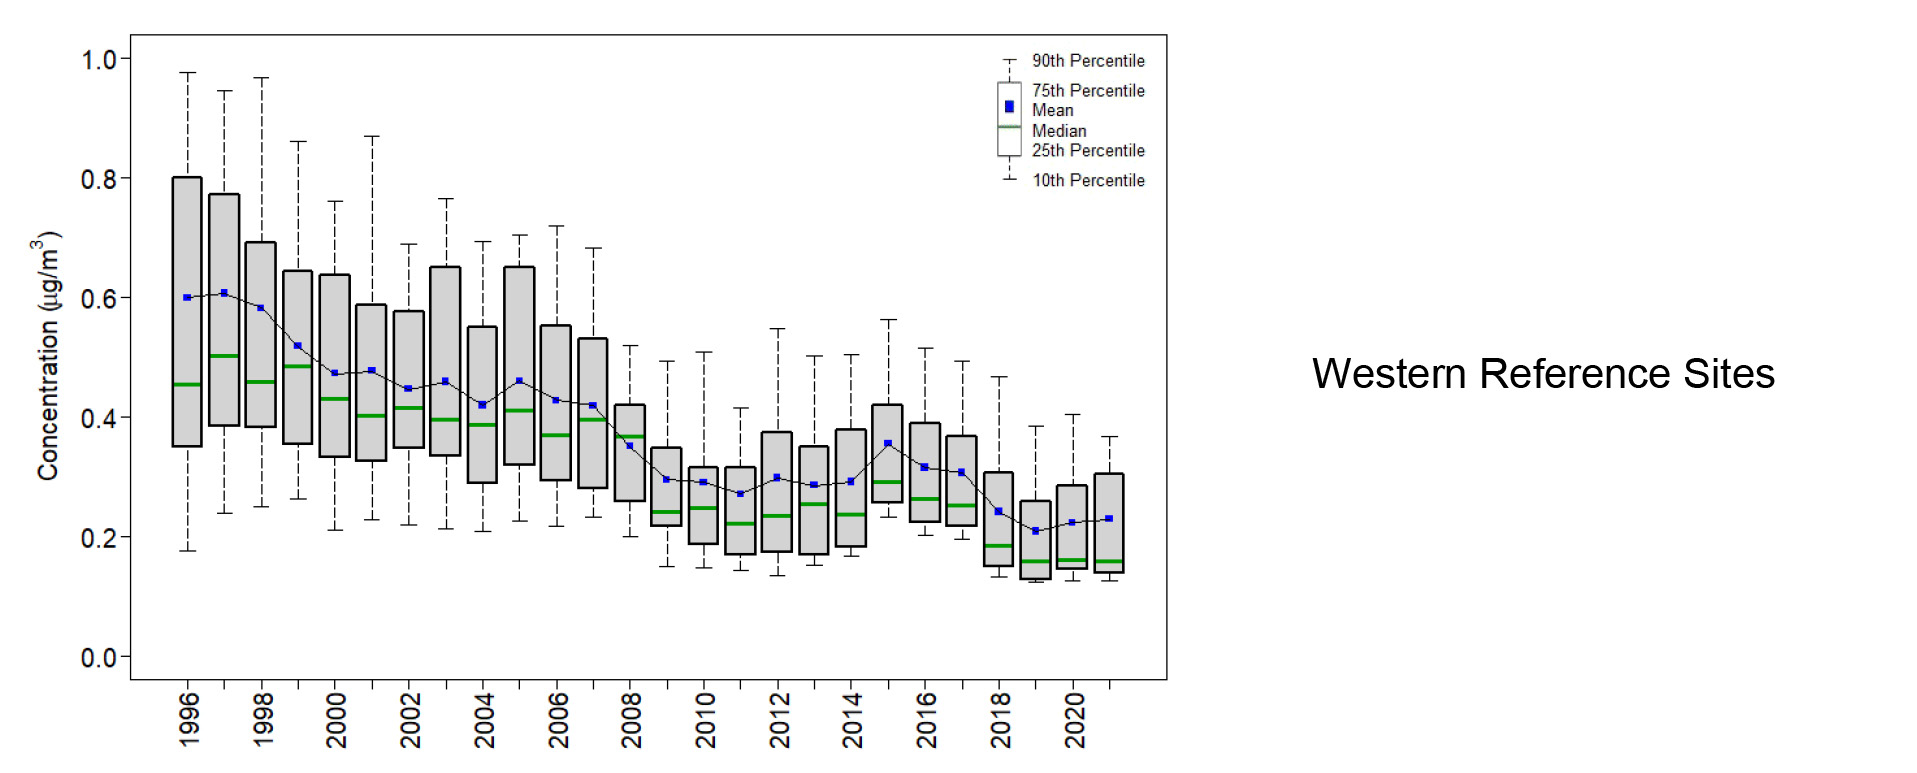
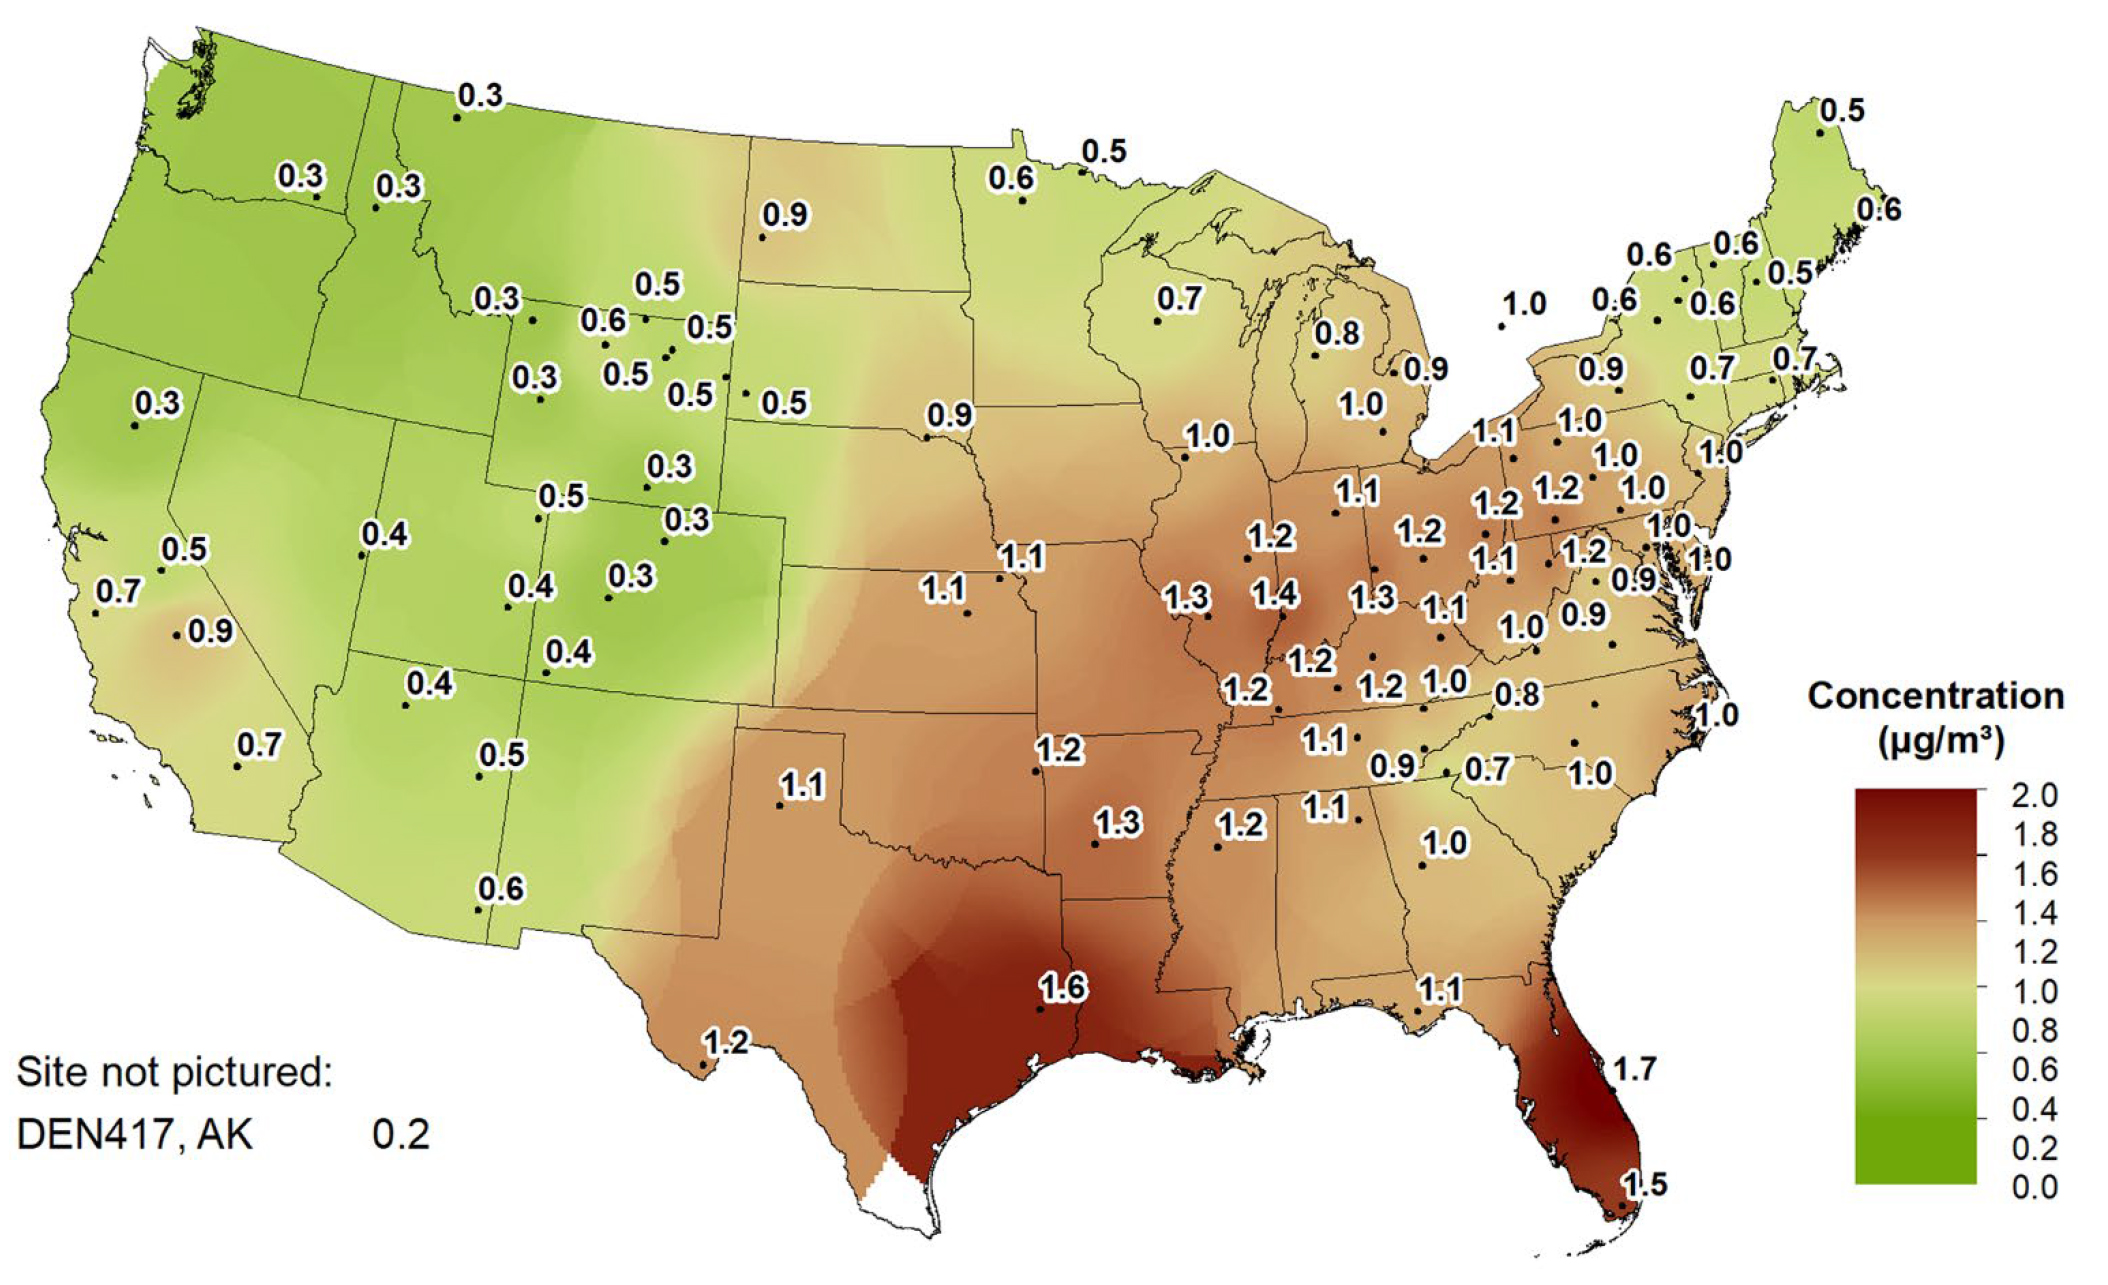
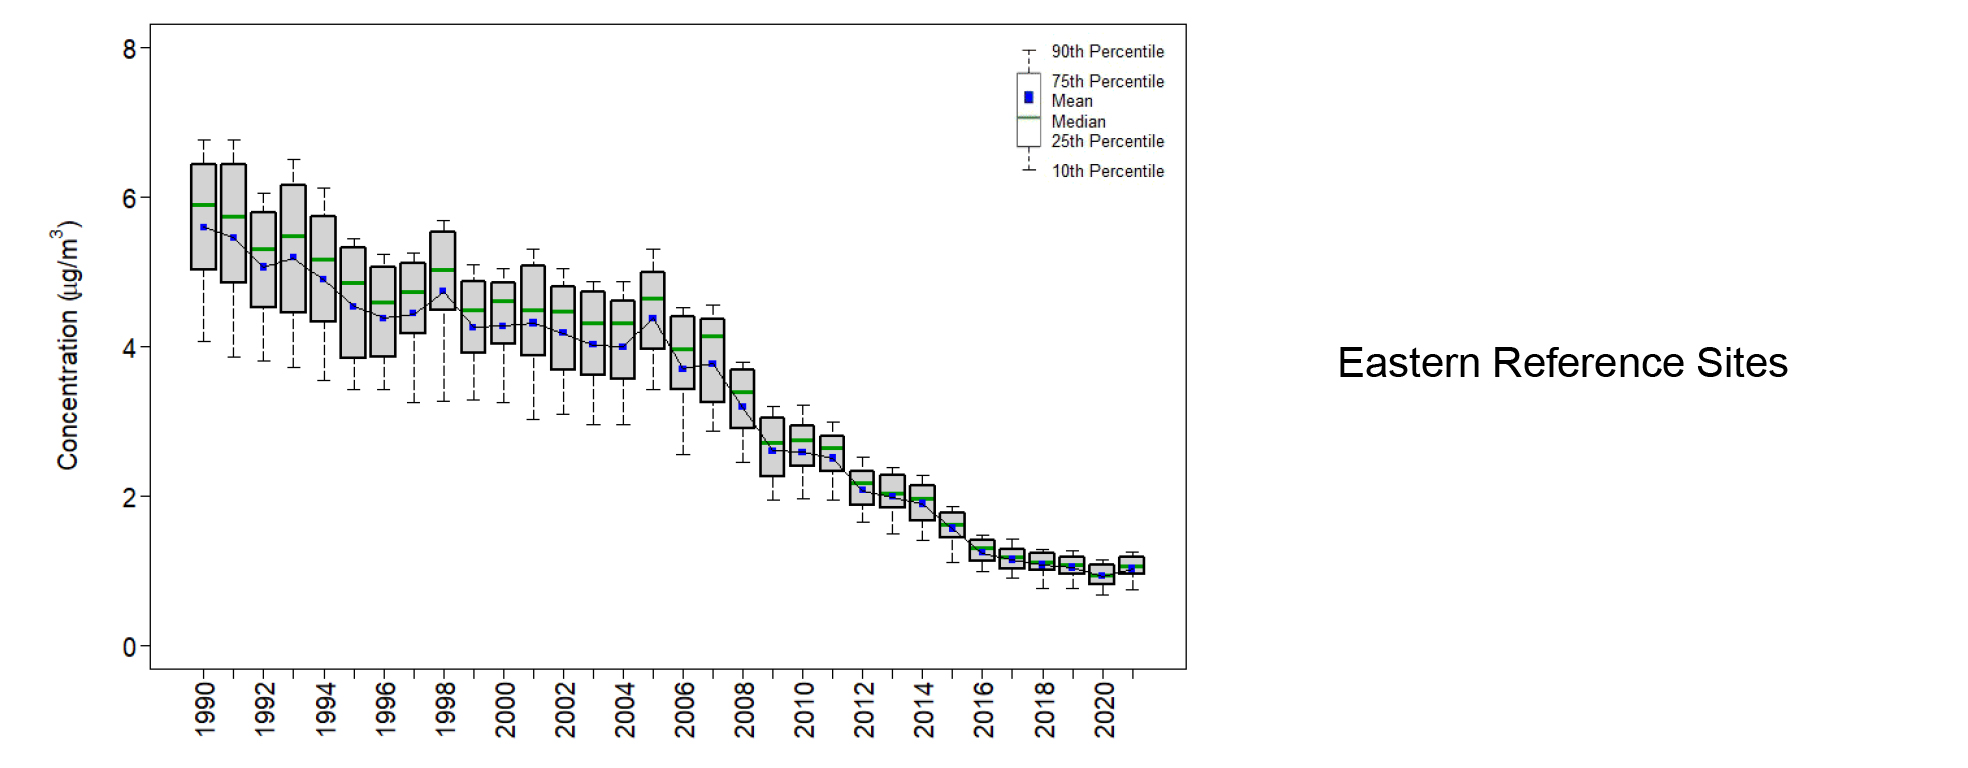
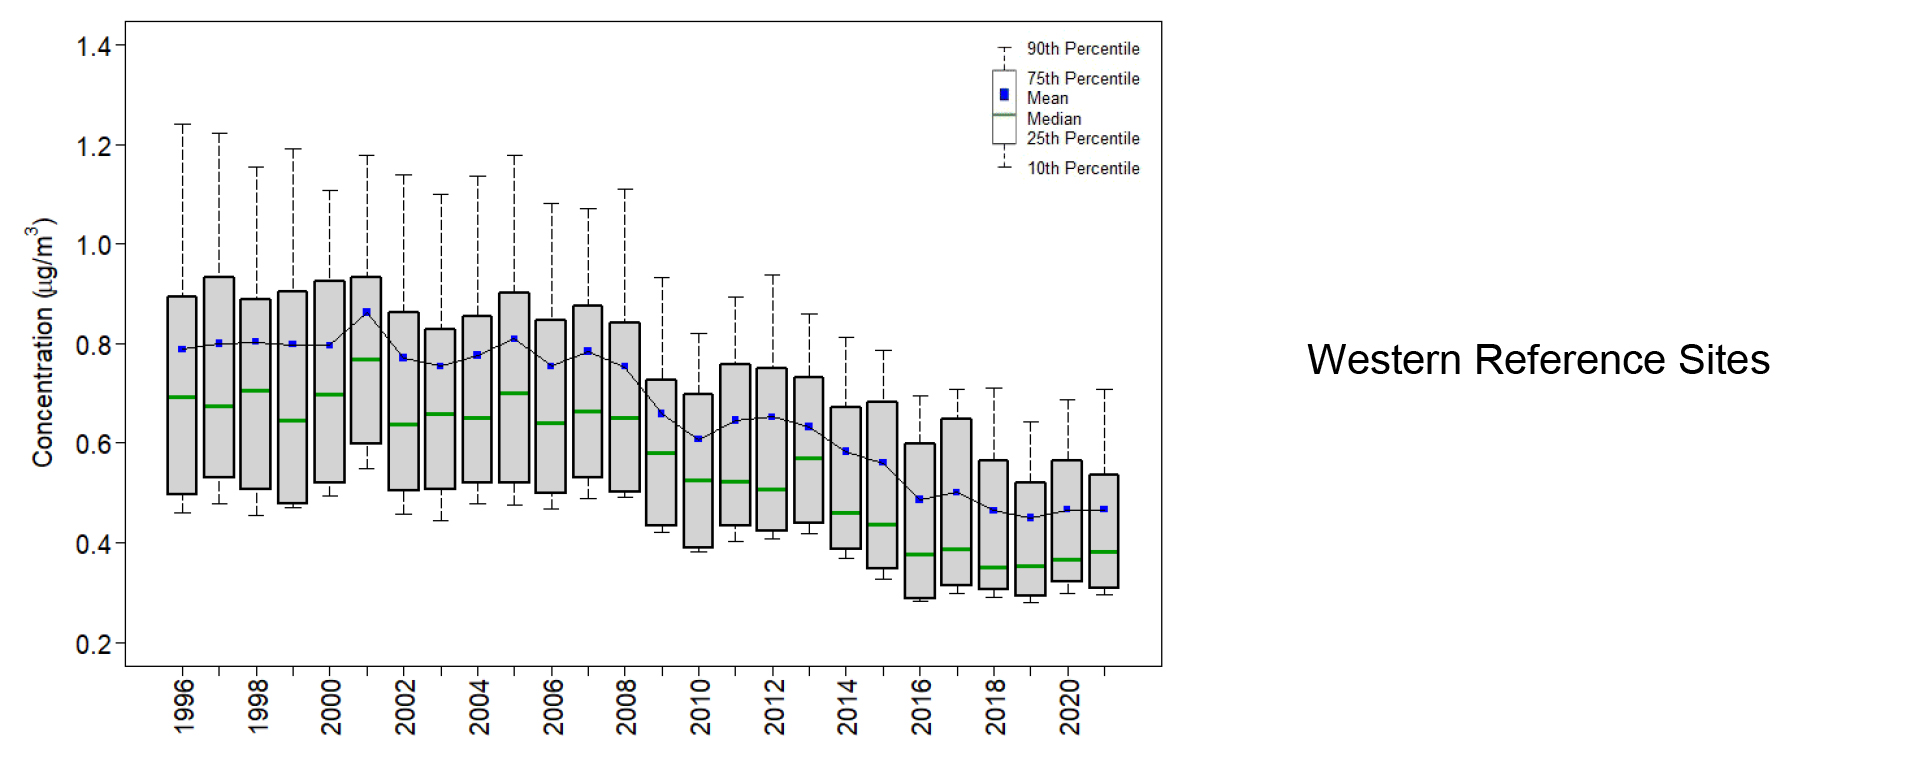
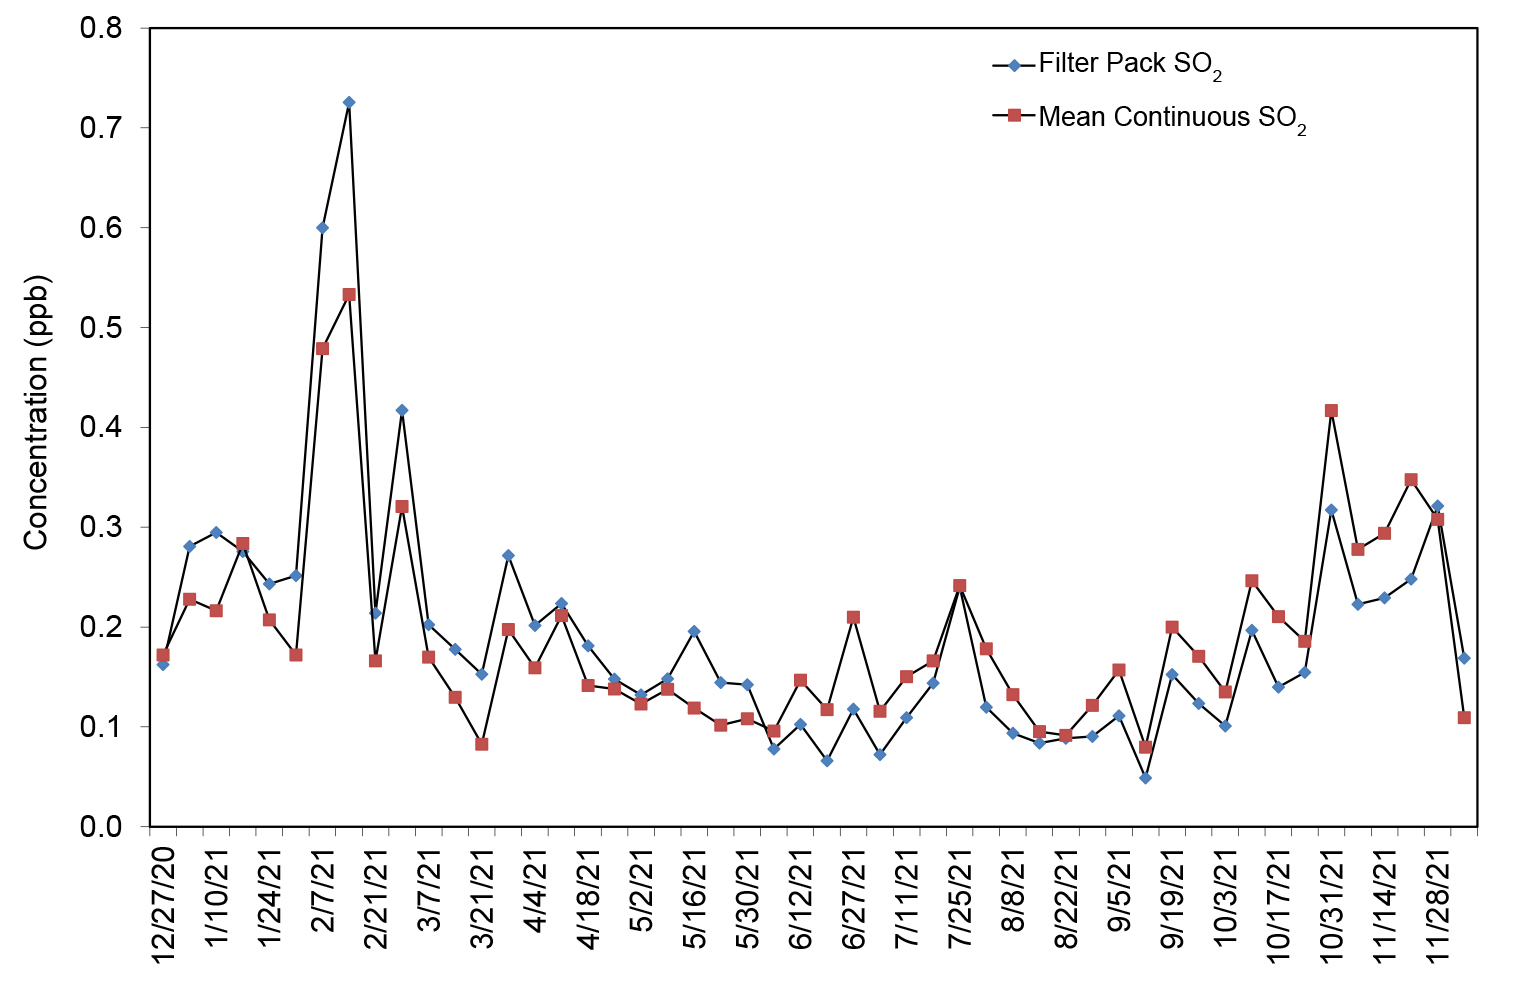
Figure 22 provides a diagram that compares weekly filter pack SO2 concentrations with continuous trace-level gas data measured at MAC426, KY. The continuous analyzer provides a gross check of the filter pack measurements. The continuous analyzer data can also be used to produce diurnal profiles of hourly SO2 concentrations and detect the presence of SO2 plumes.
Figure 22 Comparison of MAC426 Weekly Mean Continuous and Filter Pack SO2 Concentrations
 Download Figure
Wildfire Impacts to Ozone and Biomass Concentrations at Rocky Mountain National Park
The co-located CASTNET monitoring sites at ROM406/206 (Figure 1) are in the Northern Front Range in Larimer County, Colorado. Ozone and meteorological measurements began at ROM406 in 1987 as part of the NPS Gaseous Pollutant Monitoring Program and were adopted into CASTNET in 1994. Measurements at ROM206, the EPA-operated site of the pair, began in 2011. Despite being within a Class I protected area, ROM406/206 is frequently impacted by local and regional air pollution. ROM406/206 measured an O3 design value of 71 ppb for the three-year period 2019–2021, which is above the 2015 O3 NAAQS..
In Colorado, two of the largest wildfire seasons on record occurred in 2018 and 2020, including five wildfires greater than 100,000 acres. The largest wildfire in Colorado history, the Cameron Peak fire, began in August 2020 and ended in December 2020. It consumed 209,000 acres and destroyed 469 structures The fire covered sections of Rocky Mountain National Park. Seventeen O3 exceedances were observed at ROM406/206 in 2018 and 2020, with over half of them likely enhanced by wildfires. This section discusses the relationship between O3 concentrations, filter pack measurements, trace level gas measurements, and satellite-based wildfire smoke data.
Wildfires
Wildfires generate particulate matter and O3 precursors that may influence tropospheric O3 levels depending on meteorological conditions and smoke density. Dense wildfire smoke may block ultraviolet light and subsequently reduce O3 photochemical production. Wildfires emit cellulose and hemicellulose compounds including levoglucosan, which is a common wildfire indicator due to its high concentrations (e.g., 40 to 1,200 milligrams per kilogram) and relative stability within the atmosphere (Simoneit et al., 1999; Simoneit, 2002).
Measurements
In addition to standard CASTNET measurements, other data were collected at ROM406/206 from 2018 through 2020 to help understand how wildfires impact air quality:
- Hourly NO and NOy were measured using a Teledyne API T200U NOy analyzer.
- Daily concentrations of biomass compounds, including levoglucosan and other organic carbohydrates, sugars, sugar alcohols, and base cations, were measured using a URG 47-millimeter nylon filter by Colorado State University (CSU).
- The URG nylon filters were analyzed at the CSU laboratory using high‐performance anion exchange chromatography with pulsed amperometric detection; for more on this analysis, see Sullivan et al. (2011a; 2011b).
- In June 2020, the URG sample period was changed from daily to every three days.
Methods
Wildfire smoke data from NOAA’s Hazard Mapping System (HMS) were used to characterize the impact of smoke on air quality at ROM406/206 for 2018 and 2020. HMS wildfire data from 2019 were not included due to limited wildfire activity. The HMS wildfire data consisted of 2-km horizontal resolution measurements from the two Geostationary Operational Environmental Satellites (GOES-16 [East] and GOES-17 [West]). The smoke density at the sites was classified using the three HMS smoke density levels of light, medium, and heavy, which approximate smoke concentrations of 0 to 10 micrograms per cubic meter (µg/m 3 ) of air, 10 to 21 µg/m 3 , and 21 tO32 µg/m 3 , respectively (McNamara et al., 2004; NOAA, 2019). DM8A O3 concentrations were calculated and compared with daily biomass (as levoglucosan) concentrations, NOAA HMS smoke density data, daily averages of trace-level NO and NOy measurements, and weekly CASTNET filter pack concentrations. Daily NOAA HMS smoke densities for ROM406/206 were mapped/intersected using ArcGIS ArcMap v10.8.1. The densest smoke level was used when multiple smoke densities occurred on the same day.
Results
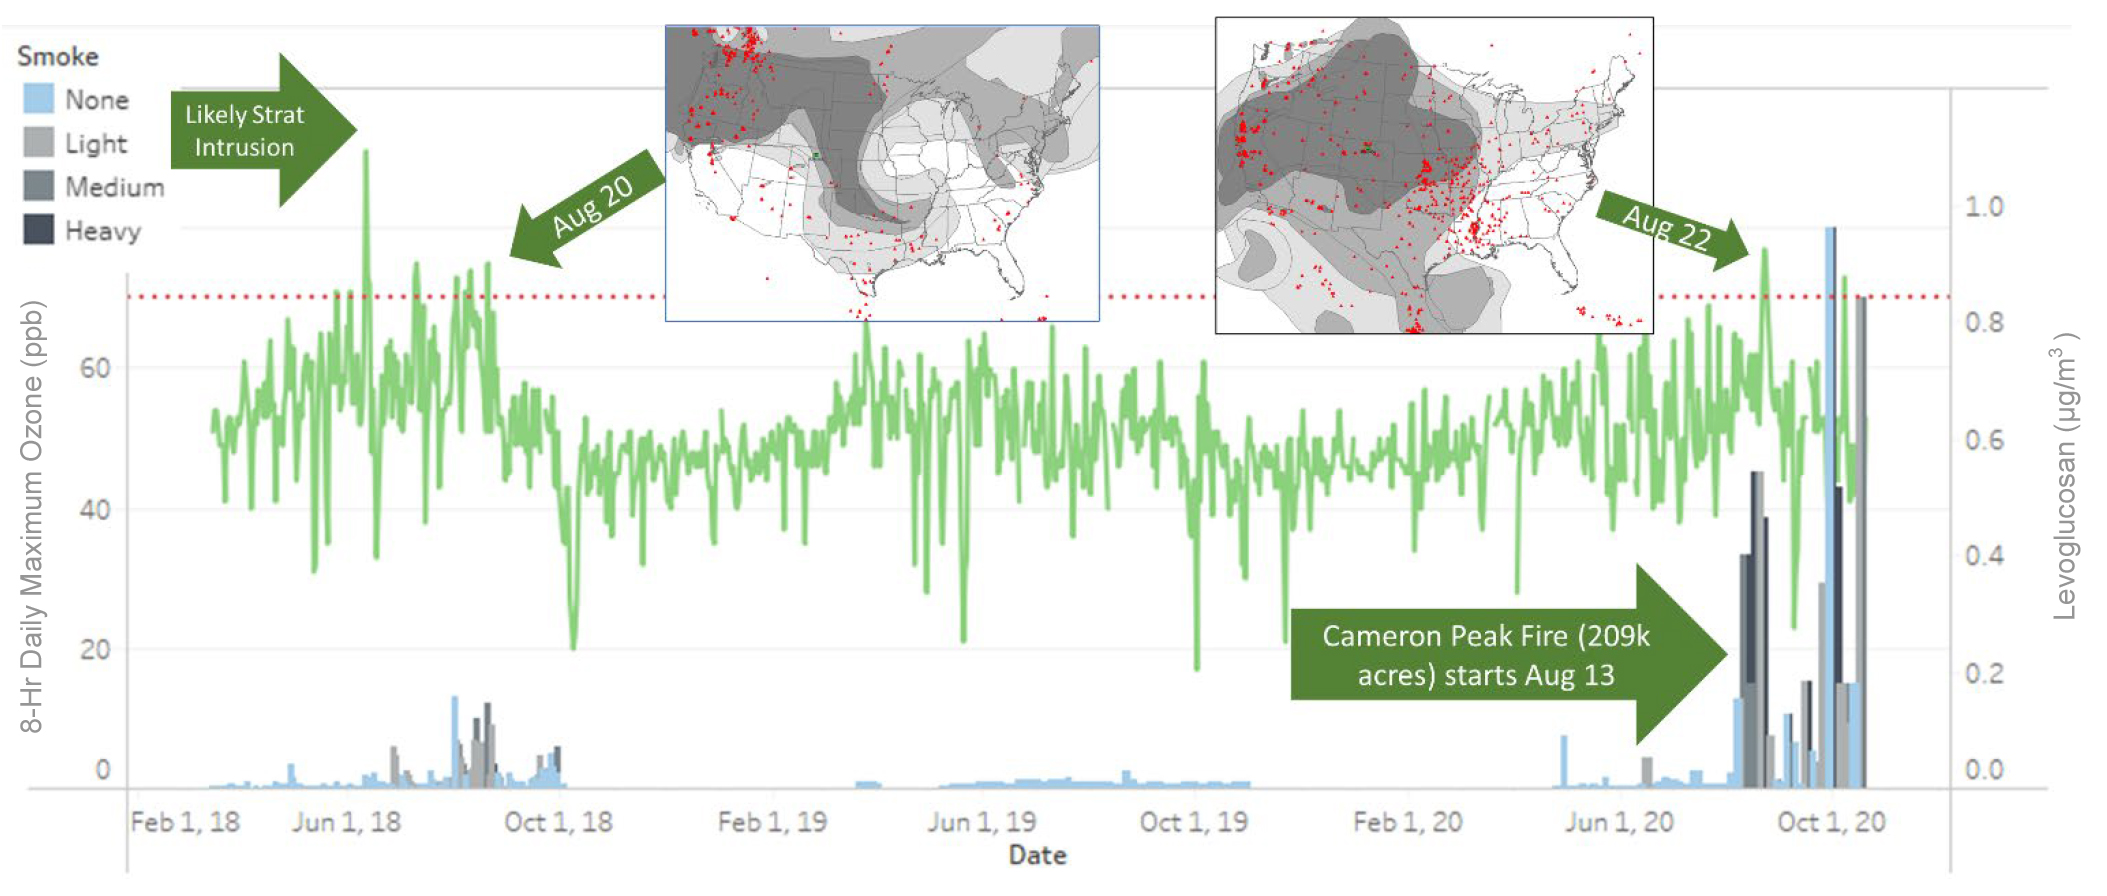
Twelve O3 exceedances were observed in 2018 and five exceedances occurred in 2020 (Figure 23). Five of the 12 O3 exceedances in 2018 had levoglucosan levels above the annual 75th percentile (0.018 µg/m 3 ), and 6 of these 12 O3 exceedances showed NOAA HMS smoke events (any density). Four of the five 2020 O3 exceedances had levoglucosan levels above the annual 75th percentile (0.127 µg/m 3), and all five exceedances indicated NOAA HMS smoke events. On June 11, 2018, the DM8A O3 value of 91 ppb was flagged as an informational stratospheric O3 intrusion (“IO”) by request of the Colorado Department of Public Health and Environment (Harshfield, 2019).
Figure 23 DM8A O3 and Color-coded NOAA-HMS Smoke Density Levoglucosan Concentrations
 Download Figure
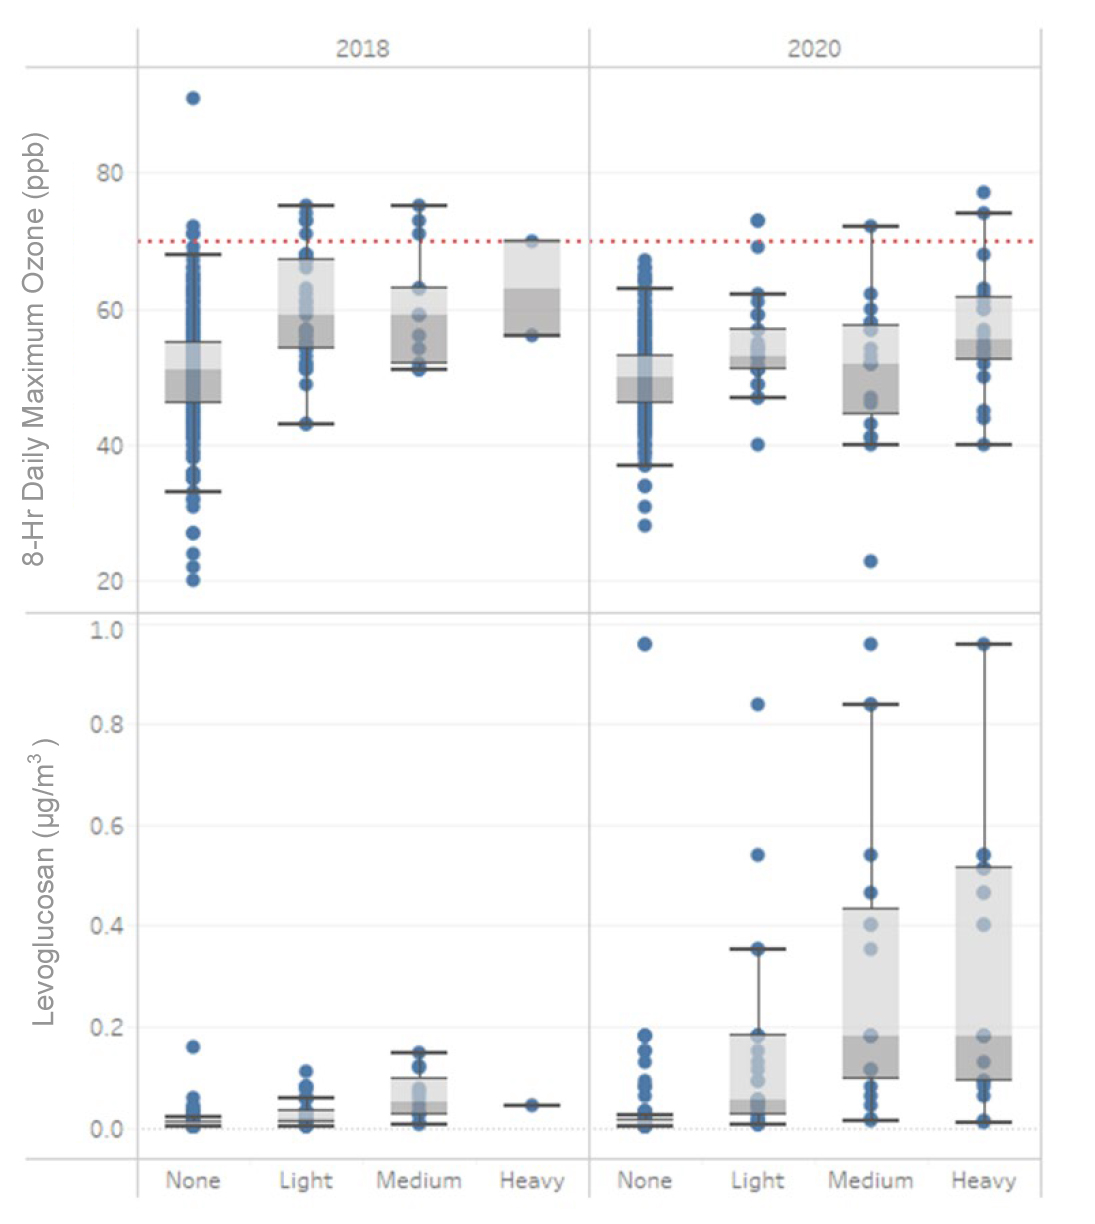
Figure 24 DM8A O3 and Levoglucosan Concentrations as a Function of NOAA HMS Smoke Density
 Download Figure
As shown in Figure 24, the median DM8A O3 value in 2018 was 51 ppb without NOAA HMS smoke and was 59 ppb, 59 ppb, and 63 ppb under light, medium, and heavy smoke density, respectively, resulting in a smoke-enhancement of 8 to 12 ppb. In 2020, the median DM8A O3 value was 50 ppb without smoke, but was 53 ppb, 52 ppb, and 55 ppb under light, medium, and heavy smoke density, respectively, a smoke-enhancement of 2 to 5 ppb. The 2020 median levoglucosan concentrations ranged from 3.1 to 6.3 times higher than values from 2018, and both years had positive correlations with smoke density.
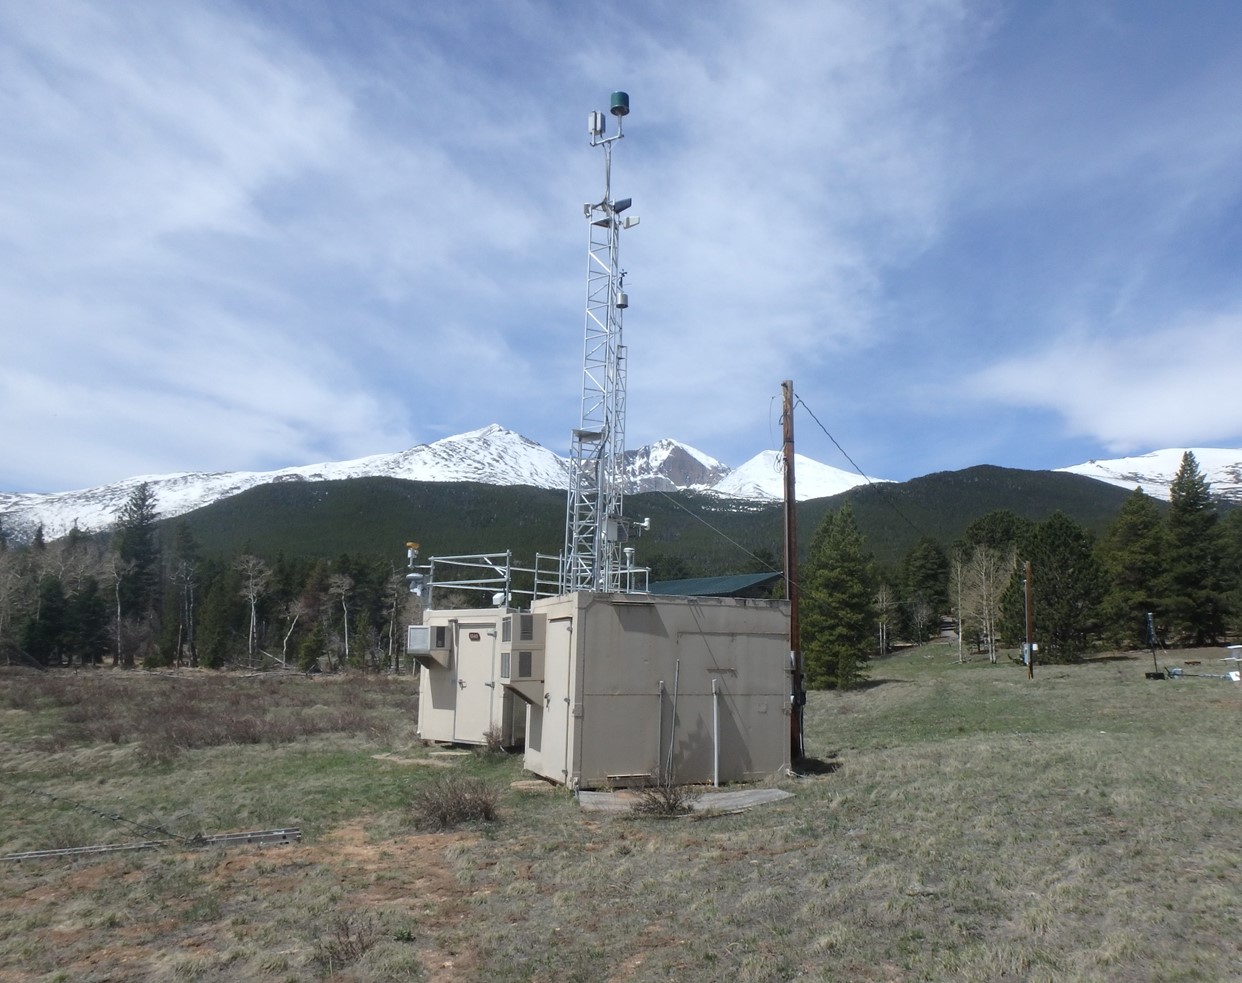
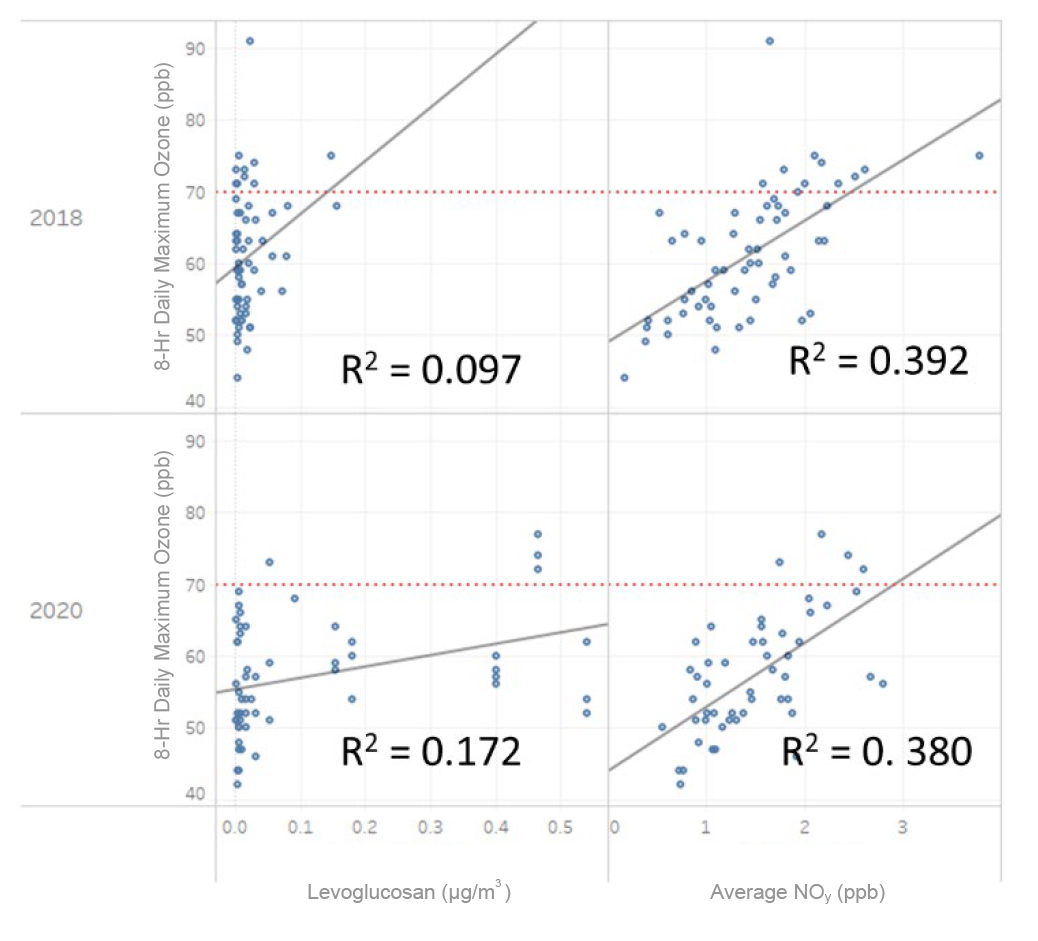
Figure 25 Linear Regression Plots of 8-hour Daily Maximum O3 versus Levoglucosan and Daily Average NOy (June, July, and August 2018 and 2020)
 Download Figure
Figure 25 displays linear regressions of 2018 and 2020 DM8A O3 concentrations compared against levoglucosan and daily average NOy concentrations in summer (i.e., June, July, and August) when precipitation was less than 0.5 cm. There is a faint positive trend between O3 and levoglucosan and a slight positive trend between O3 and NOy. Other results include:
- Ozone, levoglucosan, and wildfire smoke events exhibit a complex relationship.
- Ozone exceedances in 2018 and 2020 occurred when the NOAA HMS smoke density data showed wildfire smoke impacting the site, suggesting wildfire smoke is influencing O3 exceedances at Rocky Mountain National Park.
- Despite a weak linear relationship between O3 and levoglucosan levels (Figure 25), both analytes correlate with increasing values as a function of NOAA HMS smoke density.
- Daily average NOy showed the strongest positive relationship with O3 of the analytes measured.
Recommended Additional Work
Additional work is needed to relate the other URG biomass compound signatures (e.g., ratios of carbohydrates to sugars) as they relate to individual wildfires. Additional work beyond smoke density is needed to understand the effects that wildfire size, distance, and duration play on the magnitude of smoke impact to O3 enhancement. Exploration of methods for getting biomass concentrations from the current CASTNET filter pack measurements is needed.
Atmospheric Deposition
Gaseous and particulate nitrogen, sulfur, and other trace pollutants are deposited to the environment through dry and wet atmospheric processes. A primary goal of CASTNET is to estimate the dry deposition of pollutants from the atmosphere to sensitive ecosystems. The NADP TDep measurement-model technique (Schwede and Lear, 2014) combines CASTNET monitoring data with output from the Community Multiscale Air Quality (CMAQ) modeling system (Byun and Schere, 2006) to estimate dry deposition. The TDep method uses measured air concentration data from CASTNET when available and CMAQ output in areas where monitoring data are not available. CMAQ also provides modeled data for species that are not routinely measured. TDep and its recent updates are discussed on the TDep web page. See also the NADP Fact Sheet, “Hybrid Approach to Mapping Total Deposition,” .
For wet deposition, the TDep method combines precipitation amounts measured at NADP/NTN sites with a Parameter-elevation Regressions on Independent Slopes Model (PRISM) surface of precipitation data to develop a continuous grid of precipitation data. PRISM uses terrain elevation, slope, and aspect and climatic measurements to estimate precipitation amounts. Pollutant concentrations in precipitation are measured by NADP/NTN, extrapolated into a grid using an inverse distance weighting algorithm, and then multiplied by the combined precipitation grid to generate estimates of wet deposition. For 2021, dry and wet deposition rates were added to obtain estimates of total deposition of nitrogen, sulfur, base cations, and Cl - which are presented on the maps in this chapter as kilograms per hectare per year (kg ha -1 yr -1 ) unless otherwise noted. The magnitude of the deposition fluxes is illustrated by the shading in the figure legends.
Nitrogen Deposition
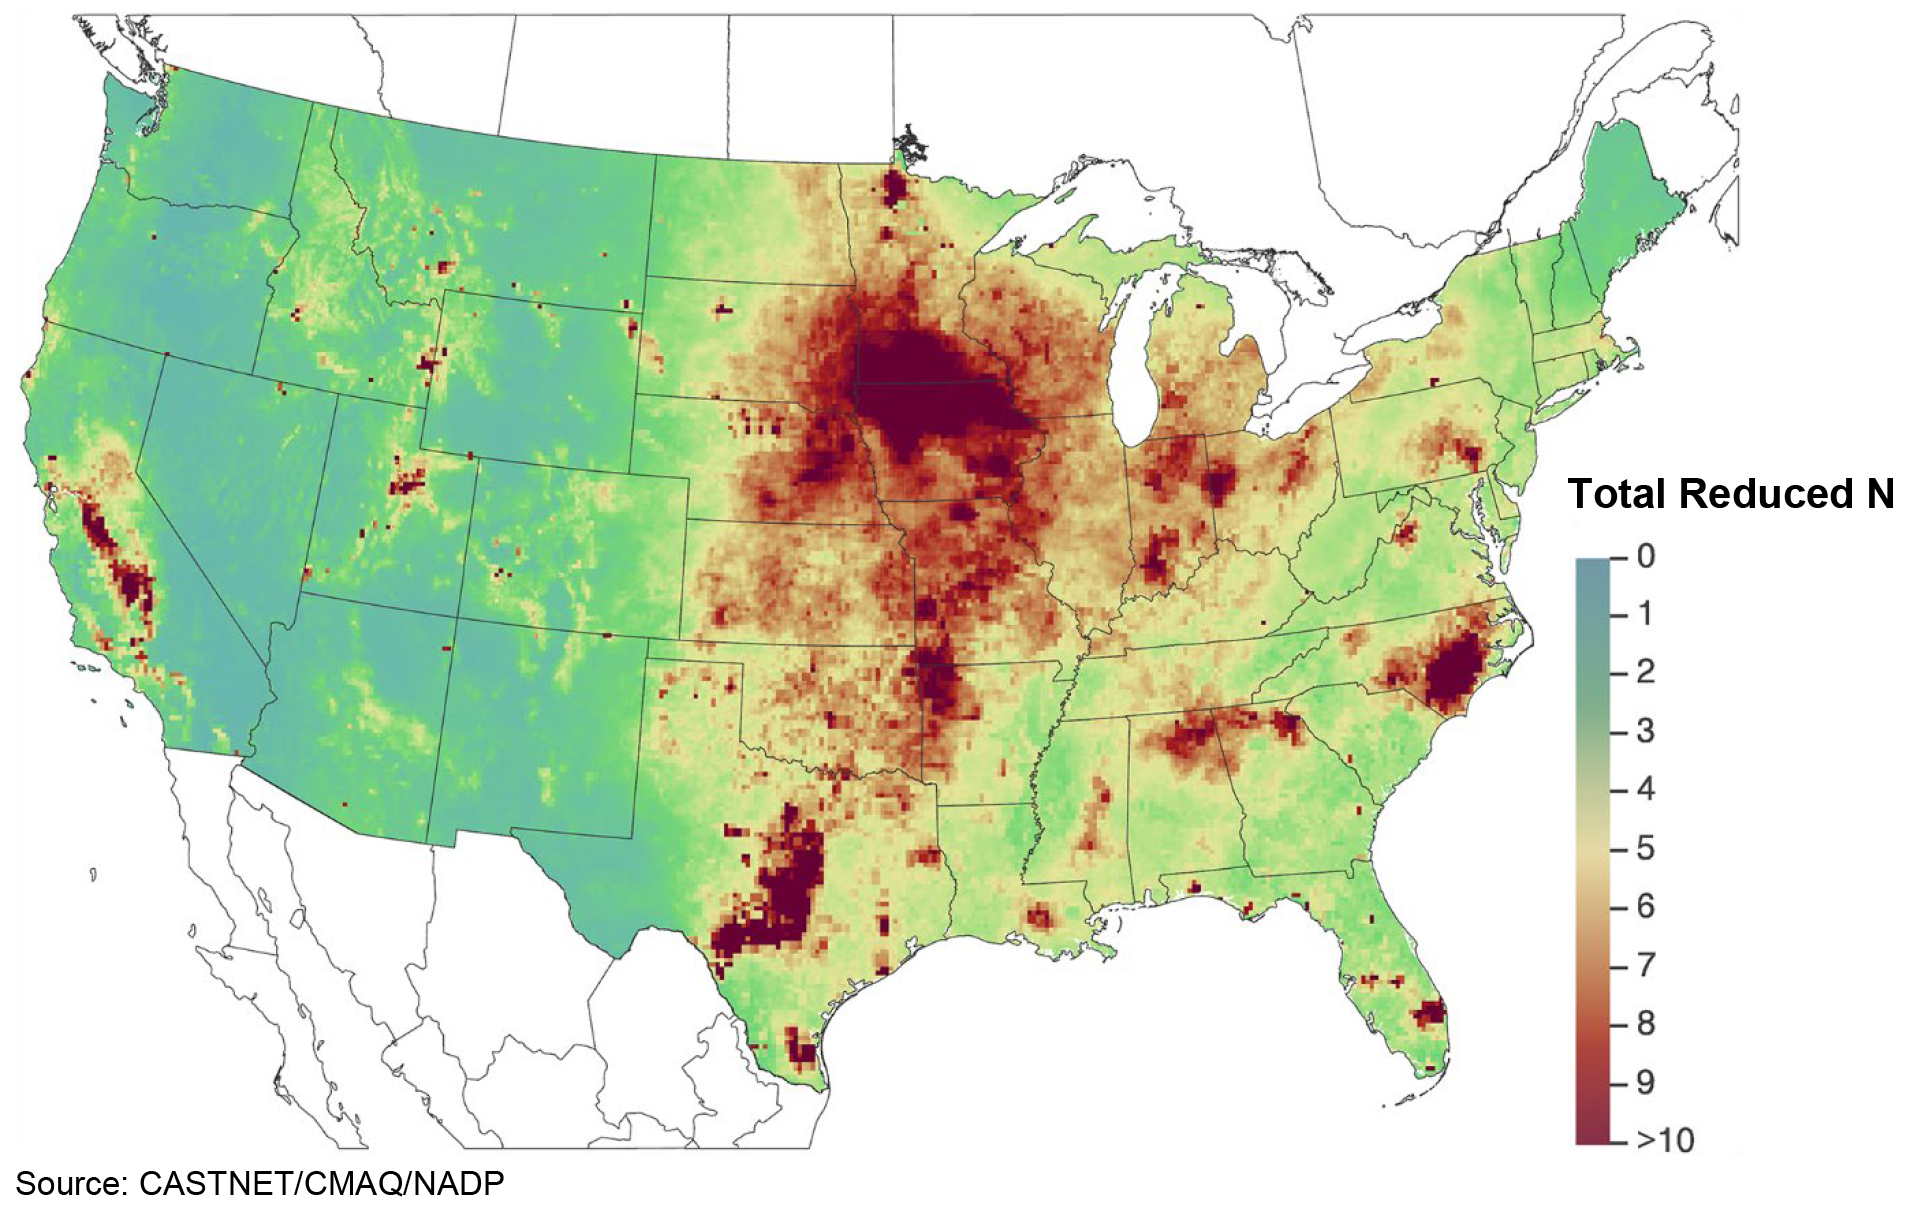
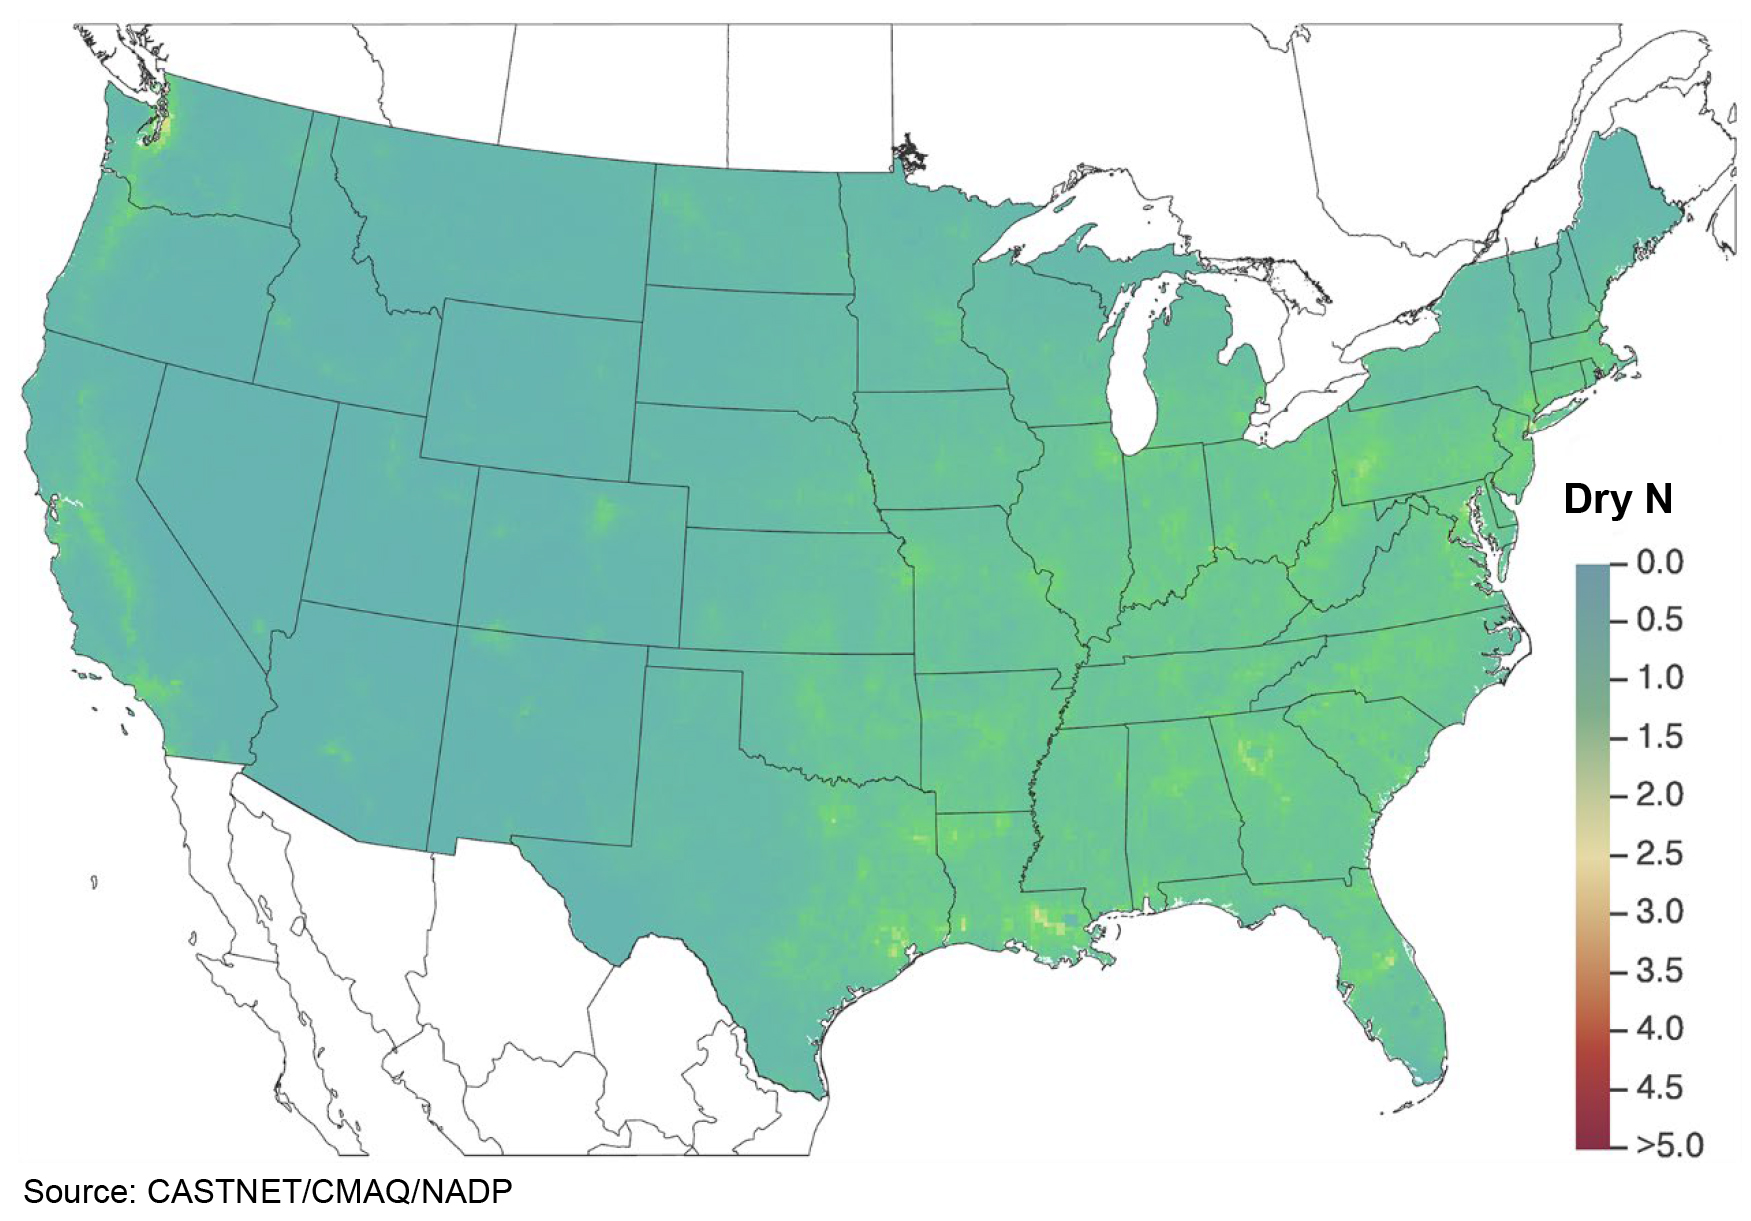
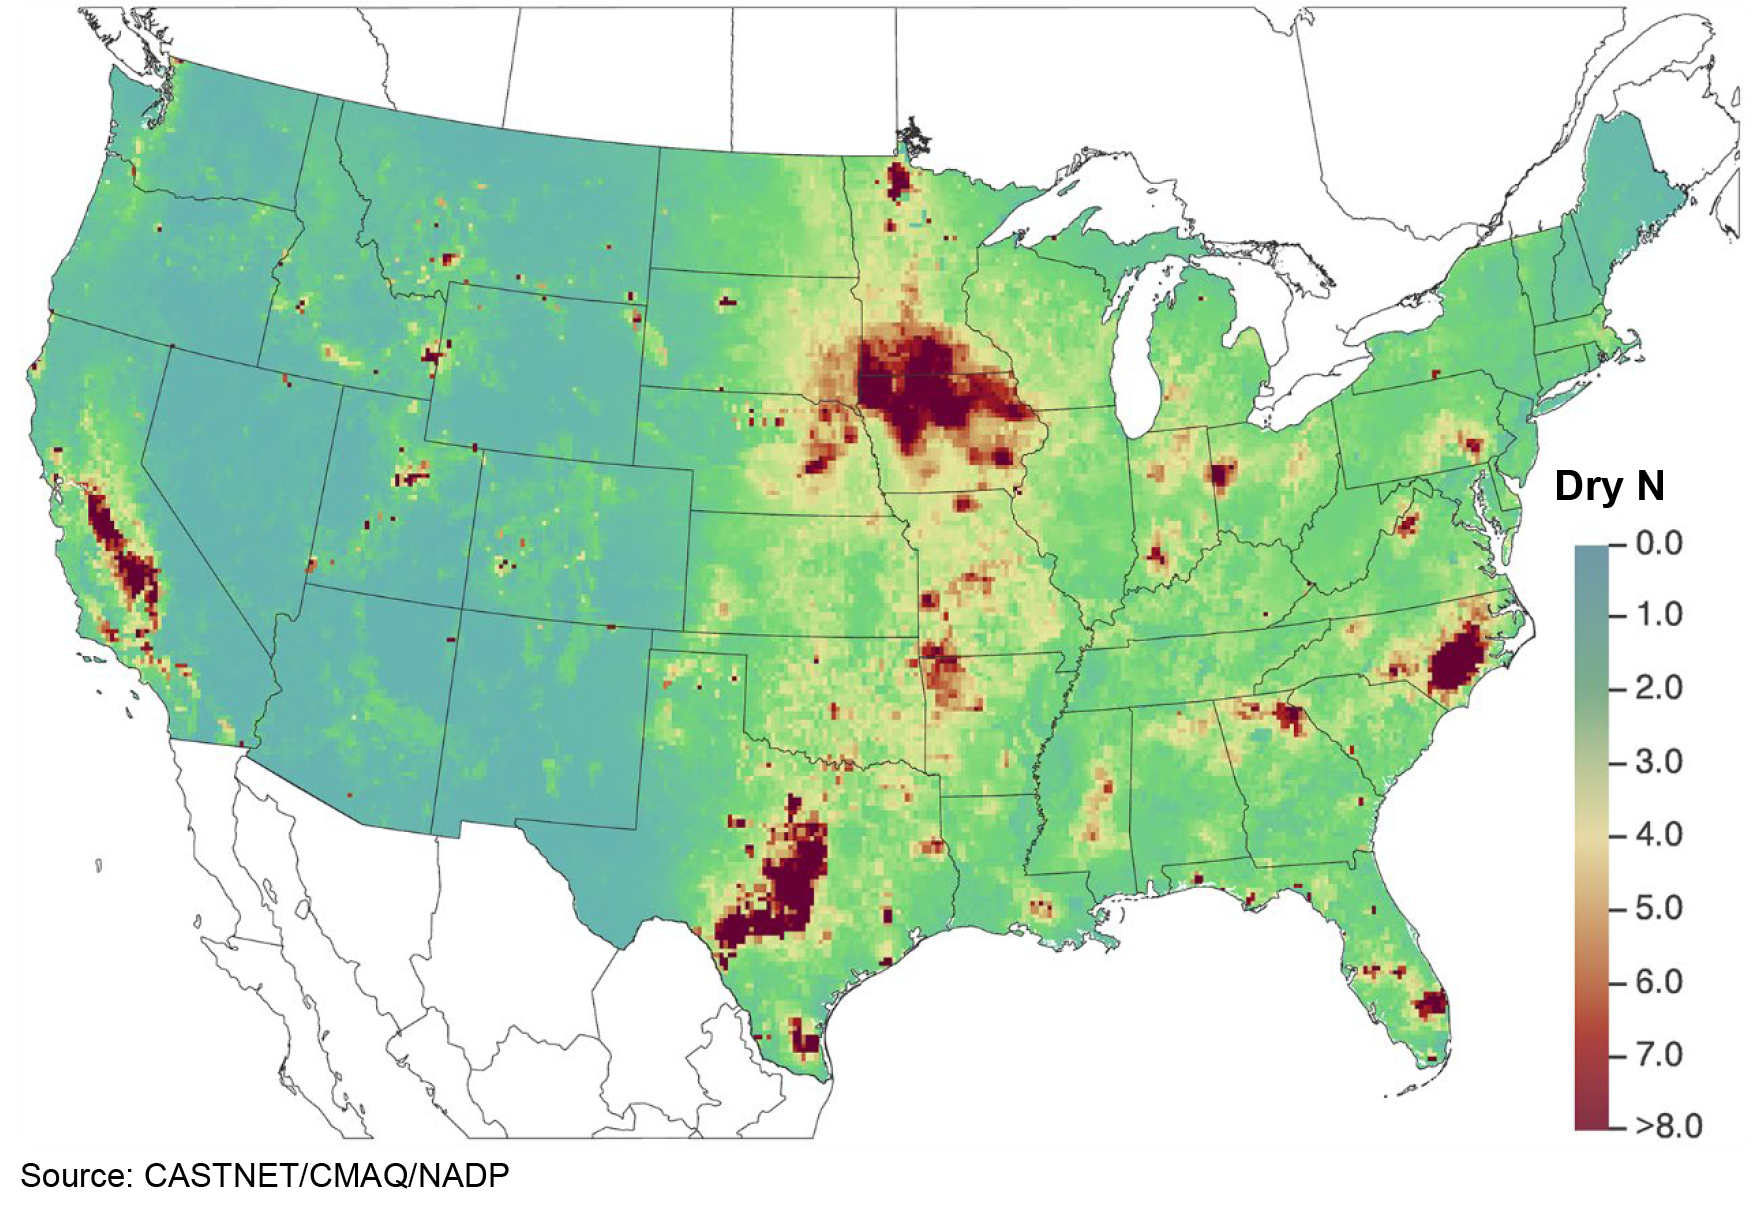
A map of the dry deposition fluxes of nitrogen (N) estimated for 2021 by the TDep method is shown in Figure 26. A map of total deposition of N estimated for 2021 is given in Figure 27. The percentage of total deposition of N due to dry deposition is shown in Figure 28. A map of TDep estimates of total deposition of reduced N species for 2021 is given in Figure 29. Figure 30 gives the percentage of total deposition of N from reduced N. Dry deposition of N species that are not routinely measured but are modeled by CMAQ and used by TDep is shown in the map in Figure 31, and its percentage of total deposition is shown in Figure 32. The map in Figure 33 shows estimates of annual gross dry deposition of NH3 as N for 2021
Sulfur Deposition
Figure 34 shows a map of TDep estimates of total deposition of sulfur (S) for 2021. The percentage of total deposition of S due to dry deposition is shown in Figure 35.
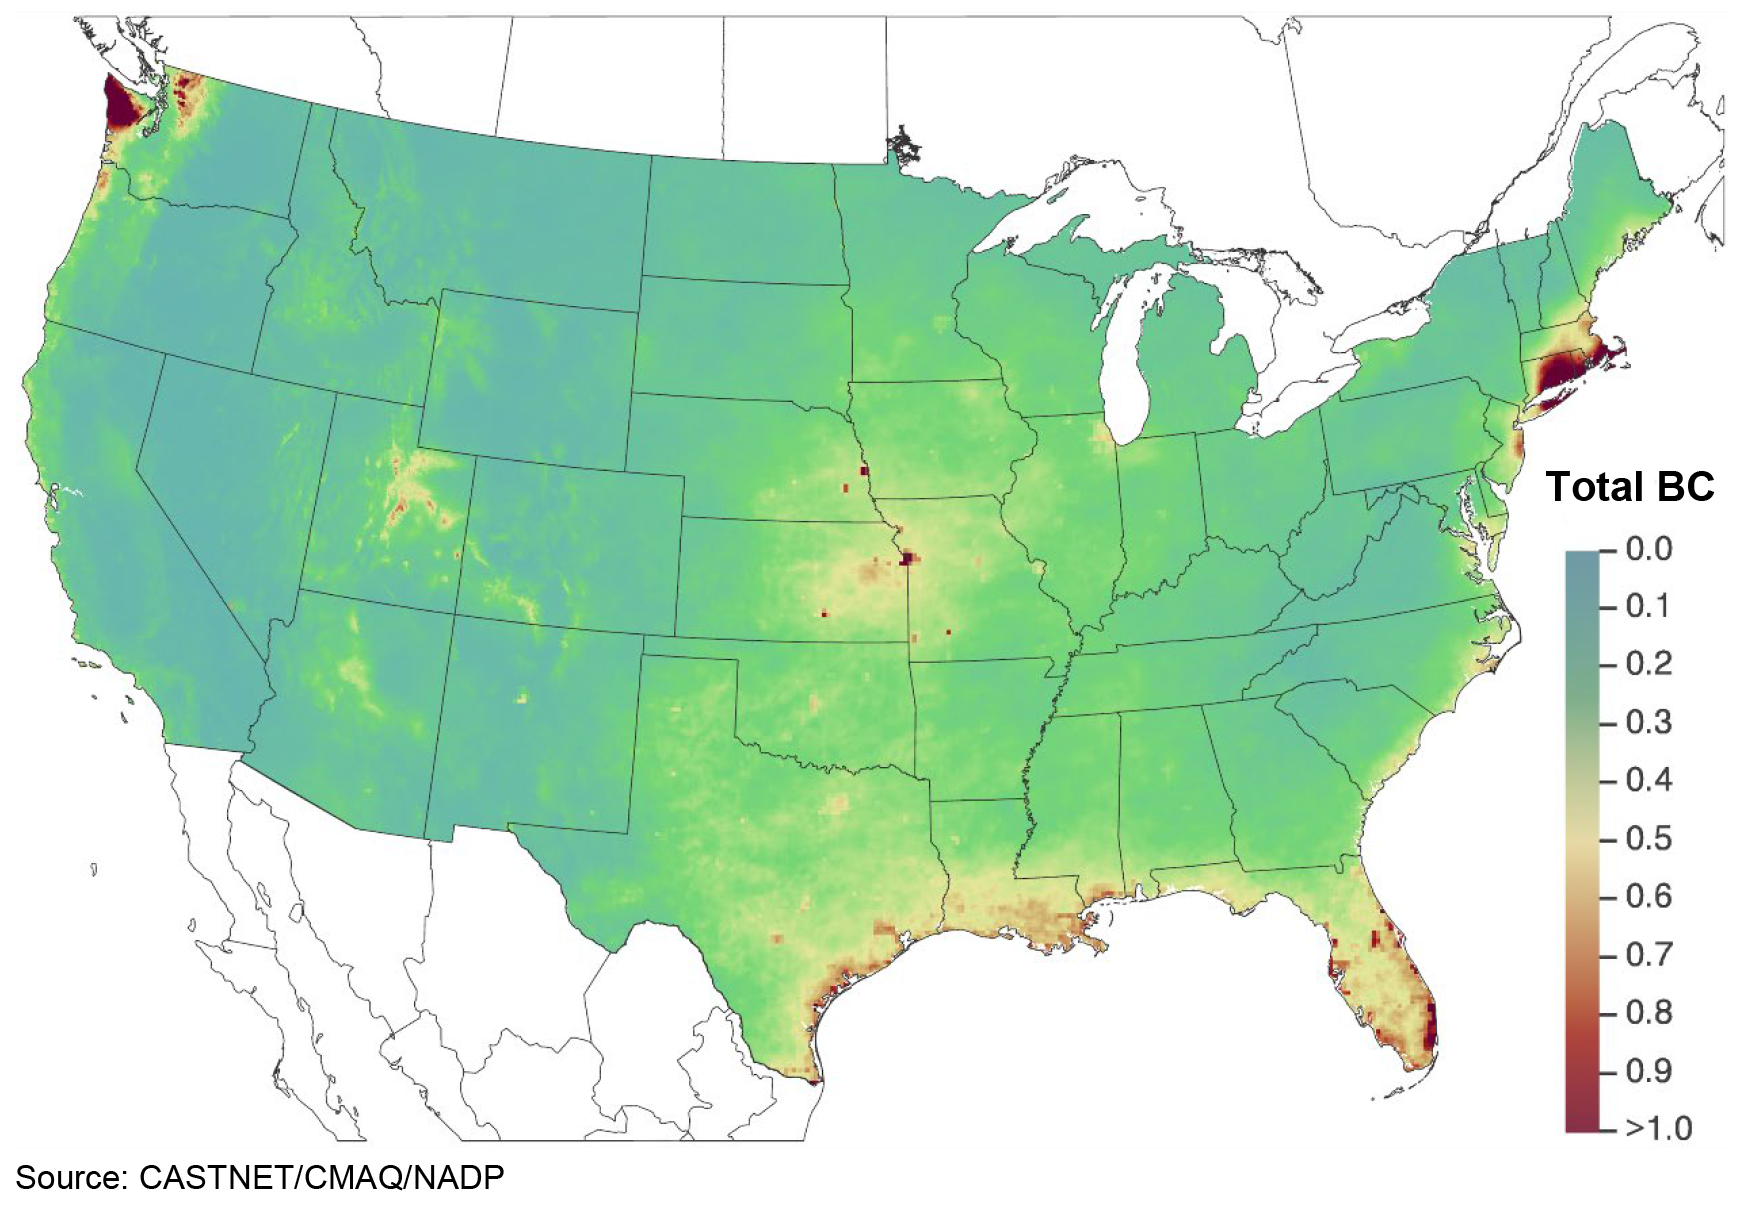
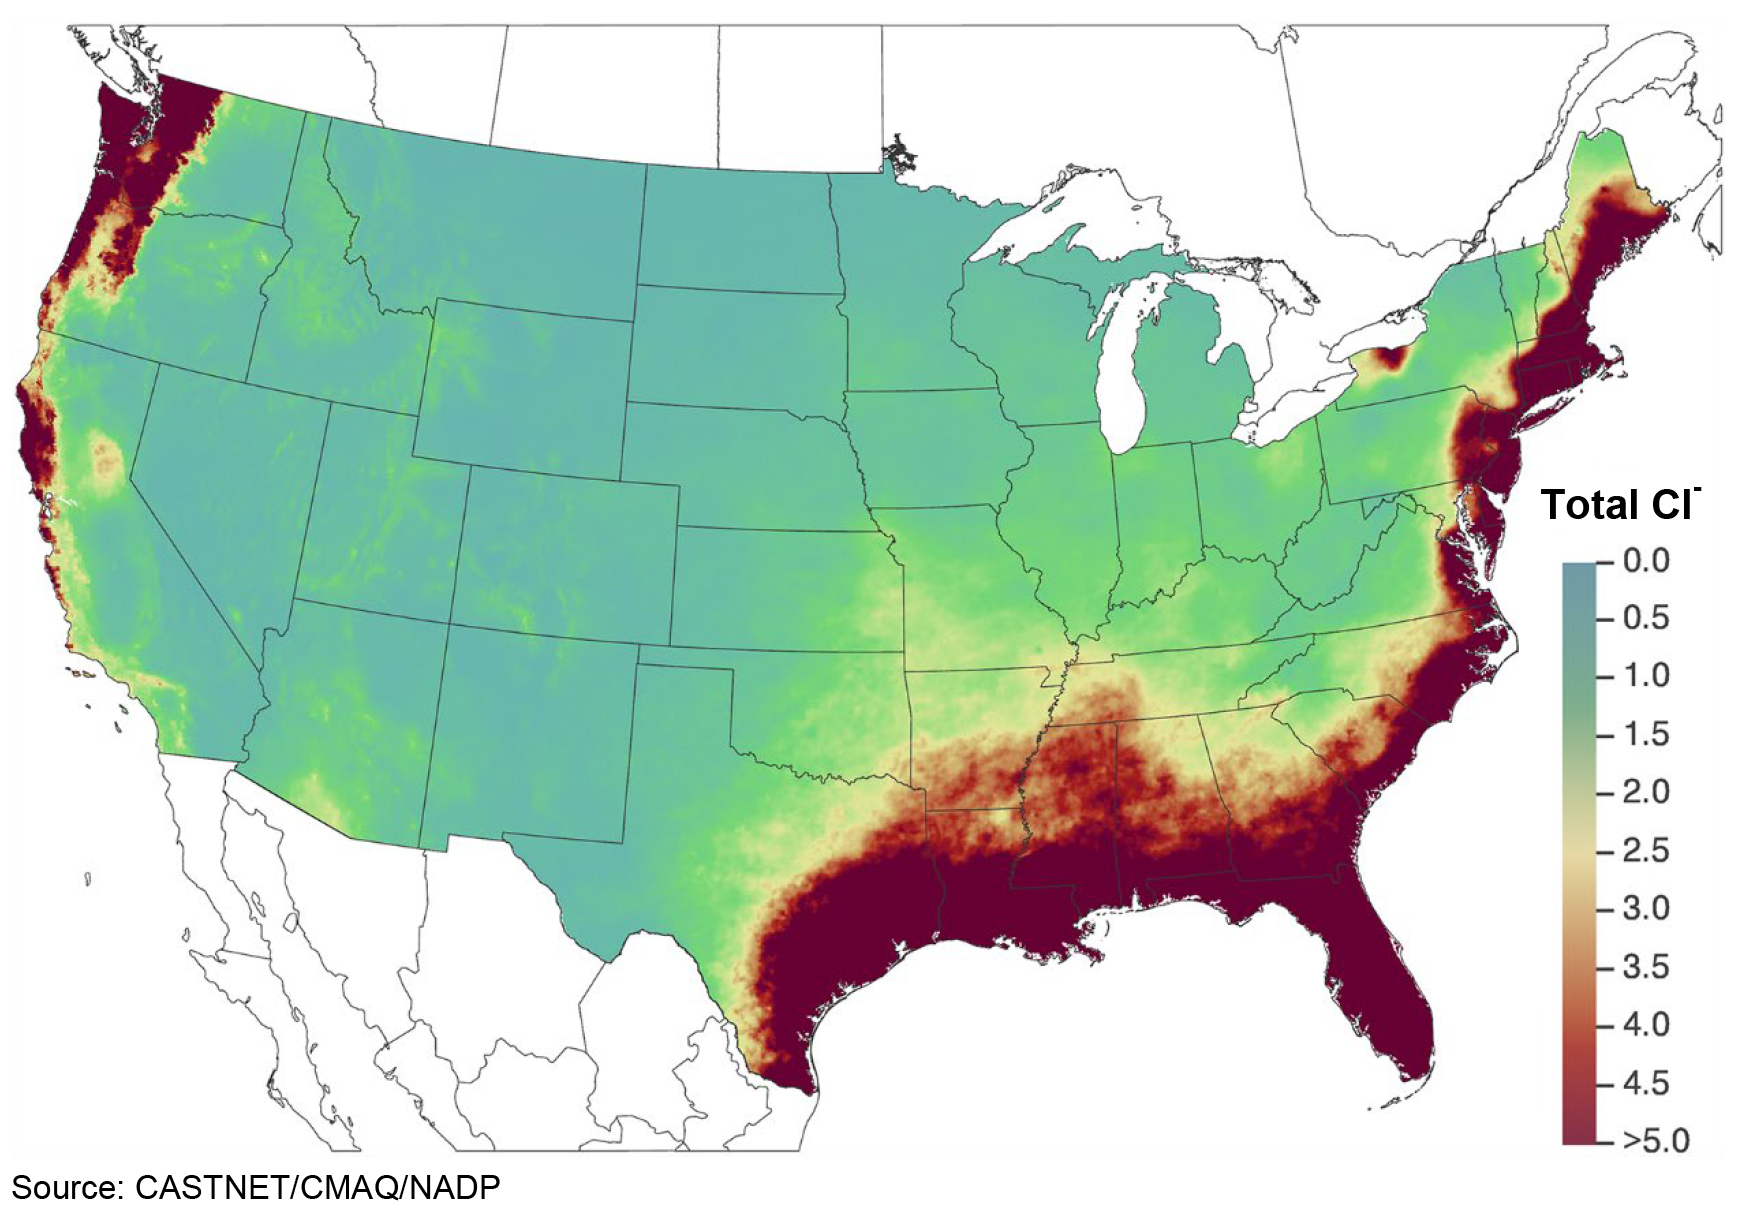
Deposition of Base Cations and Chloride
A map of 2021 estimated total deposition of the base cations Ca 2+ , K + , Mg 2+ , and Na + is provided in Figure 36. Figure 37 provides 2021 estimated rates of deposition of total Cl -.
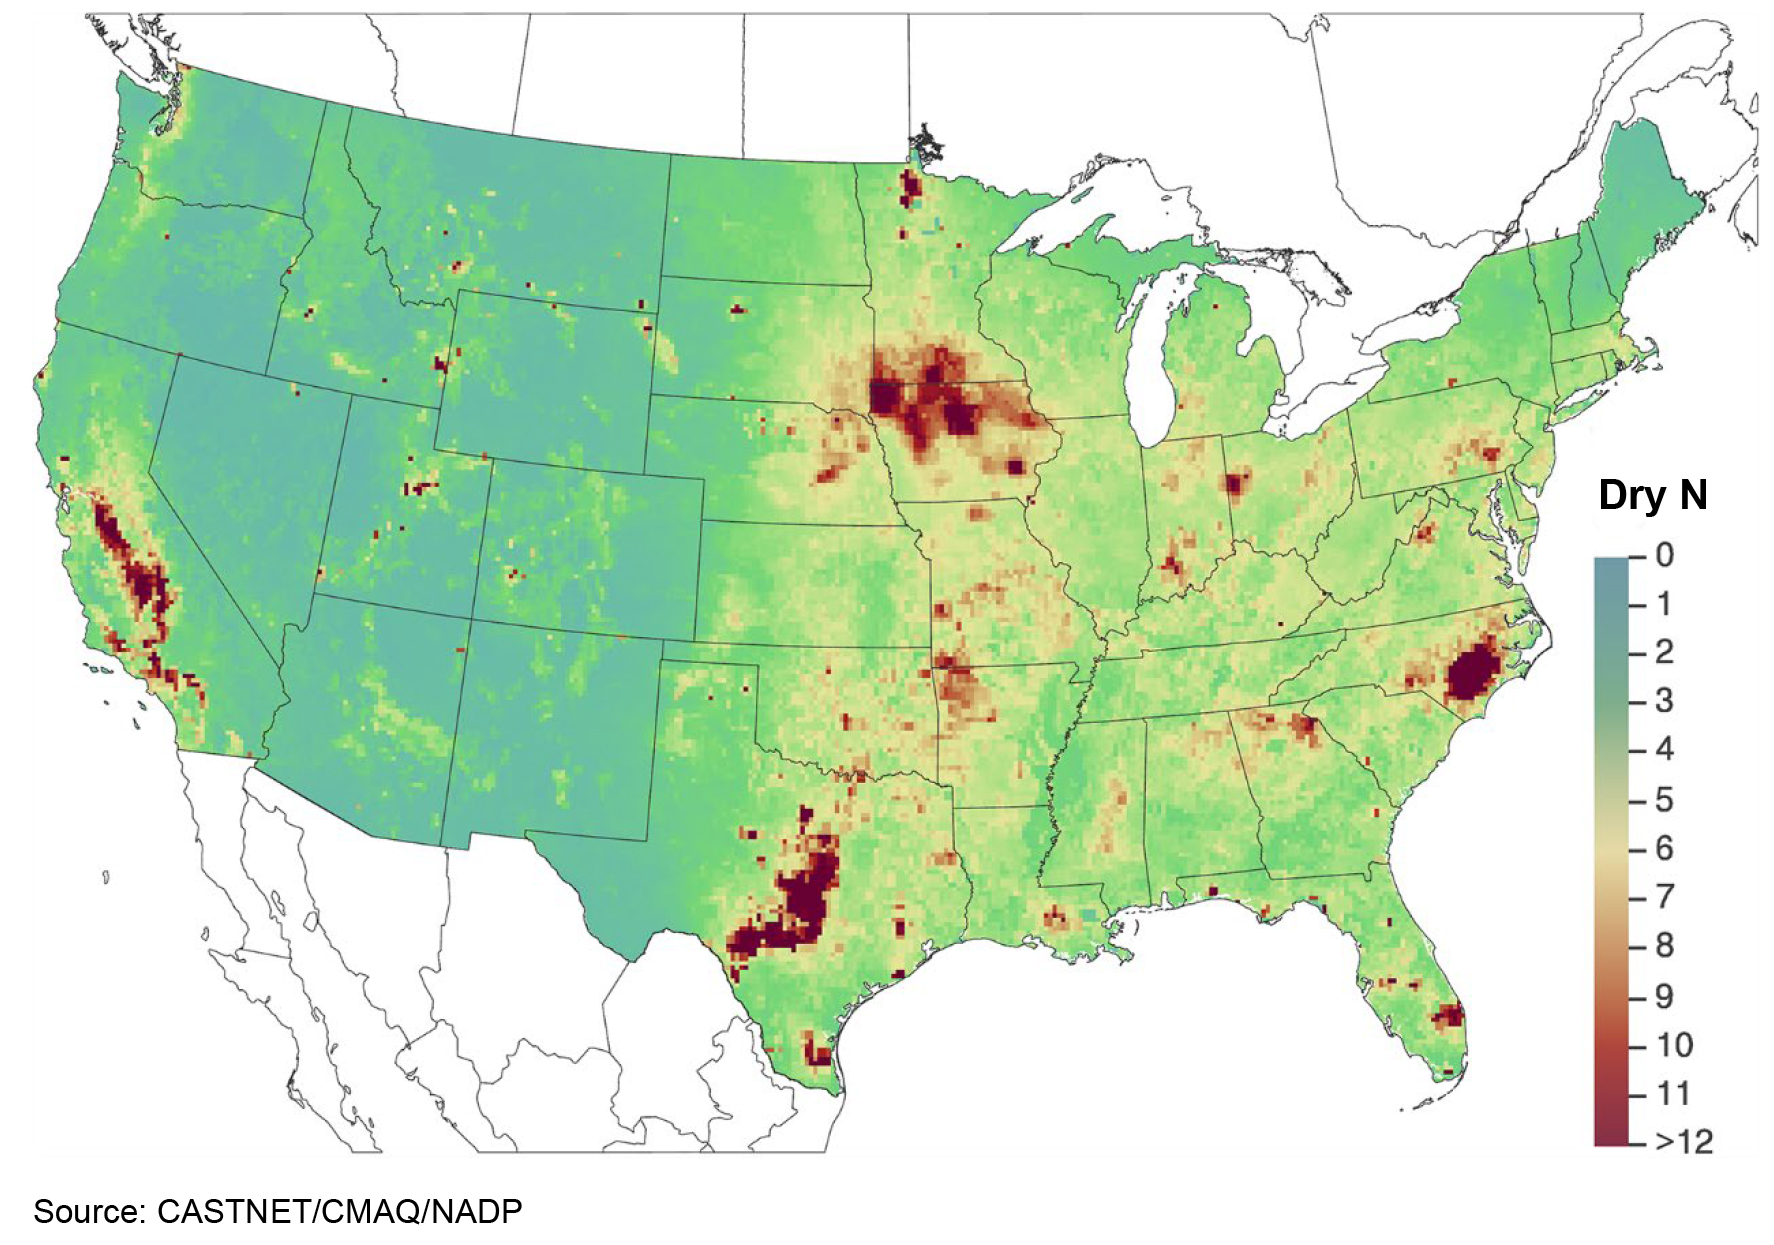
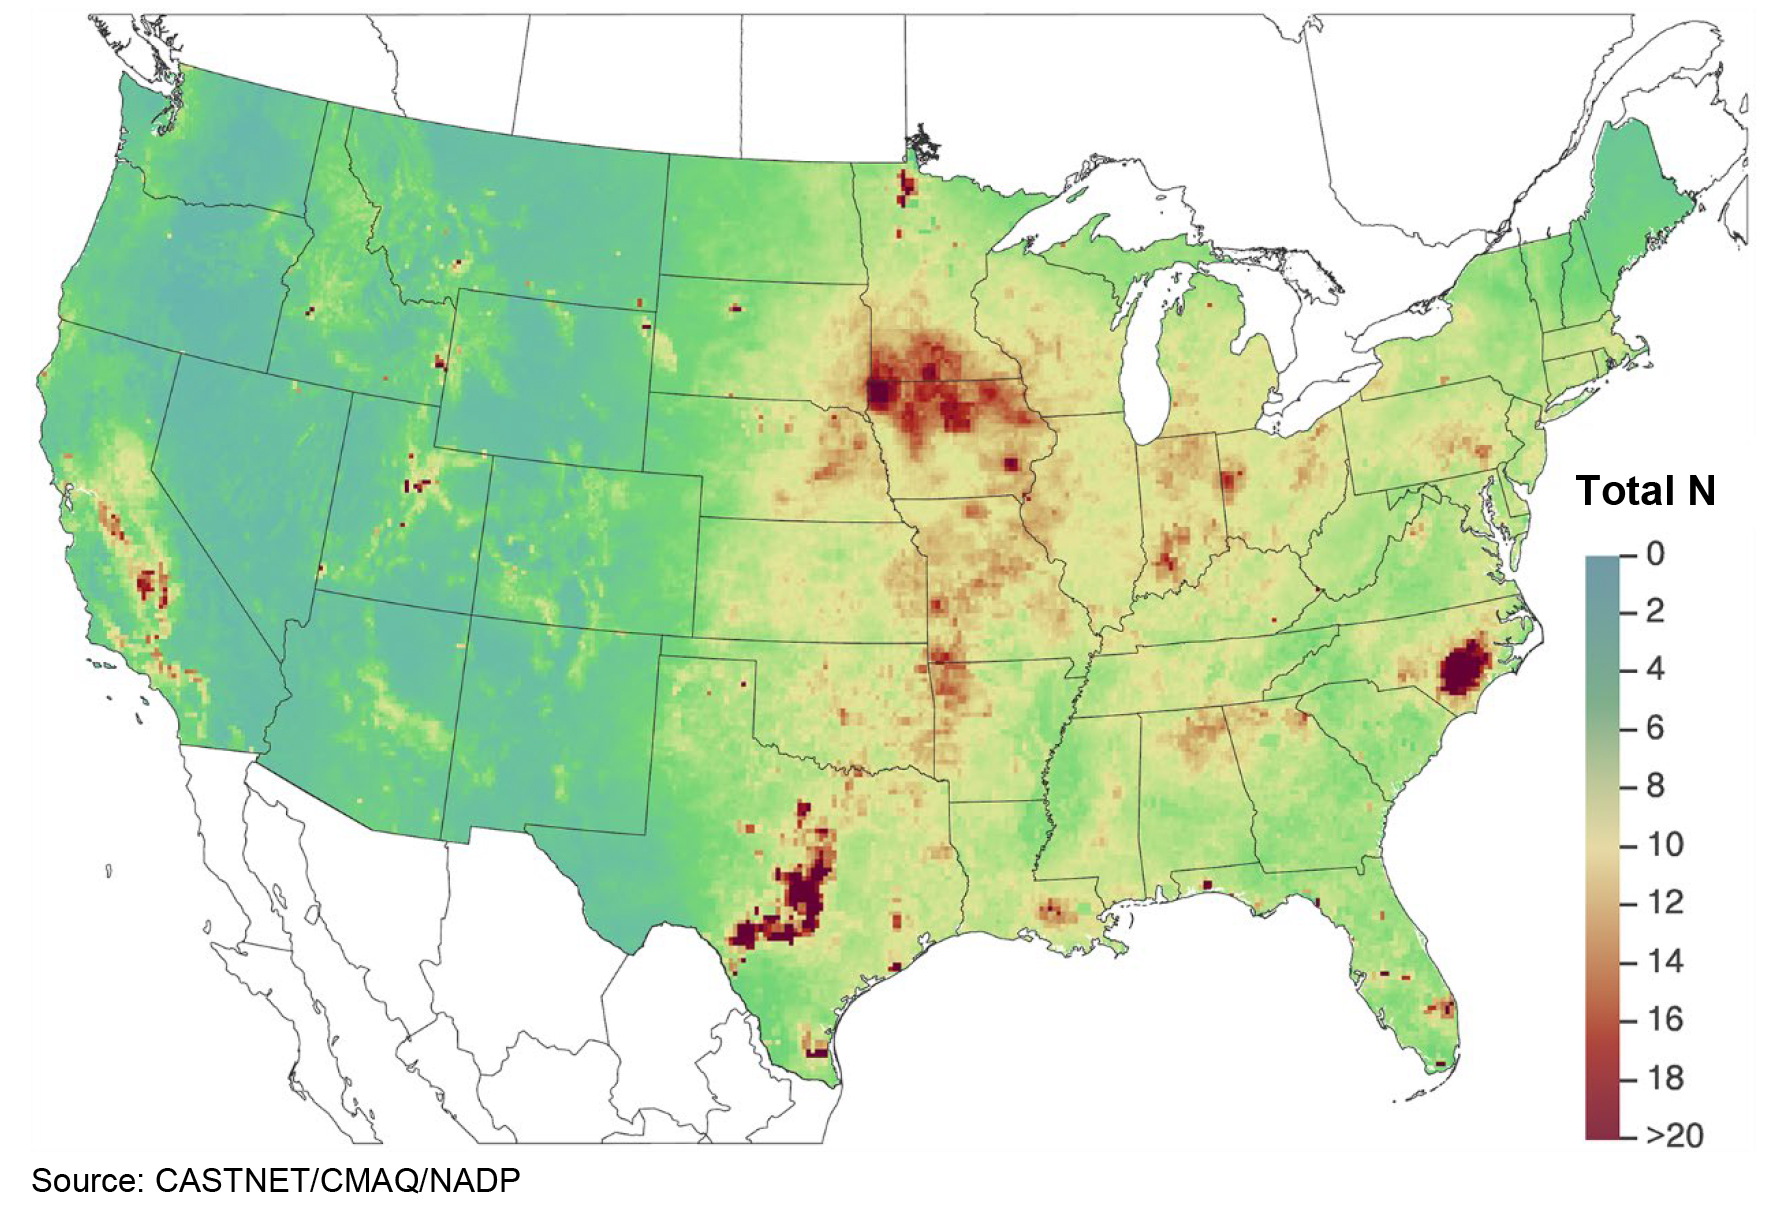
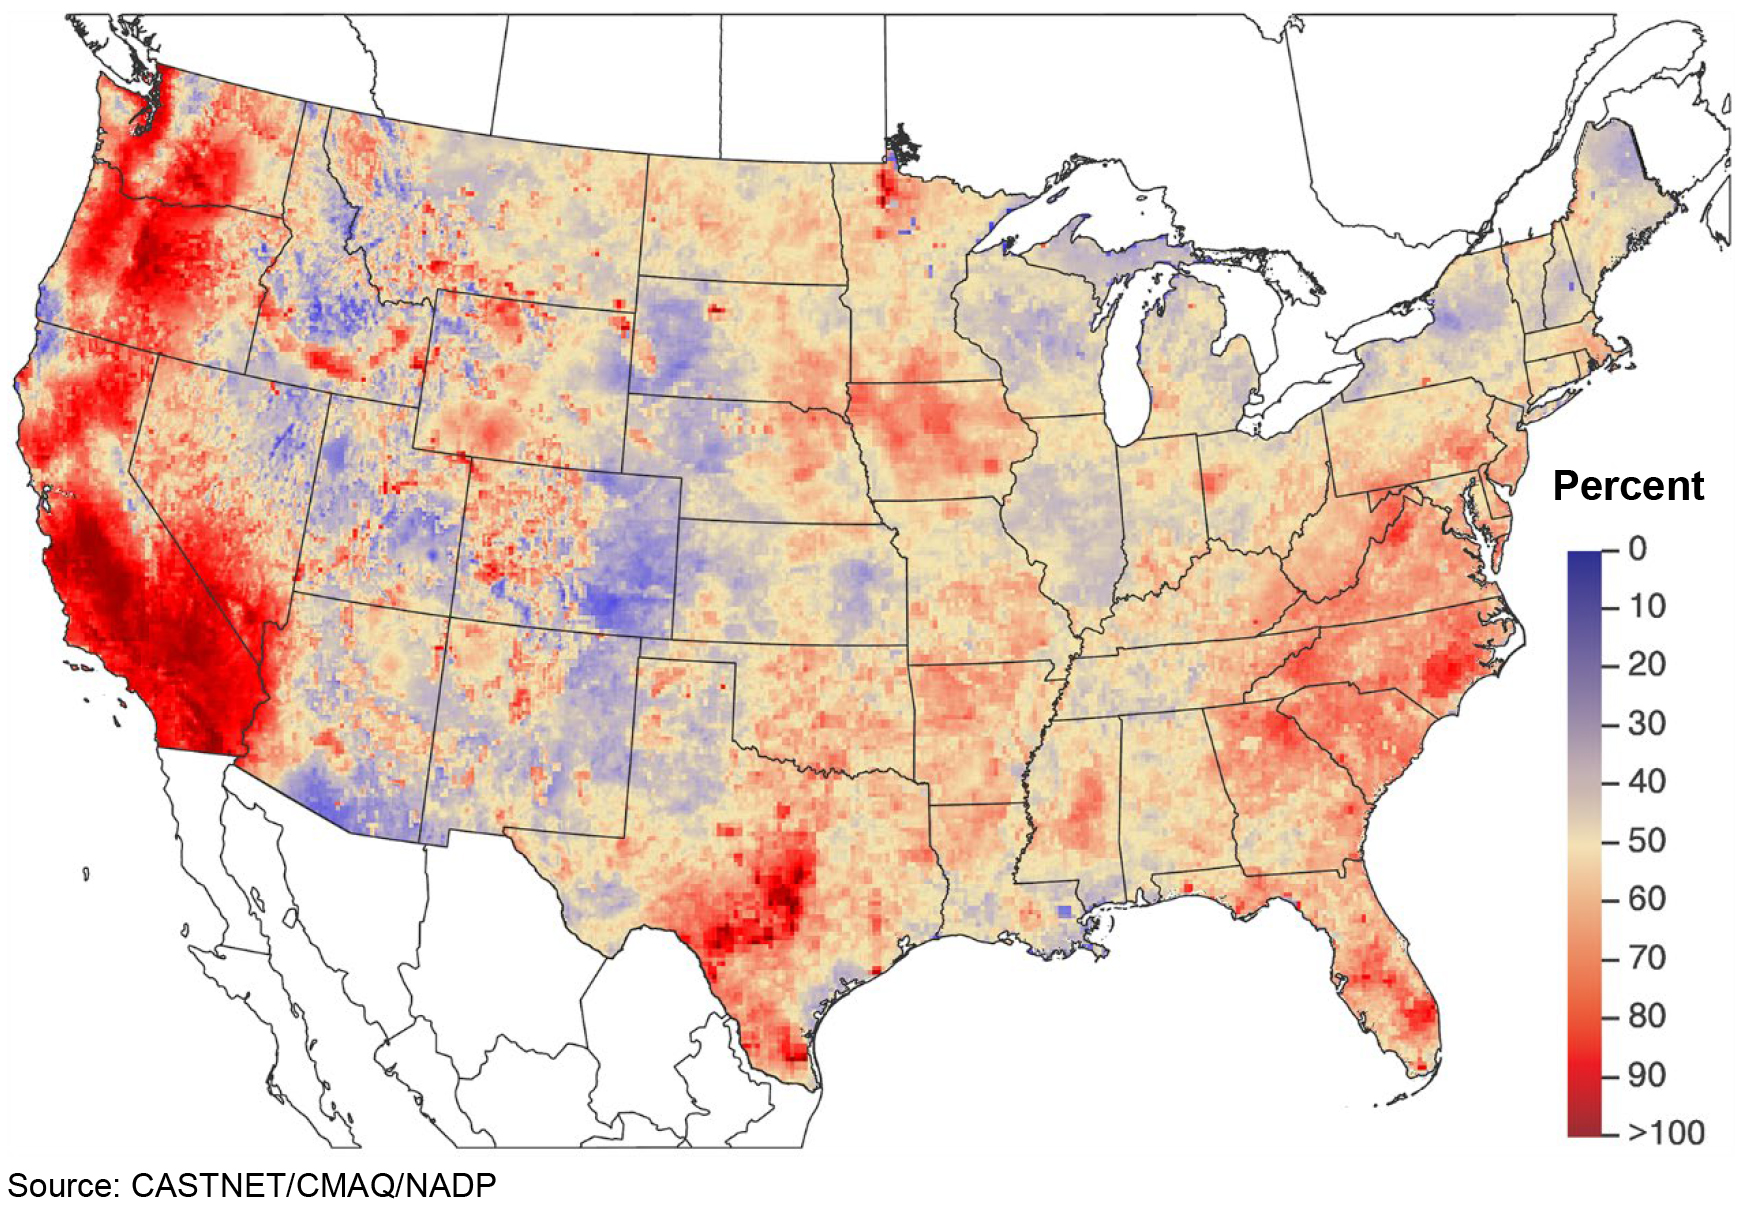
Figure 29 TDep Total Deposition Estimates of Reduced N Species (kg ha -1 yr -1 ) for 2021
 Download Figure
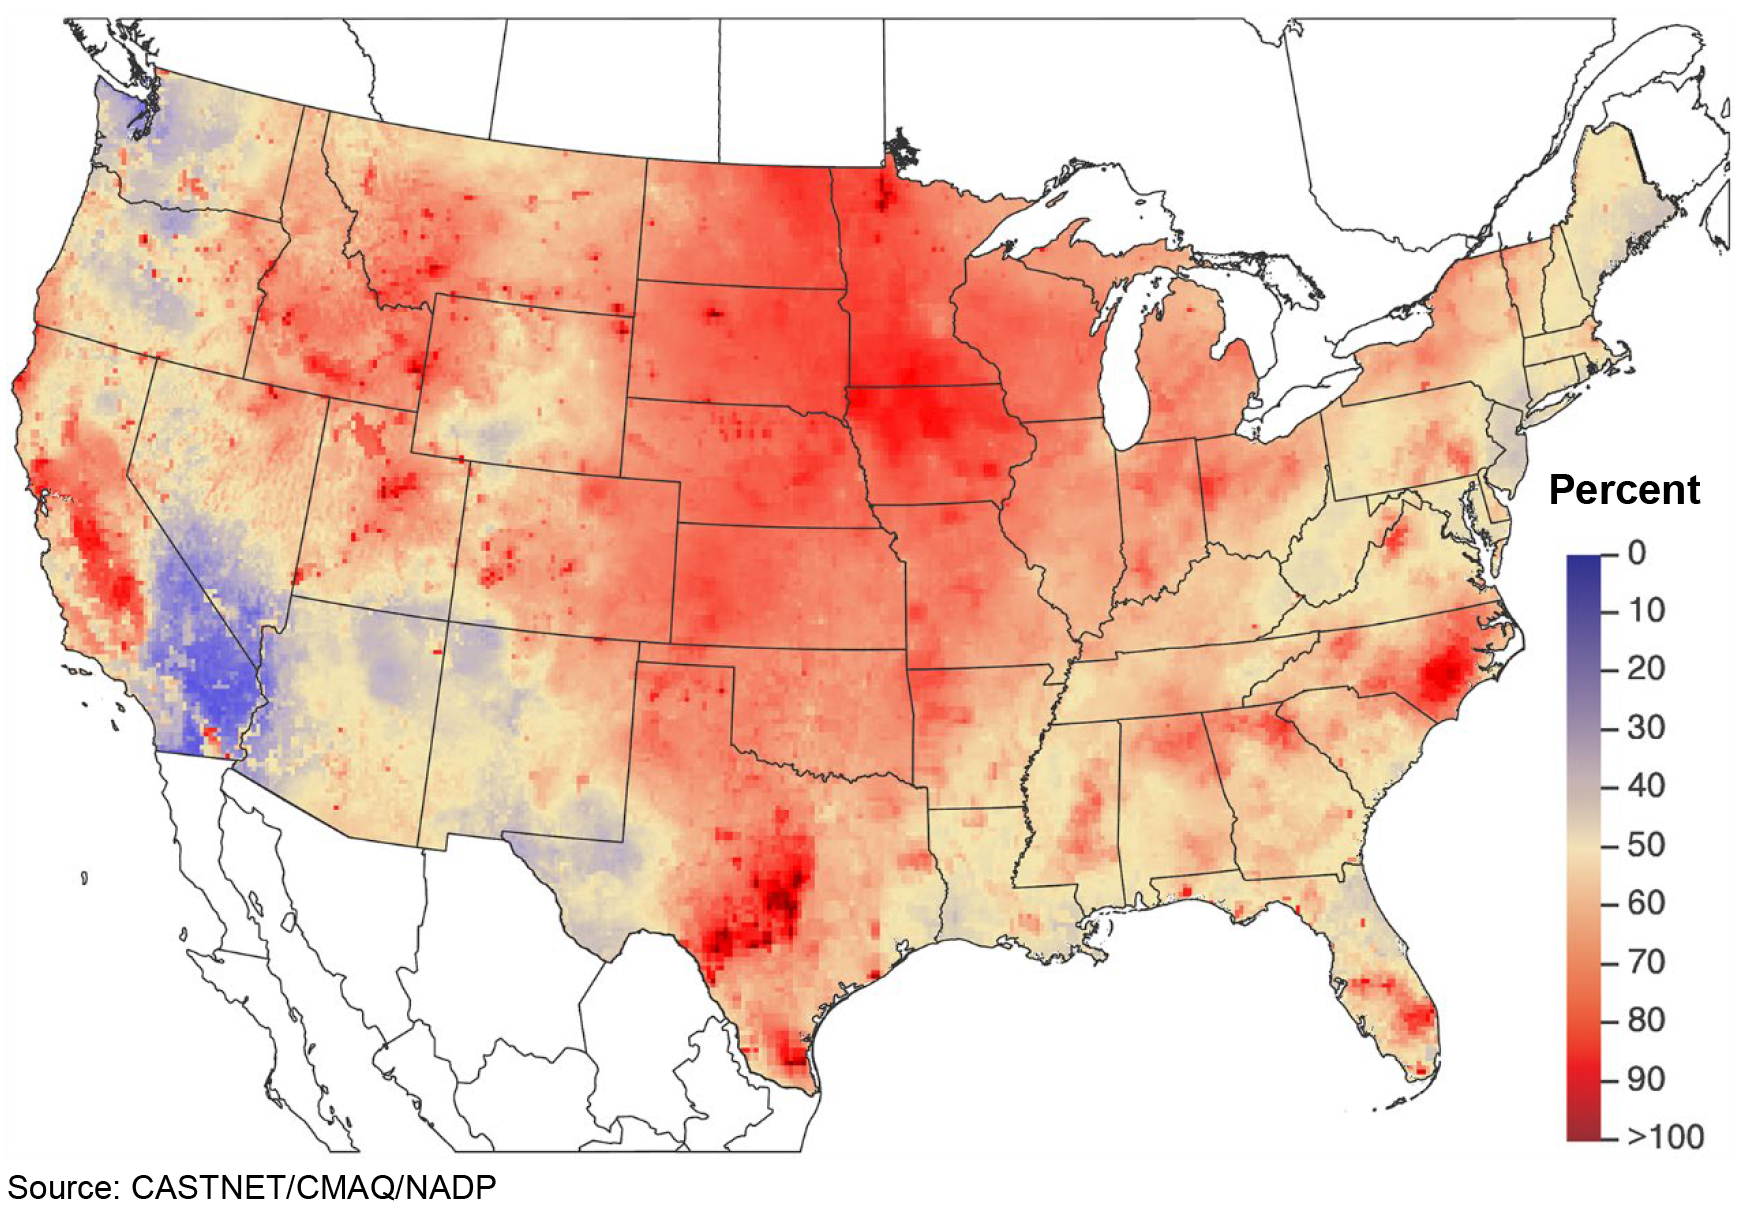
Figure 31 TDep Dry Deposition Estimates of Unmonitored N Species (kg ha -1 yr -1 ) for 2021
 Download Figure
Figure 32 TDep Percent of Total Deposition of N from Dry Deposition of Unmonitored Species for 2021
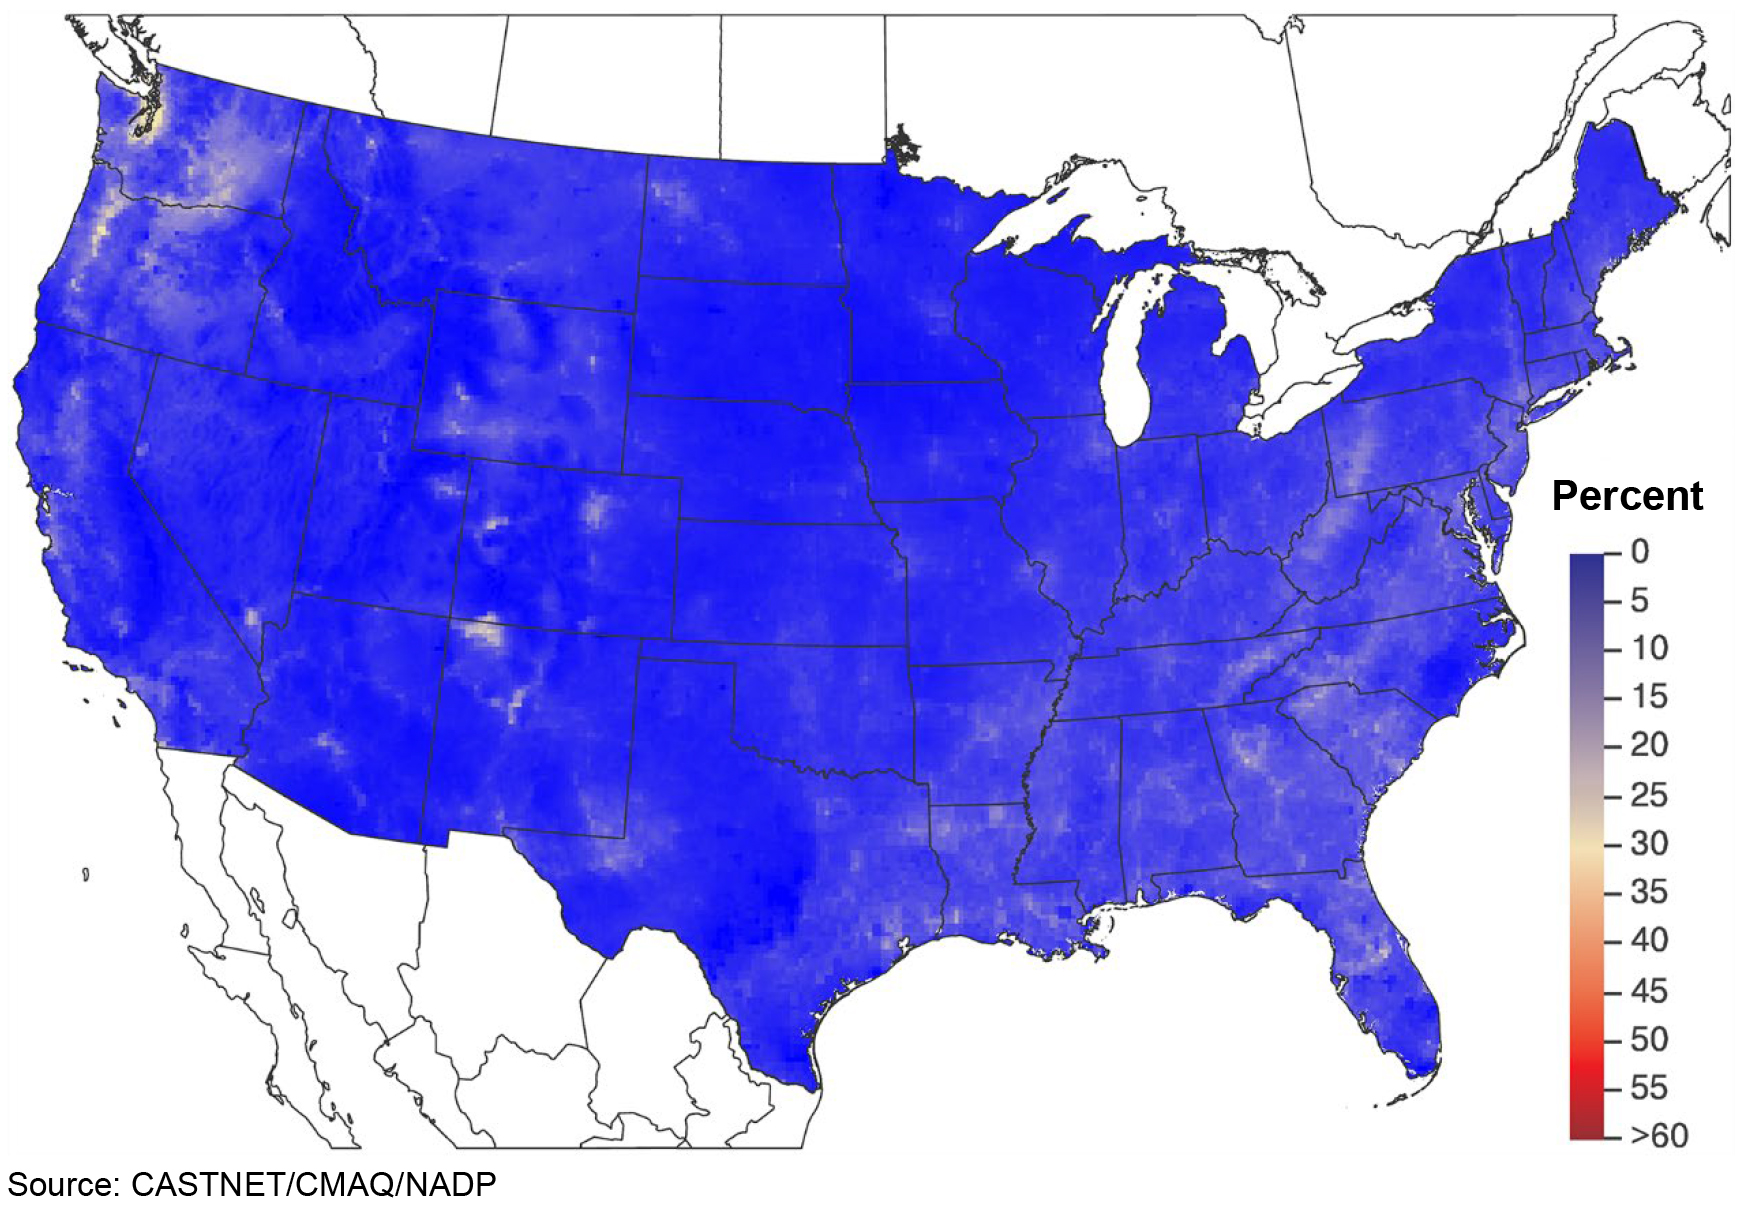 Download Figure
Figure 33 TDep Gross Dry Deposition Estimates of NH3 as N (kg ha -1 yr -1 ) for 2021
 Download Figure
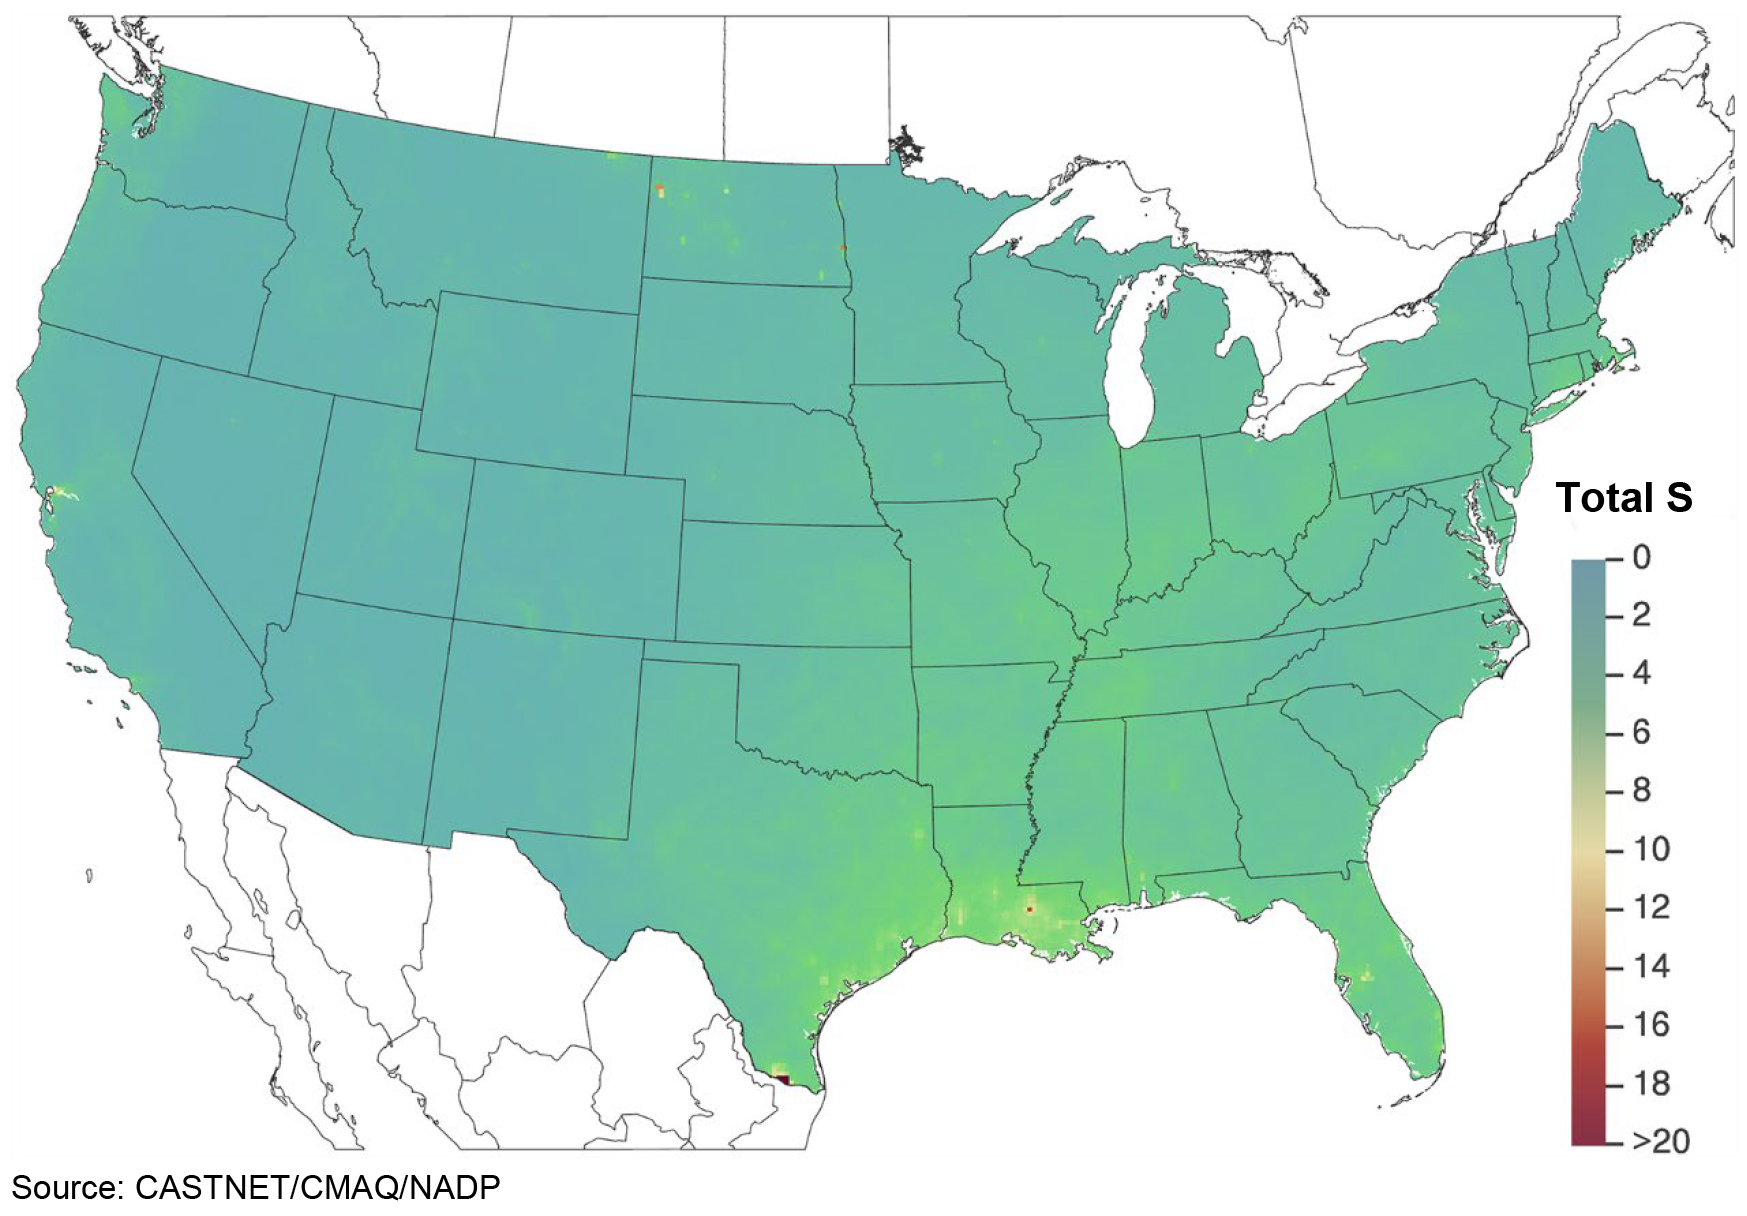
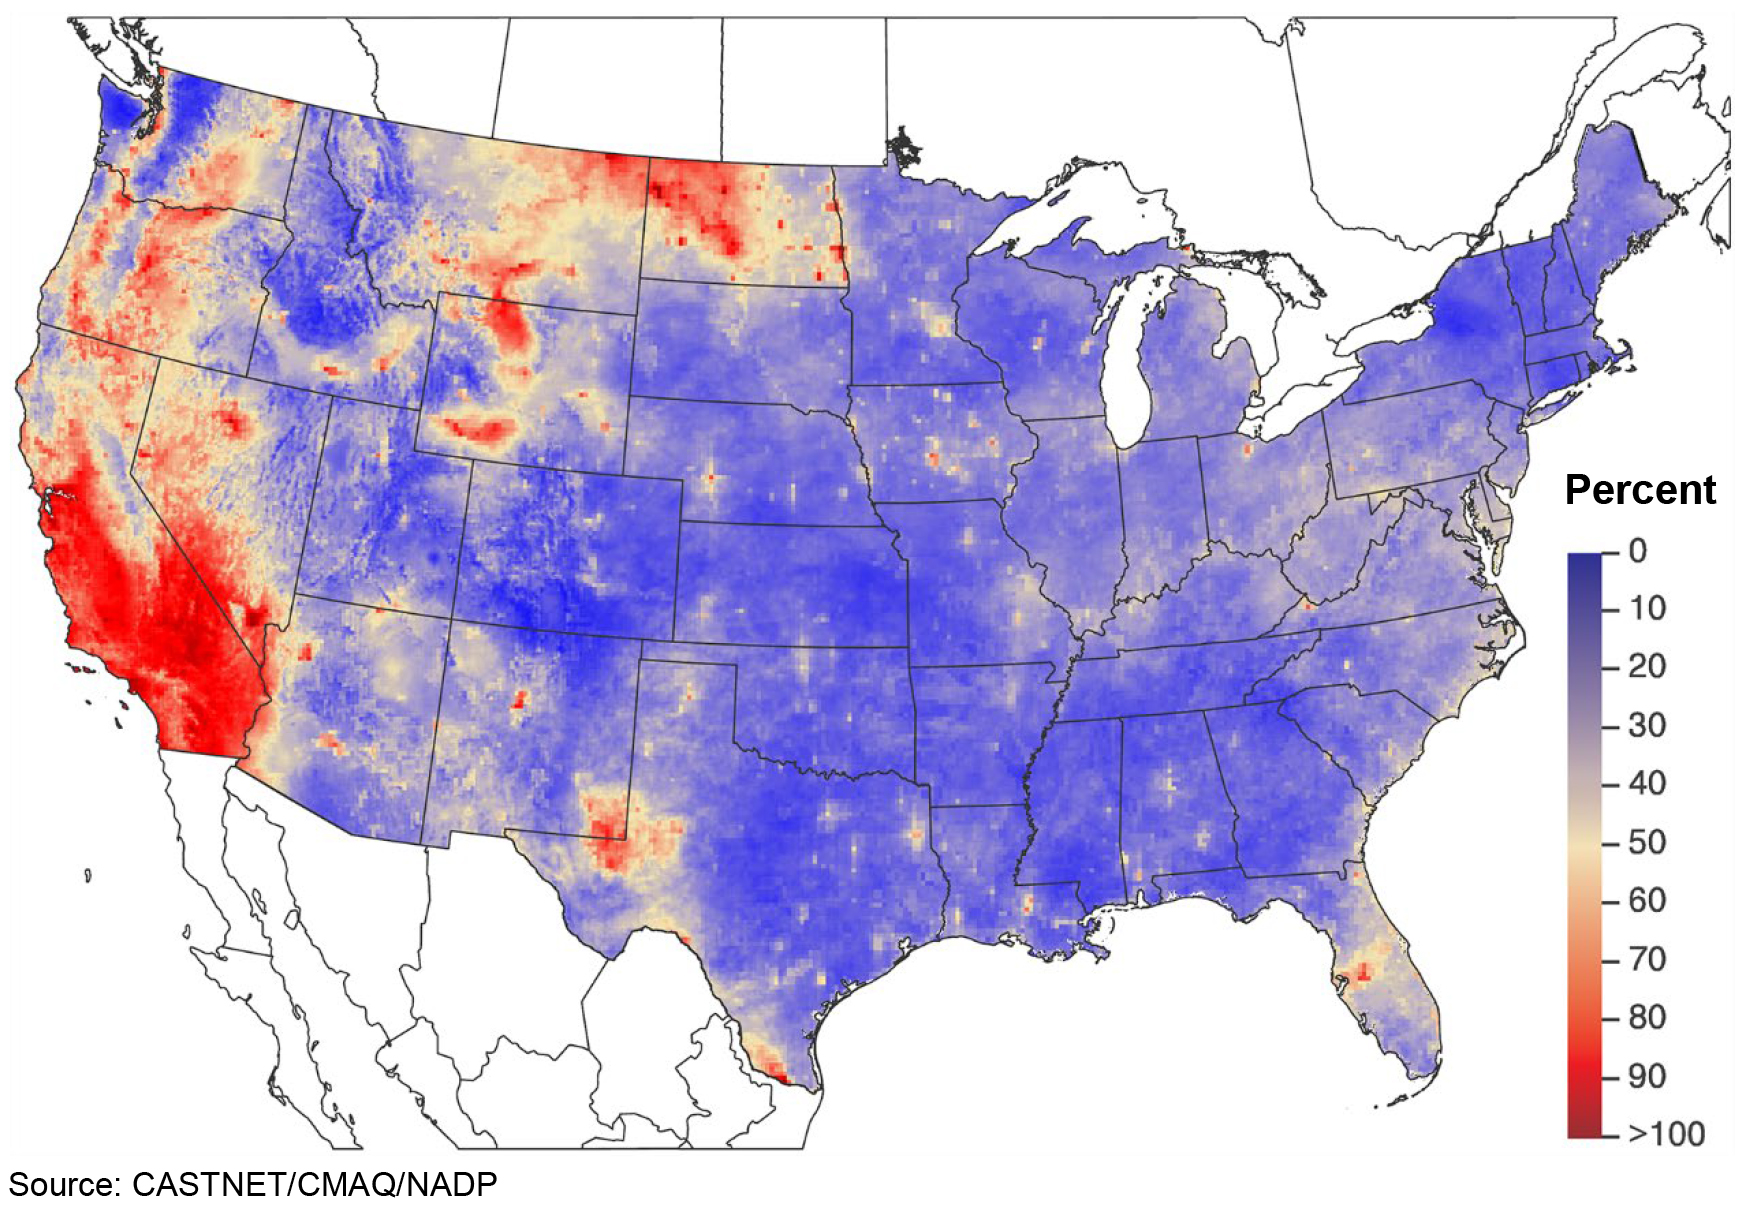
Figure 36 TDep Total Deposition Estimates of the Base Cations Ca 2+, K + , Mg 2+, and Na + (kiloequivalents per hectare per year) for 2021
 Download Figure
References
Byun, D. and Schere, K. L. 2006. Review of the Governing Equations, Computational Algorithms, and Other Components of the Models‐3 Community Multiscale Air Quality (CMAQ) Modeling System. Applied Mechanics Reviews, 59: 51‐77. doi:10.1115/1.2128636.
Harshfield, G. 2019. Memo to Ozone Data Managers with 2018 Colorado ozone NPS exceptional event letter PDF attachment.
McNamara, D., Stephens, G., Ruminski, M., and Kasheta, T. 2004. The Hazard Mapping System (HMS) – NOAA’S Multi-sensor Fire and Smoke Detection Program Using Environmental Satellites. Conference on Satellite Meteorology and Oceanography.
National Oceanic and Atmospheric Administration (NOAA). 2019. Office of Satellite and Product Operations Hazard Mapping System. Accessed August 1, 2022. https://www.ospo.noaa.gov/Products/land/hms.html#about.
Schwede, D. B. and Lear, G. G. 2014. A Novel Hybrid Approach for Estimating Total Deposition in the United States. Atmospheric Environment, 92:207-220. doi:10.1016/j.atmosenv.2014.04.008.
Simoneit, B. R. 2002. Biomass Burning–A Review of Organic Tracers for Smoke from Incomplete Combustion. Applied Geochemistry, 17(3), 129-162. ISSN 0883-2927. https://doi.org/10.1016/S0883-2927(01)00061-0.
Simoneit, B. R., Schauer, J. J., Nolte, C. G., Oros, D. R., Elias, V. O., Fraser, M. P., and Cass, G. R. 1999. Levoglucosan, a Tracer for Cellulose in Biomass Burning and Atmospheric Particles. Atmos. Environ., 33(2), 173-182. ISSN 1352-2310, https://doi.org/10.1016/S1352-2310(98)00145-9.
Sullivan, A. P., Frank, N., Onstad, G., Simpson, C. D., and Collett Jr, J. L. 2011a. Application of High‐ Performance Anion‐exchange Chromatography–Pulsed Amperometric Detection for Measuring Carbohydrates in Routine Daily Filter Samples Collected by a National Network: 1. Determination of the Impact of Biomass Burning in the Upper Midwest. J. Geophys. Res., 116, D08302. https://doi.org/10.1029/2010JD014166.
Sullivan, A. P., Frank, N., Kenski, D. M., & Collett Jr, J. L. 2011b. Application of High‐performance Anion‐exchange Chromatography–Pulsed Amperometric Detection for Measuring Carbohydrates in Routine Daily Filter Samples Collected by a National Network: 2. Examination of Sugar Alcohols/Polyols, Sugars, and Anhydrosugars in the Upper Midwest. J. Geophys. Res., 116, D08303. https://doi.org/10.1029/2010JD014169.
WSP USA Environment & Infrastructure Inc. (WSP) formerly known as Wood Environment & Infrastructure Solutions, Inc. (Wood). 2021. Clean Air Status and Trends Network (CASTNET) Quality Assurance Project Plan (QAPP) Revision 9.4. Prepared for U.S. Environmental Protection Agency (EPA), Office of Air and Radiation, Clean Air Markets Division, Washington, DC. Contract No. 68HERH21D0006. Gainesville, FL. https://www.epa.gov/castnet/documents-reports.
WSP USA Environment & Infrastructure Inc. (WSP) formerly known as Wood Environment & Infrastructure Solutions, Inc. (Wood). 2020. Clean Air Status and Trends Network (CASTNET) Quality Assurance Project Plan (QAPP) Revision 9.3. Prepared for U.S. Environmental Protection Agency (EPA), Office of Air and Radiation, Clean Air Markets Division, Washington, DC. Contract No. EP-W-09-028. Gainesville, FL. https://www.epa.gov/castnet/documents-reports