Assessing Outdoor Air Near Schools
Felton Elementary School - Los Angeles, CA
Results and Analysis of EPA’s monitoring
EPA selected this school for monitoring because it is located near multiple airports and is surrounded by two interstate highway and other roadways sources, which are sources of air toxics emissions. Computer models were used to determine which air toxics may be present at elevated levels in the outdoor air near the school. These models showed that lead and naphthalene could be present in the air around the school and prompted EPA to test to see if the levels present may be of concern. Mobile source pollutants, such as acrolein, 1,3-butadiene, and benzene, were also monitored, as this school is also located in an area surrounded by two interstates and other roadway sources.
| Primary Findings | Levels of lead, a pollutant for which there are national standards for ambient air, are below the level of the national standard for protection of public health. Measured levels of naphthalene, 1,3-butadiene, and benzene in the air are below the levels of significant concern suggested by previously available information; however, these results indicate the influence of mobile source pollutants of concern that are the focus of EPA actions nationwide. Results of a recent short-term laboratory study have raised questions about the consistency and reliability of monitoring results of acrolein. As a result, EPA will not use these acrolein data in evaluating the potential for health concerns from exposure to air toxics in outdoor air as part of the School Air Toxics Monitoring project. |
| Key Pollutants Monitored | Lead. Inhalation and ingestion may affect the developing nervous system if people are exposed to high levels. |
| Next Steps | Based on the analysis described here, EPA will not extend air toxics monitoring at this school. EPA remains concerned about emissions from stationary sources of air toxics and continues to work to reduce those emissions across the country, through national rules and by providing information and suggestions to assist with reductions in local areas. Additionally, EPA remains concerned about mobile source emissions and continues to work to reduce those emissions across the country, through national rules and by providing information and suggestions to assist with reductions in local areas. The South Coast Air Quality Management District (SCAQMD) will continue to oversee industrial facilities in the area through air permits and other programs. The California Air Resources Board (ARB) will continue to implement reductions in mobile sources through implementation of national programs and its own programs. |
Summary of Study Approach and Findings
Approach:
- A monitor collected air samples from August 5, 2009 through March 12, 2010 at the Felton Elementary School in Los Angeles, CA.
- We posted individual air sample results on this website throughout the monitoring period to keep your community informed during the monitoring period.
- During the monitoring period, we evaluated the monitored concentrations to see if there was a concern from short-term exposures (e.g., several weeks).
- When the monitoring was complete, we analyzed the results to see if there was a concern from long-term exposures (over a lifetime).
- Also, when the monitoring was complete, we evaluated all the air samples from the on-site monitor. We also evaluated information on wind speed and wind direction from a weather monitor at the school, along with historical weather information and information about nearby sources of lead, naphthalene, 1,3-butadiene, and benzene emissions.
Findings:
- Our analysis found that levels of lead, a pollutant for which there are national standards for ambient air, are below the level of the national standard for protection of public health.
- Our analysis found that levels of naphthalene, 1,3-butadiene, and benzene in the air at the school are below the levels of significant concern for long-term exposure suggested by previously available information, although these results do indicate the influence of mobile source pollutants of concern.
- Results of a recent short-term laboratory study have raised questions about the consistency and reliability of monitoring results of acrolein. As a result, EPA will not use these acrolein data in evaluating the potential for health concerns from exposure to air toxics in outdoor air as part of the School Air Toxics monitoring project.
- The concentrations of lead, naphthalene, 1,3-butadiene, and benzene measured at the school are lower than those suggested by the information that helped identify this school for monitoring.
- The levels of lead (TSP) measured in the outdoor air at this school do not indicate influence of nearby sources.
- Naphthalene, 1,3-butadiene, and benzene are common in the outdoor air in urban areas where many sources are located near one another, particularly mobile sources such as cars and other motor vehicles and off-road machinery. Concentrations of naphthalene, 1,3-butadiene, and benzene and other air toxics released by mobile sources are often elevated in locations close to roadways, such as at Felton Elementary School. EPA remains concerned about mobile source emissions and continues to work to reduce those emissions across the country through national rules and by providing information and suggestions to assist with reductions in local areas.
- The process to identify schools for monitoring relied on emissions estimates and other information. Ambient air monitoring at the school allowed measurement of what was actually in the air.
- Based on the analysis described here, EPA will not extend air toxics monitoring at this school. However, EPA’s ongoing research and national air toxics monitoring programs (e.g., the National Air Toxics Trends Stations) will continue to collect information on mobile source impacts on outdoor air nationally.
- Click here for additional information
How We Analyzed the Information We Collected at this School
The analysis considered whether the information collected at the school might raise concerns for the health of children or adults at the school. We looked at the following types of information:
- Measured lead, naphthalene, 1,3-butadiene, and benzene concentrations and information on lead, naphthalene, 1,3-butadiene, and benzene
- Measured wind direction and wind speed at the school
- Information about nearby sources of lead, naphthalene, 1,3-butadiene, and benzene emissions
Analysis of Measured Lead Concentrations:
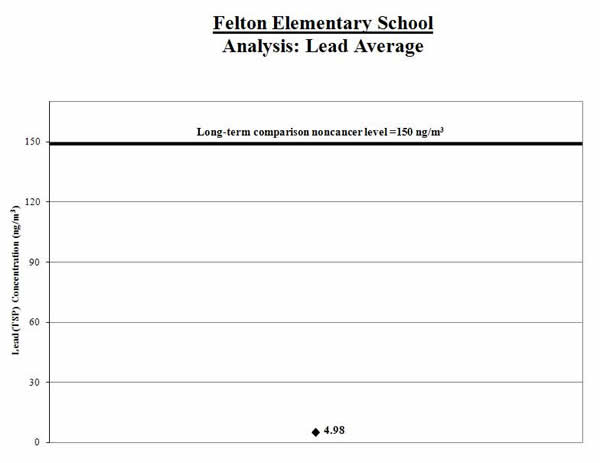
1. Calculate the average: We calculated the average of the lead (TSP) measurements (shown by the black diamond in the graph below). We compared this average to the long-term comparison level (thick line on the graph below). The comparison level is the level of the national ambient air quality standards (NAAQS) for lead.
Result: The average lead level for the samples collected was well below the comparison level. The health concern is low.
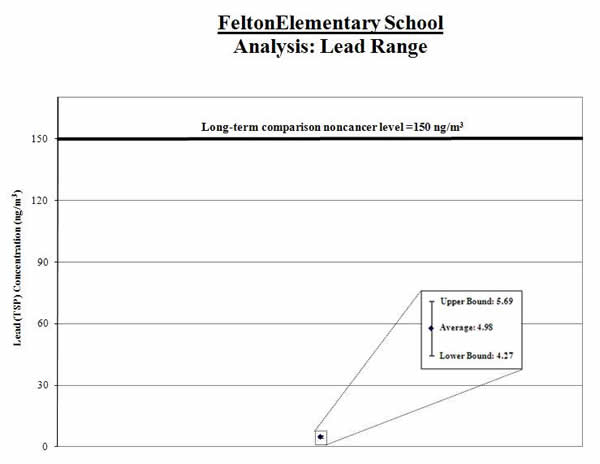
2. Calculate a range: To account for varying air concentrations of lead, we calculated a range around the average. We did this by estimating high and low values that the longer-term concentrations might reach using common statistical tools. We compared the highest point in the range (called the “upper bound”) to the comparison level.
Result: The high end of the range is lower than the comparison level. The health concern is low.
Analysis of Measured Naphthalene Concentrations:
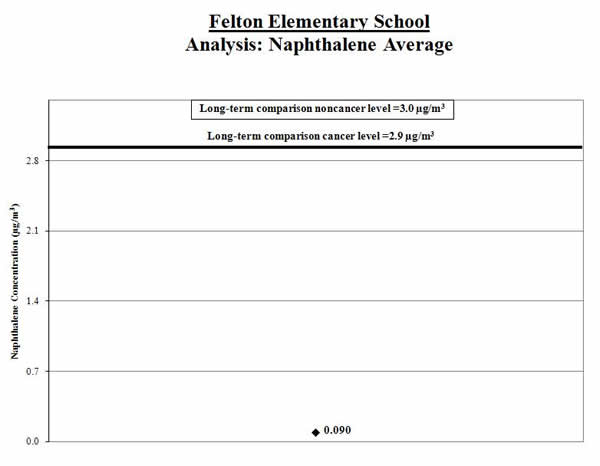
1. Calculate the average: We calculated the average of the naphthalene measurements (shown by the black diamond in the graph below). We compared this average to the comparison level (thick line on the graph below).
Result: The average naphthalene level for the samples collected was below the comparison level.
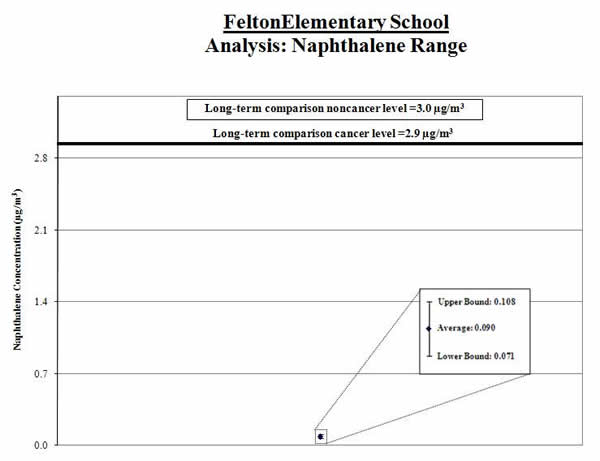
2. Calculate a range: To account for varying air concentrations of naphthalene, we calculated a range around the average. We did this by estimating high and low values that the longer-term concentrations might reach using common statistical tools. We compared the highest point in the range (called the “upper bound”) to the comparison level.
Result: The high end of the range is lower than the comparison level.
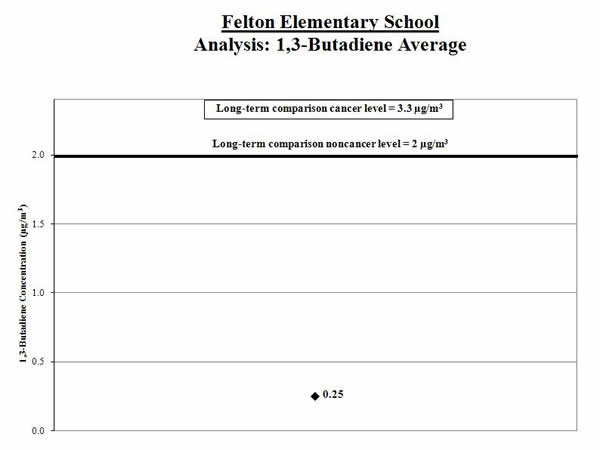
Analysis of Measured 1,3-Butadiene Concentrations:
1. Calculate the average: We calculated the average of the 1,3-butadiene measurements (shown by the black diamond in the graph below). We compared this average to the comparison level (thick line on the graph below).
Result: The average 1,3-butadiene level for the samples collected was below the comparison level.
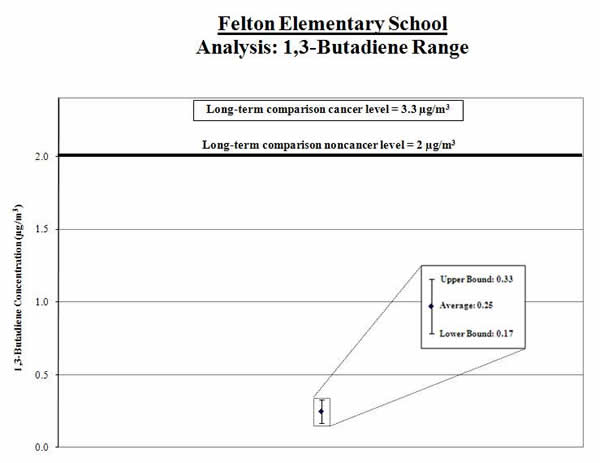
2. Calculate a range: To account for varying air concentrations of 1,3-butadiene, we calculated a range around the average. We did this by estimating high and low values that the longer-term concentrations might reach using common statistical tools. We compared the highest point in the range (called the “upper bound”) to the comparison level.
Result: The high end of the range is lower than the comparison level.
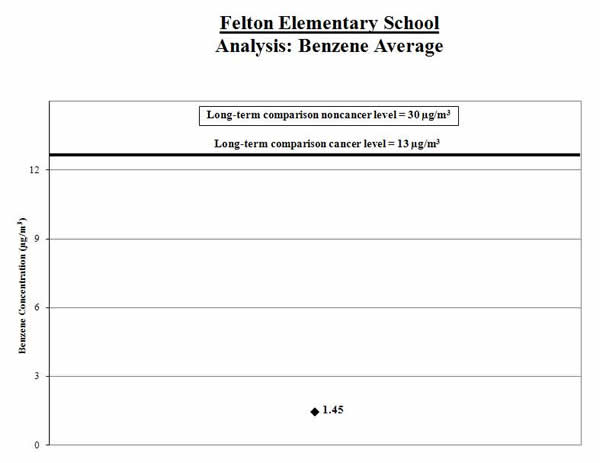
Analysis of Measured Benzene Concentrations:
1. Calculate the average: We calculated the average of the benzene measurements (shown by the black diamond in the graph below). We compared this average to the long-term comparison level (thick line on the graph below).
Result: The average benzene level for the samples collected was below the long-term comparison level.
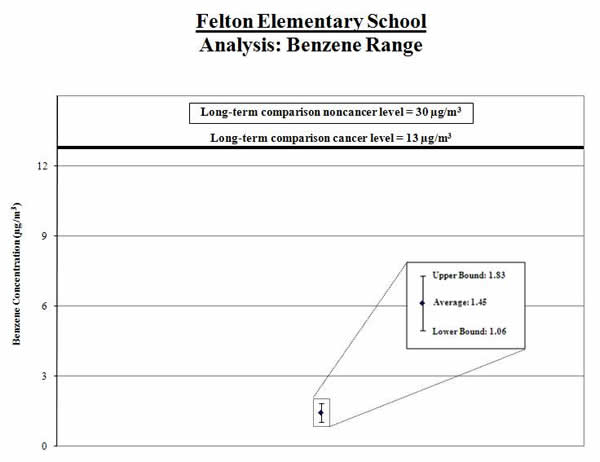
2. Calculate a range: To account for varying air concentrations of benzene, we calculated a range around the average. We did this by estimating high and low values that the longer-term concentrations might reach using common statistical tools. We compared the highest point in the range (called the “upper bound”) to the long-term comparison level.
Result: The high end of the range is lower than the comparison level.
Analysis of Measured Wind Direction and Wind Speed at the School
We took measurements of wind direction and speed every day during the sample period. We took special note of the wind speed and direction on the days we took measurements of lead, naphthalene, 1,3-butadiene, and benzene.
| What we looked at | What we found |
| We looked at whether the wind data taken on the days we took measurements of lead, naphthalene, 1,3-butadiene, and benzene are similar or different from the wind patterns during the entire sampling period. | We found the wind patterns taken on the days we took measurements of lead, naphthalene, 1,3-butadiene, and benzene to be generally similar to those observed during the entire sampling period. |
| We looked at whether the wind pattern during the sampling period is reflective of regional wind pattern over the long term. | We lack long-term wind data at the monitoring site, and the wind pattern at the NWS station during the sampling period is generally similar to the historical long-term wind flow pattern at that same NWS station. This suggests that on a regional scale, the 8‑month sampling period may be representative of year-round wind patterns. |
Analysis of Information on Nearby Sources of Lead, Naphthalene, 1,3-Butadiene, and Benzene Emissions
| What we looked at | What we found |
| Whether we could determine if the source was operating as usual during the sampling period. | There were no disruptions in typical aircraft or roadway activity during the sampling period. |
| The concentrations of lead, naphthalene, 1,3-butadiene, and benzene measured at the school are lower than those suggested by the information that helped identify this school for monitoring. | |
| EPA’s ongoing research and national air toxics monitoring programs will continue to collect information on mobile source impacts on outdoor air nationally. |
Additional Information
Technical Report for School: Assessing Outdoor Air Near Schools: Felton Elementary School (Los Angeles, CA) (PDF) (39pp, 1.3 MB). The technical report is geared toward risk assessors, risk managers, and other regulatory agencies.
Background on School Monitoring Effort