Where You Live
State and County Emission Summaries
Sources of air pollutant emissions vary from one area to another. State and county summaries grouped by major source sectors are available for each of these pollutants:
Facility Emission Summaries
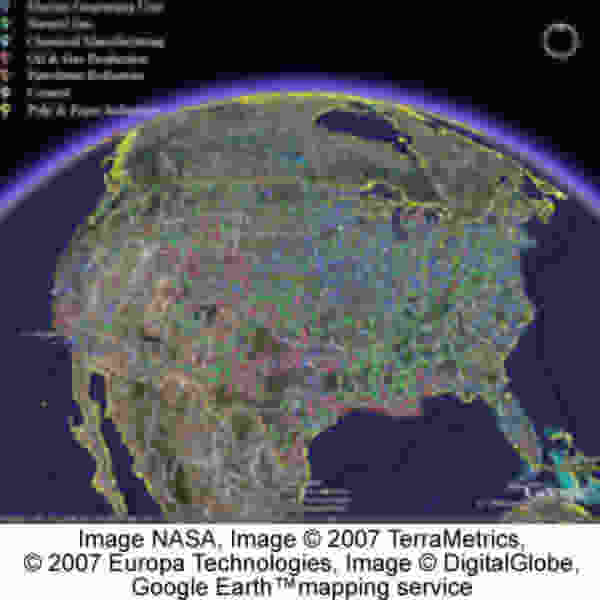
Facility-level information is available in KML format which can be viewed with Google Earth™. The information is also available in text format, as CSV or HTML.
If you are new to Google Earth, here is a Google Earth User Guide![]() which includes directions for downloading, installing, and using Google Earth.
which includes directions for downloading, installing, and using Google Earth.
The Google Earth emissions files are provided by EPA and are not hosted on a Google Earth server. They contain facility-level information for the top 8 major point-source sectors per pollutant. Emissions from nonpoint and mobile sources are not available in Google Earth format at this time.
One important feature of these files is that you can toggle on and off![]() the sectors that are displayed on the map. So if you want to focus only on Electricity Generation via Combustion, you can turn the other sectors off so they don't appear on the map.
the sectors that are displayed on the map. So if you want to focus only on Electricity Generation via Combustion, you can turn the other sectors off so they don't appear on the map.
Another important feature of these files is that you can tilt![]() the display. Since the height of each point corresponds to the total emissions from the facility, you can identify "big" emitters quickly and easily.
the display. Since the height of each point corresponds to the total emissions from the facility, you can identify "big" emitters quickly and easily.
Note that some facility coordinates may be based on a different projection system than Google Earth's, resulting in a slight visual shift (less than a mile) from the actual location.
Users new to Google Earth will notice that there are "layers" of information provided in the Google Earth software that are independent of this emissions files. They provide the ability to overlay additional geographic information like roads, topography, and landmarks. Some of these layers may already be turned on when you open Google Earth.
Create a File by State or Source Type
Want to focus on a particular state or source type? You can create your own files that are specific to certain states or source types. Just follow these steps.