Volatile Organic Compounds
National Summary
State and Local Summaries
National Summary of VOC Emissions
EPA prepares a national database of air emissions information with input from numerous state and local air agencies, from tribes, and from industry. The chart below shows the national summary of volatile organic compounds (VOCs) emissions by source sector based on the most recent inventory. View information on air quality standards, trends, health effects, and programs to reduce VOCs.

View the chart data in Microsoft Excel (Download Excel Viewer)
View the chart data in HTML (New window opens)
State and Local Summary of VOC Emissions
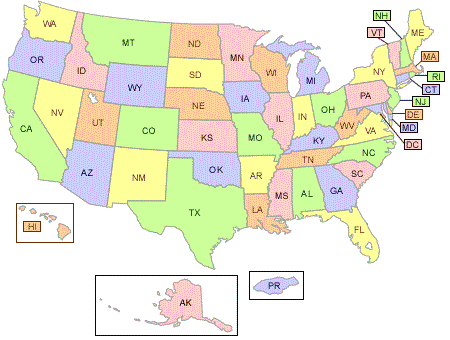
Sources of air pollutant emissions vary from one area to another. State and local summaries are available from the maps below.

![[logo] US EPA](https://www3.epa.gov/epafiles/images/logo_epaseal.gif)