Progress Report
Emission Reductions
Annual Nitrogen Oxides Figures
Source: EPA, 2022
Last updated: 07/2022
Related Figures
Highlights
Overall Results
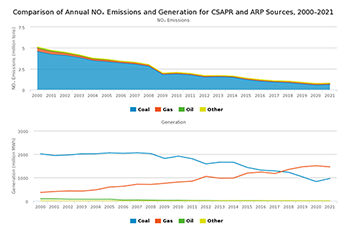
- Annual NOₓ emissions have declined dramatically under the ARP, CAIR, and CSAPR programs, with most reductions coming from coal-fired units. These reductions have occurred while electricity generation has remained relatively stable since 2000.
- These emission reductions are a result of an overall increase in the environmental efficiency at affected sources as power generators installed controls, ran their controls year-round, switched to lower emitting fuels, or otherwise reduced their NOₓ emissions. These trends are discussed further in Chapter 1.
- Other programs – such as regional and state NOₓ emission control programs – also contributed significantly to the annual NOₓ emission reductions achieved by sources in 2021.
Annual NOₓ Emissions Trends
- ARP: Units in the ARP NOₓ program emitted 763,000 tons of NOₓ emissions in 2021. Sources reduced emissions by 7.3 million tons from the projected level in 2000 without the ARP, over three times the program’s NOₓ emission reduction objective.
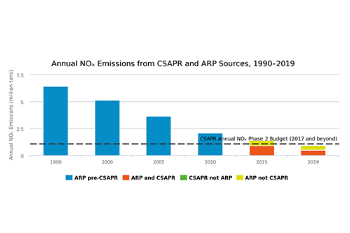
- CSAPR and ARP: In 2021, the seventh year of operation of the CSAPR NOₓ annual program, sources in both the CSAPR NOₓ annual program and the ARP together emitted 779,000 tons, a reduction of 5.6 million tons (88 reduction) from 1990 levels, 4.4 million tons (85 percent reduction) from 2000, and 2.9 million tons (79 percent reduction) from 2005 levels.
- CSAPR: Emissions from the CSAPR NOₓ annual program sources were 440,000 tons in 2021. This is about 1.7 million tons (80 percent) lower than in 2005 and 629,000 tons (59 percent) below the CSAPR NOₓ annual program's 2021 regional budget of 1,069,256 tons.
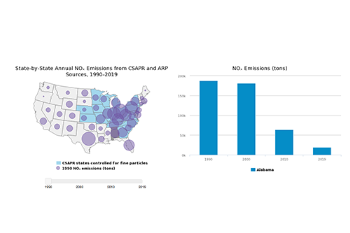
Annual NOₓ State-by-State Emissions
- CSAPR and ARP: From 1990 to 2021, annual NOₓ emissions in the ARP and the CSAPR NOₓ program dropped in 47 states plus Washington, D.C. by a total of approximately 5.6 million tons. In contrast, annual emissions increased in one states (Idaho) by 428 tons from 1990 to 2021.
- CSAPR: 21 of 22 states had emissions below their CSAPR 2021 allowance budgets, collectively by 632,000 tons. One state (Missouri) exceeded its 2021 state level budget by 2,623 tons. For more information about Program Compliance, see the Program Compliancechapter.
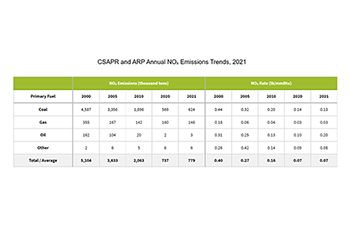
Annual NOₓ Emission Rates
- In 2021, the ARP and CSAPR average annual NOₓ emission rate was 0.07 lb/mmBtu, a 73 percent reduction from 2005.
- Emissions have decreased dramatically since 2005, due in large part to greater use of control technology, primarily on coal-fired units, and increased generation at natural gas-fired units that emit less NOₓ emissions per unit of electricity than coal-fired units.
Background Information
Nitrogen oxides (NOₓ) are made up of a group of highly reactive gases that are emitted from power plants and motor vehicles, as well as other sources. NOₓ emissions contribute to the formation of ground-level ozone and fine particle pollution, which cause a variety of adverse health effects.