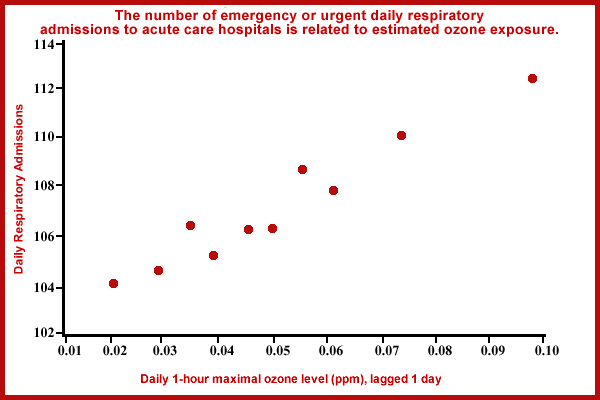
Figure 9: The number of emergency or urgent daily respiratory admissions
to acute care hospitals is related to estimated ozone exposure.Respiratory admission rates to 168 hospitals in Ontario, Canada during the period 1983 through 1988 are plotted against deciles of the daily 1-hour maximum ozone concentration, lagged by 1 day. Admission rates were adjusted for seasonal patterns, day-of-week effects, and hospital effects. Ozone displayed a positive and statistically significant association with respiratory admissions for 91% of the hospitals during the Spring through Fall seasons, but not during the Winter months of December to March when ozone levels were low.
Source: Burnett et al., 1994; U.S. EPA, 1996
