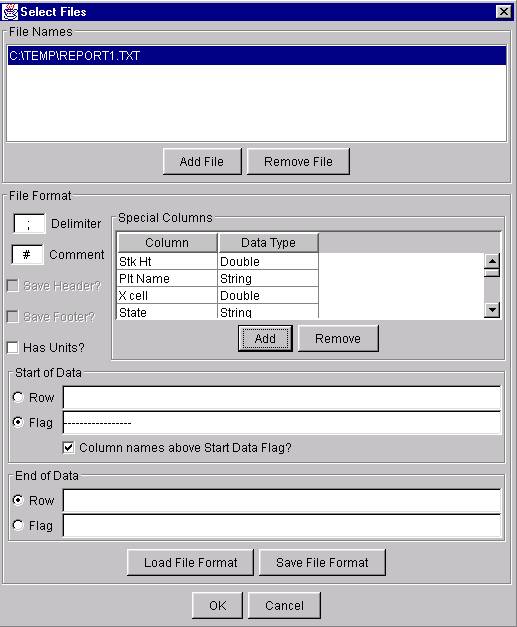
Below and to the left are places where you can specify
the delimiter between data columns and the character that starts a comment
line. The Special Columns area is discussed below. Beneath this is an area
that allows you to specify where your data begins and ends. You can specify
either a starting row or a flag that indicates that start of the data.
The start row is the row where the column names start. The start data flag
is a marker in your data file that indicates the start of the data. The
column names can appear either above or below this flag, depending on what
you check in the window. The end of the data can be left blank if it goes
to the end of the file, or you can specify and ending row or an end data
flag.
When you have chosen the options that match your data
file format, press OK and the file will be opened into a table in a new
window.
You may have a specific data format that is always
the same. Or you may have certain column names that should be assigned
to certain data types. JART looks at the first row of your data
file and tries to determine whether it is text, a number or a date. But
if a column has numbers in some rows and text in others, then this method
will not determine the data type of the column correctly.. To handle this,
you can specify certain column names that must be assigned a certain data
type for your files. Once you have done this, you can specify the other
information about your data file and then press Save File Format. This
will allow you to save this information to a file that can be used again
later. You could load it in using the Load File Format button.
If you have a format that you expect to use often,
you can set it as your default file format and JART will always
use it as the default when opening your files. To set the default file
format, first create it and save it as described above. Then go to the
main window, select the Edit menu and then select File Formats. You can
then select the file to use as your default file format.
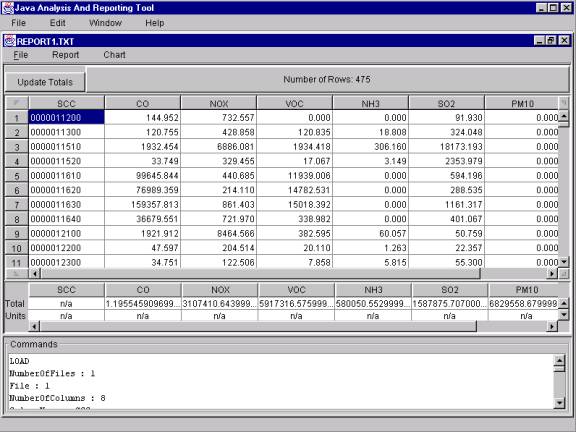
There are 3 main parts to the Data Window: the data
table, the total/units table, and the command window.
The data table contains your data in the order that
it appeared in the data file. You can move columns by dragging them by
the column header and resize columns by dragging the border between the
headers. Also, note the small buttons with arrows in the upper and lower
left and right corners of the table. Pressing these will take you to one
of the four corners of the dataset. For example, if you want to go to the
lower right cell in the dataset, press the lower right button. If you press
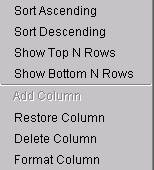
the right mouse button in the data area of this window, it will bring up
a pop-up menu with columns that are specific to the column that is currently
selected.
Choosing "Sort Ascending" or "Sort Descending" will
sort the curently selected column in the chosen order. Choosing "Sort Top
N Rows" or "Sort Bottom N Rows" will allow you to enter the number
of rows that you would like to see. Note that this feature will remove
any other filters that you have applied to the data. It also mya show more
than the number of rows that you selected. For example, if you want the
top 10 rows, JART will find the 10th highest value and show it and all
values above that. But if there is are several values that are the same
as the 10th value, they will also be displayed in the results. The remaining
three command will allow you to Restore a deleted column, delete the currently
selected column and format the current column. They are discussed below.
The total/units table contains Totals in the top row
and units in the bottom row. If your file did not have units, they will
be listed as n/a. The totals are only done for numeric columns. In order
to be certain that they update properly, always press the Update Totals
button. There is a bug associated with this that causes the column widths
in the table to shrink. To fix this, resize any column in the Totals table
by dragging the border of a header and press Update Totals again.
The command window shows a listing of commands that
you have executed. You can currently view these commands but you cannot
edit them. When you load in a data file, the command window contains the
command for opening a file. As you modify the data, each new command is
added to this window. The script commands are intended to be easily understood
and use full English words.
The data can be sorted in several different ways:
from the window menu or from a popup menu. If you only want to sort by
one column, then select that column with the mouse and hold down the right
mouse button.At the bottom of the popup menu, you will see Sort Ascending
and Sort Descending. Choose one of these and the data will be sorted
by the column that you selected.
If you need to sort by multiple columns, then go
to the Report menu and select Sort. This will bring up the Sort window.
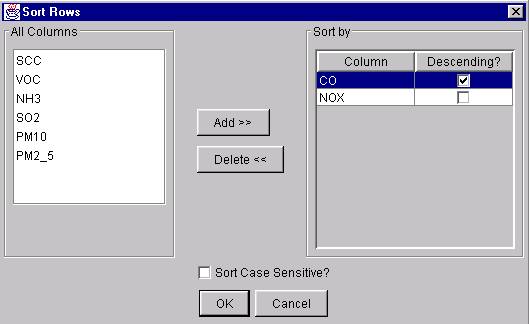
On the left there is a list of all of the columns
names in your file. On the right is a list of what columns to sort by.
You can add items to the Sort by list either by double-clicking on a
column name in the All Columns list or by selecting it in the All Columns
list and pressing the button with the right-facing arrow. Once you have
added the columns that you would like to sort by, you can choose whether
each column can be sorted in ascending or descending order by checking
the check box next to the column name. The columns will be sorted in the
order that you place them in the Sort by list. For example, in the above
picture, the data will first be sorted by CO in ascending order and then
by VOC in descending order.
Filtering Data
If your data contains more information than you want to view, you can filter
it to pare it down to a manageable size. You can filter with criteria for
one column or for many columns. To start creating a filter, go to the Report
menu and select Filter. This will bring up the filter window.
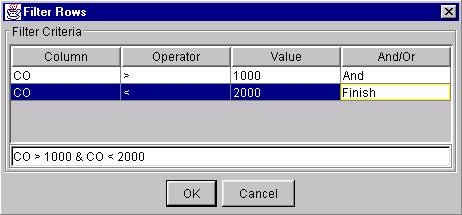
To create a filter, you can either use the table to
fill in entries or type directly into the text box at the bottom of the
window. To use the table, select the column that you wish to work on, then
select the operator. The available operators are <, <=, >, >=, =,
!=, startswith, endswith and contains. All of these operators can be used
with text values. However, for numeric and date values, only the following
operators can be used: <, <=, >, >=, = and !=. Double-click
in the value area and type the value that you want to use. To complete
editing, press either Tabor Enter. (Note: There is a bug on some operating
systems where the Enter key does not stop the editor). Verify that the
filter that you want is displayed in the text box below the table and press
OK. To enter multiple lines, select And or Or in the table and a new
line will be added.
Formulas can contain parentheses as well as simple
math operation like addition, subtraction, multiplication and division.
For example, if you wanted to filter all data where column CO was greater
than NOx + SO2, you could type CO > (NOX + SO2) or CO > 0.5 * NOX. To type
an And use &. To type an Or use |. When you are done, press
OK and your data will appear in the Report window filtered.
Resetting the data
After you have done some sorting or filtering, you may decide that you
want to return the original data. You can do this by going to the Report
menu and selecting Reset. This will restore the data to the original format
that it was in when first loaded.
Moving, Deleting and Restoring columns
A column can be moved by dragging the column name with your mouse. To delete
a column, select it with your mouse and press the right mouse button. Select
Delete Column from the popup menu and the column will be removed. To restore
a certain column, press the right mouse button and select Restore Column.
This will bring up a window with a list of columns that have been deleted.
Select the column to restore and press OK. To restore the data to the original
format that it was in when first loaded, use the Reset option described
above.
Totals
If you have columns that are numeric (not dates or text), JART
will keep track of the current totals in each column. To update the totals
after you have performed some operation, press the Update Totals button
in the upper left hand corner.
Formatting Columns
You can format the appearance of the columns on screen and in a printout.
To format a column, select it with your mouse and press the right mouse
button. Then select Format Column and the formatting window will appear.
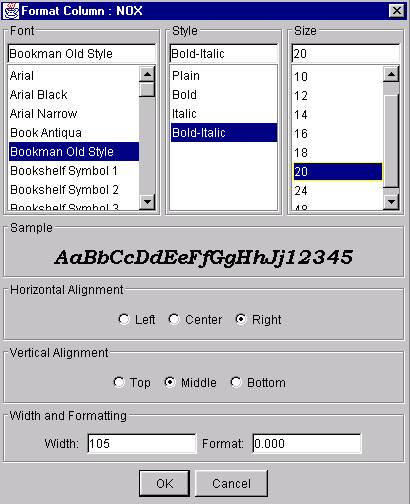
To change the font, choose a new font, style and size
from the top lists. A sample of what the new font will look like appears
just below these lists. To change the position of the text in each cell
of the table, use the Horizontal and Vertical Alignment buttons. To change
the column width, enter a new number in the Width text box. You can also
adjust the column width by grabbing the edge of the column heading in the
table and moving it. To change the formatting of the column, type a new
format into the Format text box. The symbols available are listed below:
-
0 - Any digit
-
# - A digit from 1 to 9, dont show if zero
-
. - Decimal separator
-
, - Placeholder fro grouping numbers
-
E - Separates mantissa and exponent for exponential notation.
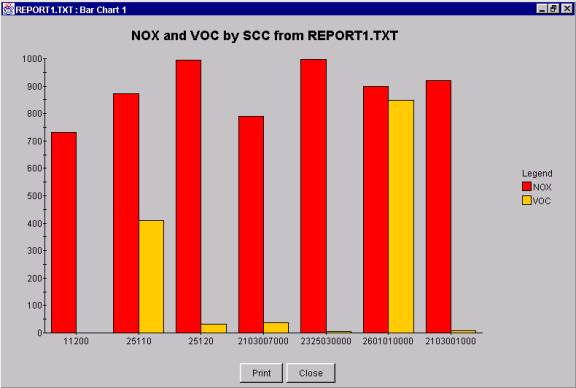
Charting Data
You can produce Bar charts from your data by selecting Chart and Bar Chart
from the DataWindow menu. This will present a window where you can specify
the columns that you would like to chart. It is best to filter your data
before creating a chart. Producing a chart with more than 25 rows will
result in a cluttered and difficult to read chart.
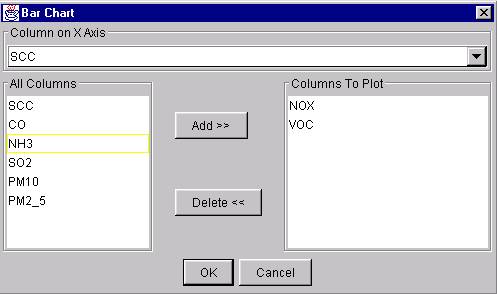
The top combo box allows you to select the values that will be displayed
X axis. On the left is a list of all columns in your data file. On the
right is a list of which ones you want in the bar chart. You can double-click
in either list to move values back and forth or you can use the Add and
Delete buttons. When you have selected the columns that you would like
to plot, press OK. This will create the chart in a new window.
Currently, there are no options for formatting the chart further. This
may be added in a future release.
Saving data
Once you have modified your data into a format that you need, you can save
the data to a text file. The spacing and formatting that appear on screen
will appear in the text file as well. This means that if one column is
wide on the screen, it will be wide in your text file as well. To save
your data, go to the File menu and select Save Data. Enter a file name
and press Save. The data will be separated using the same delimiter that
was used in the original data file.
Printing Data
You can also print out the data that you have on screen. The formatting
that appears on screen is what will appear in your printout. The entire
width of the table will be scaled down to fit on one page, so it is best
to limit the number of columns that you print to 8. To print your data,
go to the File menu and select Print Data. Select the pages that you would
like to print and press OK.
Reproducing Data Operations
If you have a series of operations that you perform
on a regular basis, you can record these operations and save them to be
used again. At the bottom of the Report window, you will see a text area
with text that changes each time that you change the data. This keeps a
record of each operation that you perform on the data. You can save these
instructions and use them later on another data set to perform the same
set of operations. For example, you may get a data set of air pollution
values every week. And every week, you may need to sort it by highest ozone
value, filter out certain counties, change the formatting, save this data
and print it out. You can record all of these operations and then let
JART perform them for you.
First, open some data and perform a sort and a filter
and change one columns format. Save the data and print it out. Now go
to the File menu and select Save Report. Enter a file name and press Save.
Now go to the File menu in the main window. Select
Run Script from the menu and choose the file that you just saved. JART
will ask you to choose the data file to work with and then it will ask
for the file name to save the results to. Enter these and JART
will perform the operations that you specified on the data automatically.
Note that you can only perform these operations
on a file with the same number of columns and the same column names. If
you have several data files with 5 columns, but all with different names,
you will need 5 separate scripts to work with each file.
The scripts cannot be edited on the screen, but
an advanced user can edit the text files that contain the scripts. This
can be useful if you accidently performed an extra operation that you did
not mean to perform and you want to delete it.
Known Bugs
Data Window :
-
Totals do not always have the correct width after pressing update. This
usually occurs the second time after pressing Update Totals. Adjust the
first column in the Totals table correcly and then press Update Totals
again and it is OK.
-
Sometimes the row numbers disappear. Resizing the window should restore
them.
Filter Window :
-
The editor does not stop when Return is pressed. Tab works. If the editor
has not been exited properly, then the And/Or selection will not add a
new line.
Format Window :
-
The font does not update when you change a value in the Style combo box.
Running Scripts :
-
The Column width will not be recorded in a script when you adjust it from
the GUI. If you want the column widths to be recorded, they must be set
using the Column Format window.
Bar Charts :
-
Large values are not displayed correctly on the Y-axis. This seems to occur
with values in the hundred-thousands.
-
Wide column names on the X-axis are not displayed correctly. The only workaround
is to display fewer values on the X-axis and to maximize the windows so
that there is space for the names.
No Undo