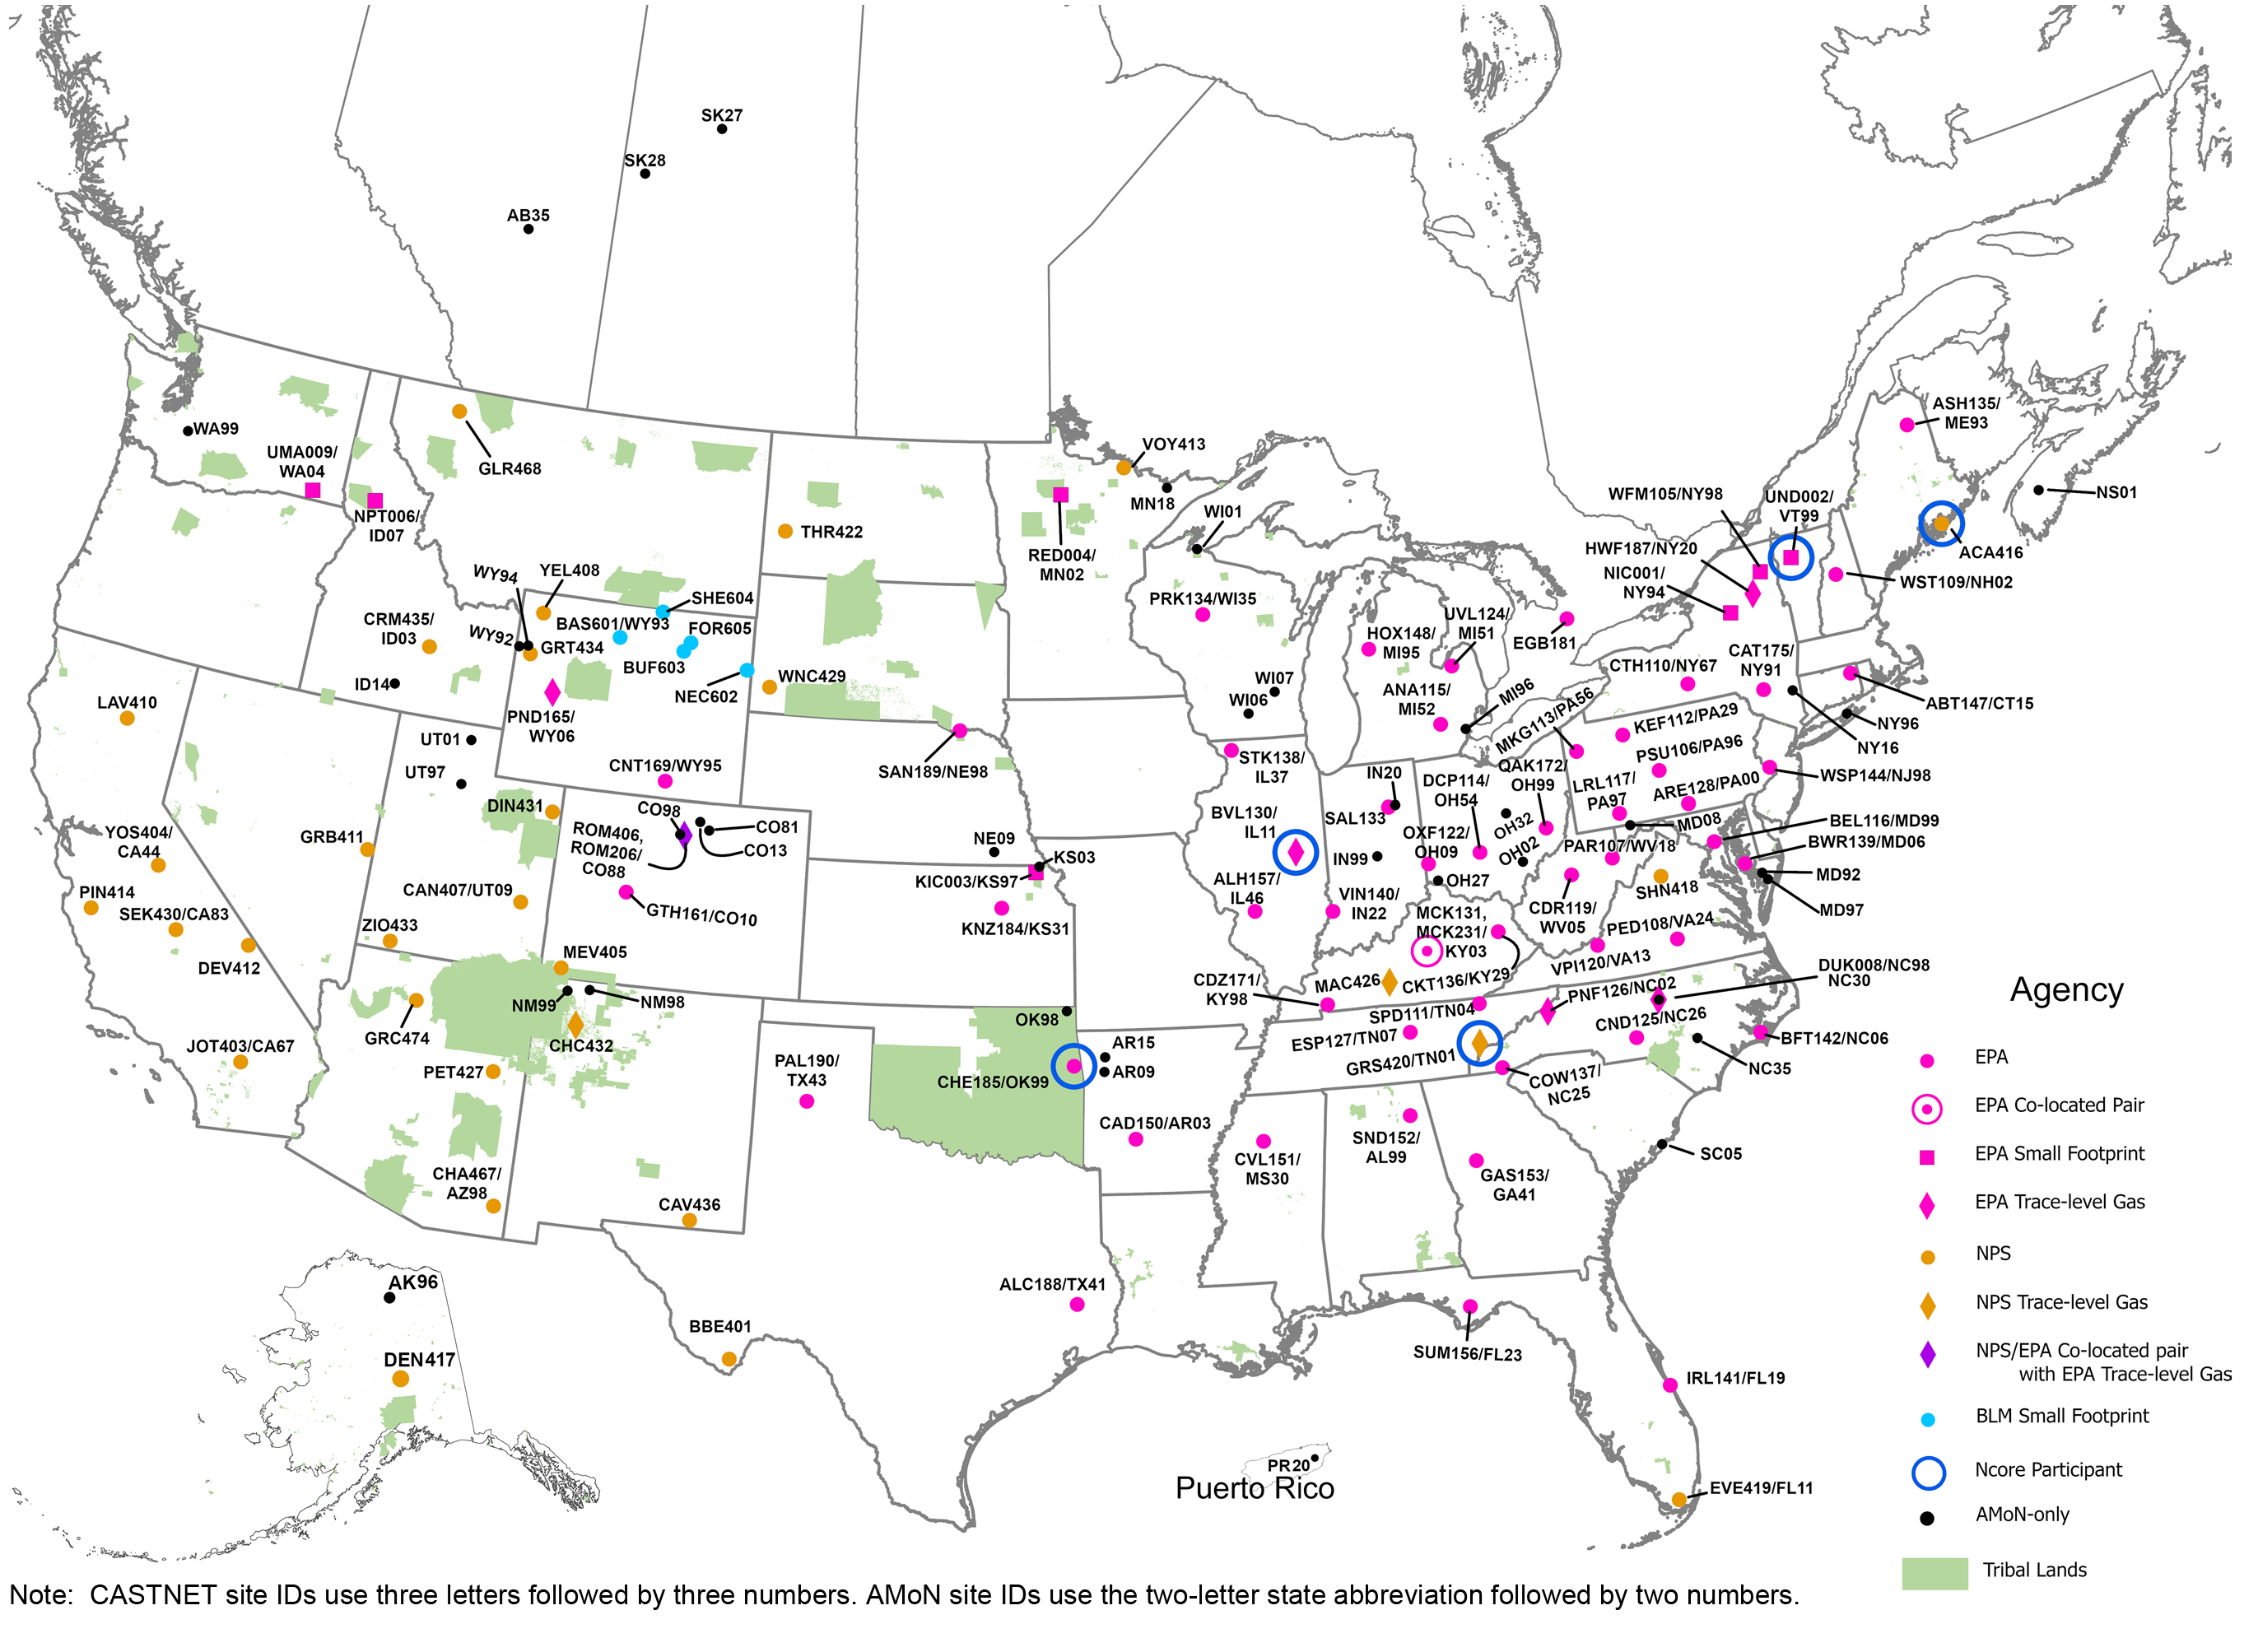
Figure 1 CASTNET and AMoN Sites Operational during 2021
 Download Figure
Ca 2+ Cl - HNO3 //HNO3- K + Mg 2+ Na + NH3 NH4+ NHx NO3- NOx NOy NOz O3 PM2.5 PM10 SO2 SO42- SOx µg/m 3 ha -1 yr -1
Note:
1 The NAAQS was revised from 0.075 ppm to 0.070 ppm on October 15, 2015.
2 To attain this standard, the 3-year average of the fourth highest DM8A O3 concentrations measured at each monitor within a specified area must not exceed 0.070 ppm or 70 parts per billion (ppb) in practice (effective December 28, 2015). Ozone concentrations are commonly presented in units of ppb.
 Download Figure


