CASTNET Overview
Introduction
The Clean Air Status and Trends Network (CASTNET) operated 99 monitoring stations throughout the contiguous United States, Alaska, and Canada in 2020. Ninety-four sites included filter pack systems to sample weekly concentrations of acidic gases and particulate matter. Eighty-seven sites included continuous ozone (O3) analyzers. The U.S. Environmental Protection Agency (EPA), the National Park Service (NPS), and the Bureau of Land Management-Wyoming State Office (BLM) are the primary sponsors of CASTNET. EPA established CASTNET in 1987, and NPS began its participation in 1994. NPS operated 30 sites during 2020. The BLM operated five sites in Wyoming. Site locations can be viewed on the CASTNET website.
Many organizations, including Native American tribes, state and federal government agencies, and universities, contribute to CASTNET. These participants sponsor individual CASTNET sites and provide in-kind services that support the overall performance of the network. For example, these participants operate and repair site instruments, change weekly filter packs, and perform general site maintenance. Many also provide the land for the CASTNET site.
Locations of Monitoring Sites
A map of CASTNET monitoring sites is provided in Figure 1. In 2020, 99 monitoring sites operated at 97 distinct locations. Native American tribes operated seven CASTNET sites in the central and northwestern United States. To estimate precision across the network, co-located sites operated at Mackville, KY (MCK131/231) and Rocky Mountain National Park, CO (ROM406/206). The ROM406/206 pair ensures consistency between EPA (ROM206) and NPS (ROM406). Of the two Rocky Mountain monitoring sites, ROM406 is specified as the regulatory monitoring site for O3. The National Atmospheric Deposition Program (NADP) Ammonia Monitoring Network (AMoN) sites are also displayed in Figure 1. If the AMoN site is co-located with a CASTNET site, its site ID is displayed with the CASTNET ID. If it is not co-located, it is shown with a black dot.
Measurements Recorded at CASTNET Sites
During 2020, 94 CASTNET sites measured weekly ambient concentrations of acidic pollutants, base cations, and chloride (Cl -) using a 3-stage filter pack with a controlled flow rate (Wood, 2020; https://epa.gov/castnet/documents-reports). Gaseous pollutant concentrations include nitric acid (HNO3) and sulfur dioxide (SO2). Particulate concentrations include nitrate (NO3-), ammonium (NH4+ ), sulfate (SO42- ), magnesium (Mg 2+ ), calcium (Ca 2+ ), potassium (K + ), sodium (Na + ), and Cl -. The filter pack is replaced each Tuesday and shipped to the analytical chemistry laboratory for analysis. Ambient temperature is measured at all sites in part to enable conversion of concentrations to local conditions.
Figure 1 CASTNET and AMoN Sites Operational during 2020
View larger mapMost CASTNET sites also include a temperature-controlled shelter and continuous O3 monitoring system. CASTNET also deploys a small-footprint monitoring station that does not require a walk-in shelter. These sites can be operated using conventional or alternative power sources (wind/solar). The ability to use alternative power sources allows these sites to be placed in remote areas that are off the electrical grid. During 2020, CASTNET operated 12 small-footprint sites. Ozone concentrations were measured at 87 of the 99 sites. The O3 inlet and filter pack are located atop a 10-meter tower. Some CASTNET sites also measure trace-level SO2, carbon monoxide, and nitric oxide/total reactive oxides of nitrogen (NO/NOy). One site measures NO/total nitrogen oxides (NOx). In 2020, meteorological parameters were measured at 5 EPA-, 30 NPS-, and 5 BLM-sponsored CASTNET sites. Measured meteorological parameters include 2-m temperature, wind speed and direction, standard deviation of the wind direction, solar radiation, relative humidity, precipitation, and surface wetness (at select sites).
Trends in fourth highest daily maximum 8-hour average (DM8A) O3 concentrations and annual sulfur and nitrogen levels are depicted in the following sections using box plots showing 1-year mean, median, and annual distributions of concentrations aggregated from 34 eastern reference sites for 1990 through 2020 and for 16 western reference sites for 1996 through 2020. The reference sites were selected for their long term data records and consistent performance. All data used to create the figures and maps in this report are available on the CASTNET website.
Related Air Quality Networks
CASTNET monitors air quality and deposition in cooperation with other national and international networks. EPA uses data from CASTNET and the other long-term national networks to assess the effectiveness of emission control programs and to characterize rural air quality nationwide. Although not shown in Figure 1, CASTNET sites are often co-located with one or more of the networks listed below. These networks include the NADP and its affiliated networks
- National Trends Network (NTN)
- Mercury Deposition Network (MDN)
- Atmospheric Mercury Network (AMNet)
Other cooperating networks include:
- Canadian Air and Precipitation Monitoring Network (CAPMoN)
- EPA’s National Core Monitoring (NCore)
- BLM’s Wyoming Air Resources Monitoring System (WARMS)
- Interagency Monitoring of Protected Visual Environments (IMPROVE)
Quality Assurance Program
The CASTNET quality assurance (QA) program was established to ensure that all reported data are of known and documented quality in order to meet CASTNET objectives. The QA program also ensures intra network consistency and comparability and the delivery of data that are reproducible and comparable with data from other monitoring networks. The 2020 QA program elements are documented in the CASTNET Quality Assurance Project Plan (QAPP; Wood, 2020). The QAPP includes standards and policies for all components of project operation, from site selection through final data reporting, with appendices that provide standard operating procedures for CASTNET operations. QA program metrics are available in quarterly and annual QA reports posted on the EPA CASTNET website.
Impacts of COVID-19 Pandemic on CASTNET Operations
On March 18, 2020, EPA’s Office of Air Quality Planning and Standards (OAQPS) issued a memorandum titled, “Ambient Air Monitoring Programs, Continuity of Operations Associated with the COVID-19 Response.” This memo established that ambient air quality monitoring programs were an essential function and should continue operations. The memo urged state agencies to continue monitoring unless state, local, or tribal directives prohibited site operation. EPA, NPS, and BLM shared the memo with their contractors overseeing operation of CASTNET sites. The contractors provided the memo to site operators and field technicians on an as-needed basis to support continuation of routine site operations, including calibrations. However, some sites were in areas where state, local, or tribal requirements prevented site operators and field technicians from making site visits. These restrictions primarily affected filter pack sampling since the filter packs are replaced weekly during a site visit. The continuous monitoring instruments were generally not impacted. Most of the routine calibration visits scheduled for April and May 2020 were cancelled and rescheduled due to site access restrictions, travel restrictions, and/or safety concerns.
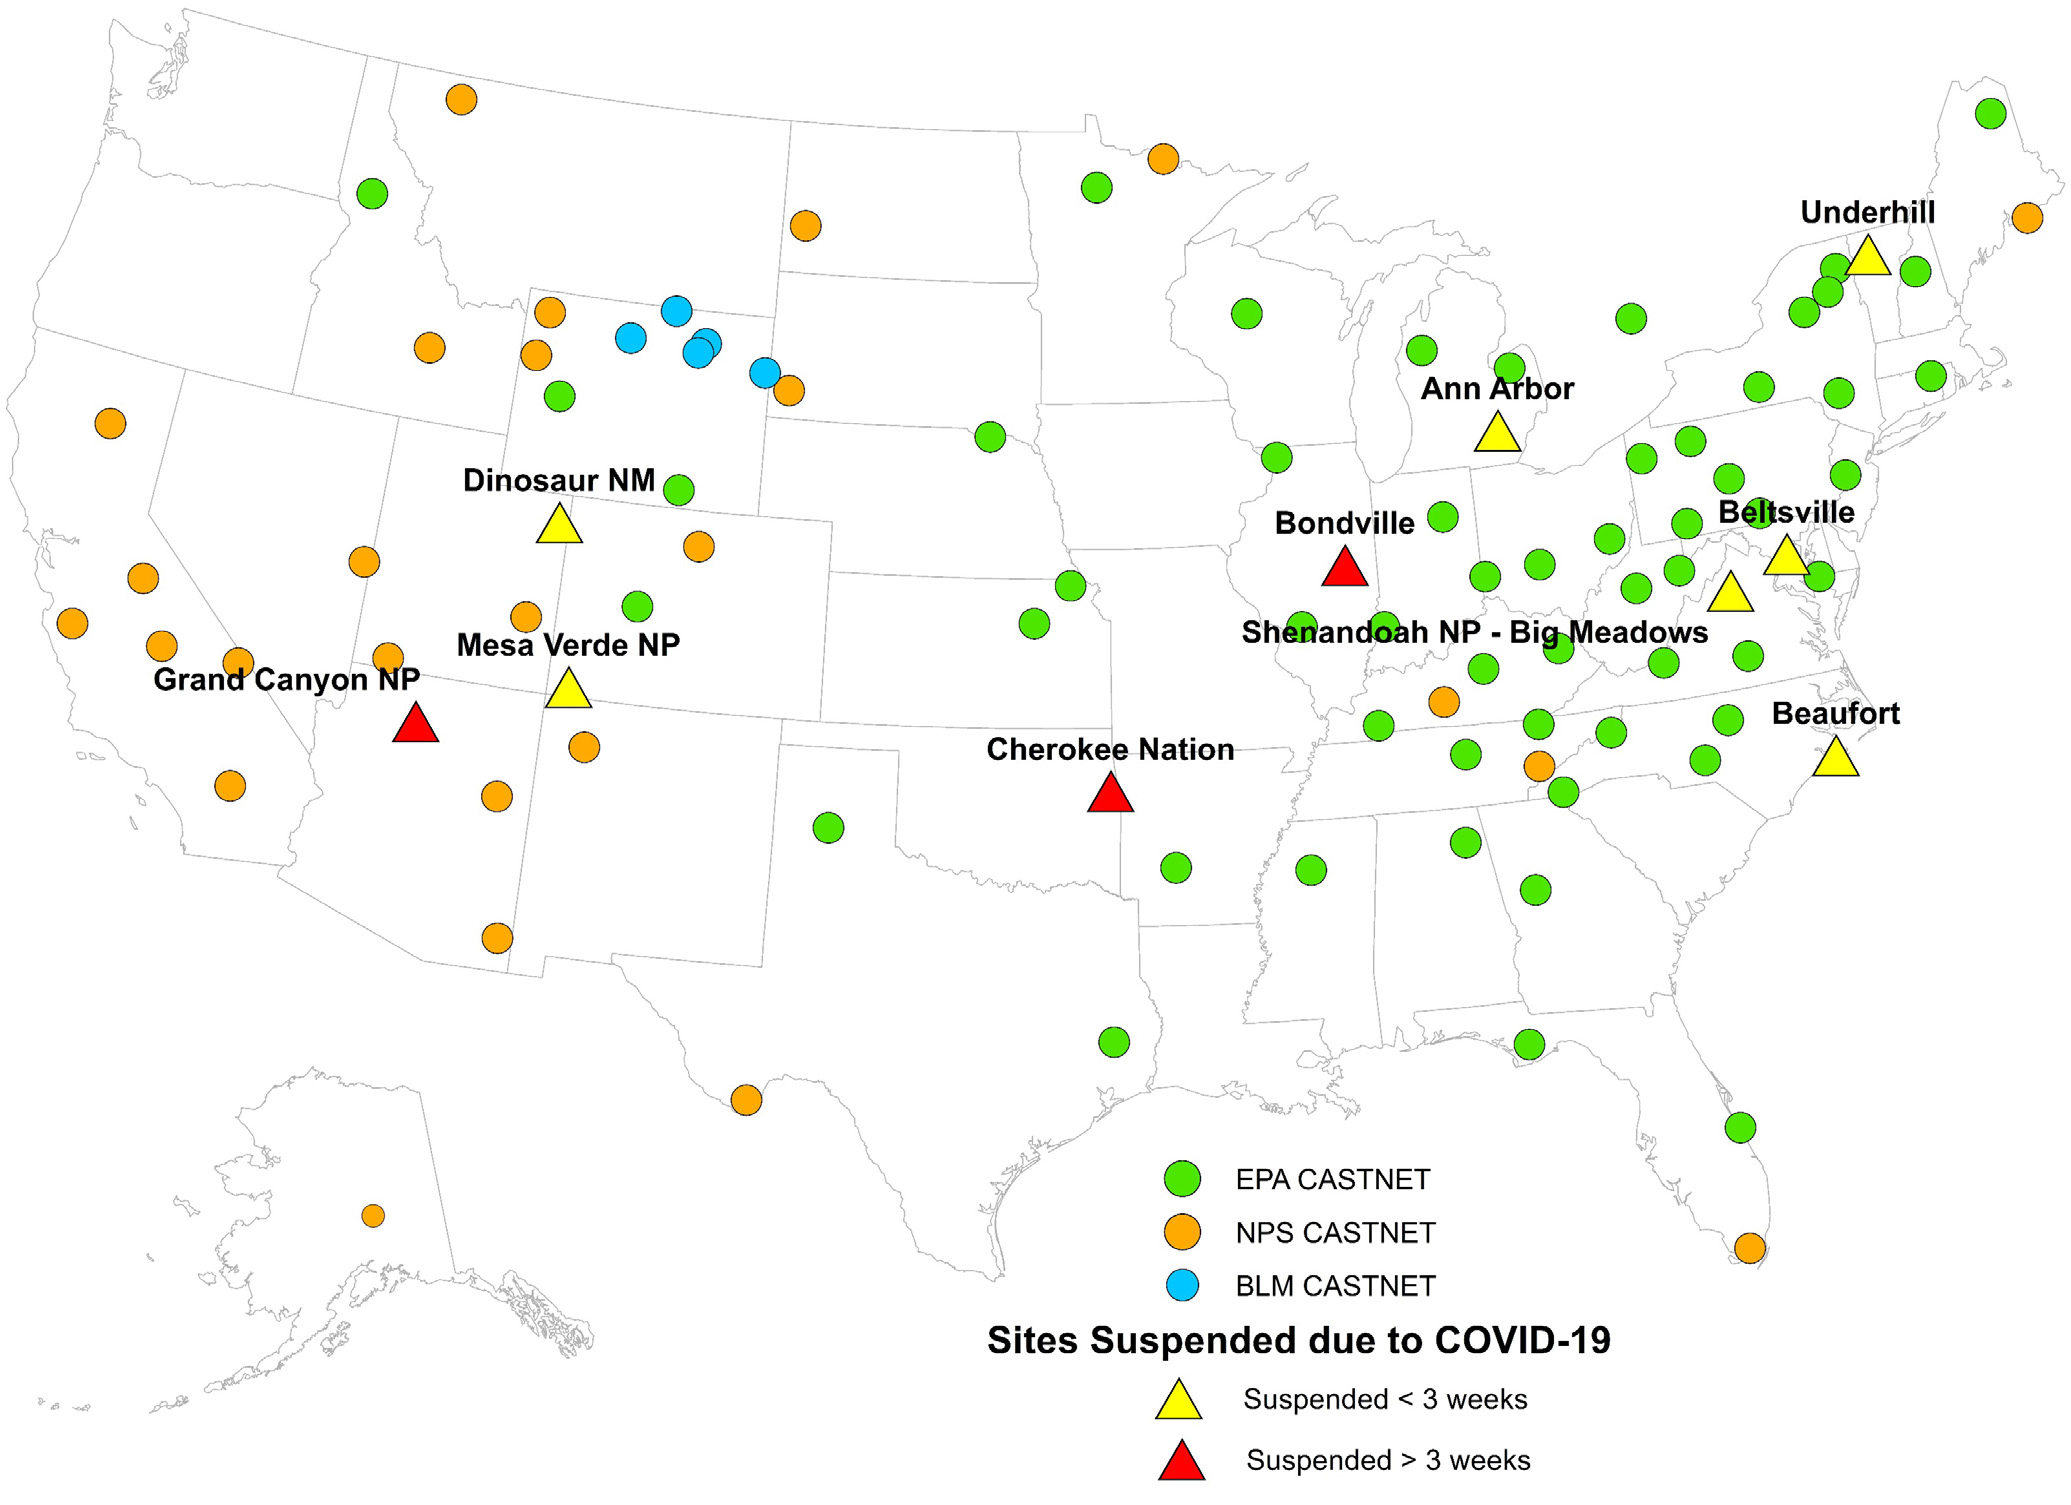
Figure 2 provides a summary of impacts of the pandemic on CASTNET operations. Wood Environment & Infrastructure Solutions, Inc. (Wood) provides filter packs to all CASTNET sites. Wood’s field and laboratory staff worked with the site operators to update and optimize shipping addresses to streamline delivery of filter packs to the sites and then back to the laboratory. Some delays in filter samples being delivered to Wood’s Gainesville, FL analytical laboratory occurred because of slowdowns in United States Postal Service operations. Wood eventually caught up with the routine six-month calibrations after state travel restrictions and stay-at-home orders expired or were lifted. Figure 2 shows the sites where site visits were suspended during the pandemic, and filter pack sampling was impacted.
The NPS sites that shut down temporarily were mostly affected by the suspension of shipping to the sites. The NPS sites affected included Grand Canyon National Park, AZ (GRC474); Mesa Verde National Park, CO (MEV405); Dinosaur National Monument, UT (DIN431); and Shenandoah National Park, VA (SHN418). In addition, the EPA sites that temporarily shut down included Cherokee Nation, OK (CHE185) for two months; Bondville, IL (BVL130) for one month; and Ann Arbor, MI (ANA115) for two weeks – the last two due to their respective university sponsor’s stay-at-home requirements. A few sites had filter packs with extended exposure due to quarantine requirements. Filter packs were evaluated on an individual basis but generally considered valid if they were exposed for three weeks or less.
Ozone Concentrations
CASTNET O3 measurements are subject to rigorous QA/quality control procedures specified by federal regulations and the CASTNET QA Program. Hourly average concentrations were measured at 88 CASTNET sites in 2020. Data from 87 sites were delivered routinely to the EPA Air Quality System (AQS) database (epa.gov/aqs). One site, Duke Forest, NC (DUK008), is a research site operated by EPA’s Office of Research and Development (ORD). The O3 inlet at DUK008 is located near the top of a 30 m tower above the forest canopy and does not meet regulatory siting criteria. Two co-located monitors were designated as National Ambient Air Quality Standards (NAAQS)-excluded, and the associated data from these monitors were used for QA purposes only. With the exception of DUK008 and the two NAAQS-excluded sites, data were used to calculate the three-year average of the fourth highest DM8A O3 concentrations if three years of Title 40 Code of Federal Regulations Part 58-compliant data were available (Figure 3). CASTNET measurements provided data to support comparison with the O3 NAAQS and to assess long-term trends and geographic patterns in regional O3.
The primary O3 NAAQS is designed to protect public health. The secondary standard is designed to protect public welfare and the environment. On October 1, 2015, the EPA promulgated a revision to the O3 NAAQS, lowering the level of both the primary and secondary standards to 0.070 parts per million (ppm). On December 23, 2020, EPA decided to retain the 2015 O3 NAAQS without changes to the form or level. To attain the 2015 standard, the 3-year average of the fourth highest DM8A O3 concentrations measured at each monitor within a specified area must not exceed 0.070 ppm or 70 parts per billion (ppb) in practice. For this report, the 2015 standard and related calculations were used. The design values for each standard can be downloaded from the EPA Air Quality Design Values website
The EPA and other federal, tribal, state, and local agencies measure hourly O3 concentrations through national and local monitoring programs. Measurements potentially affected by exceptional events, i.e., unusual or natural events that can affect air quality but are not reasonably controllable, were not removed when calculating the fourth highest daily maximum values for this report.
Three-year averages of the fourth highest DM8A O3 concentrations for 2018 through 2020 are presented in Figure 3. Ozone concentrations were not included on the map if the 3-year average was not available because of incomplete data; these sites are shown as dots with no value. Table 1 lists sites with 2018–2020 O3 design values exceeding 70 ppb, the 2015 O3 NAAQS.
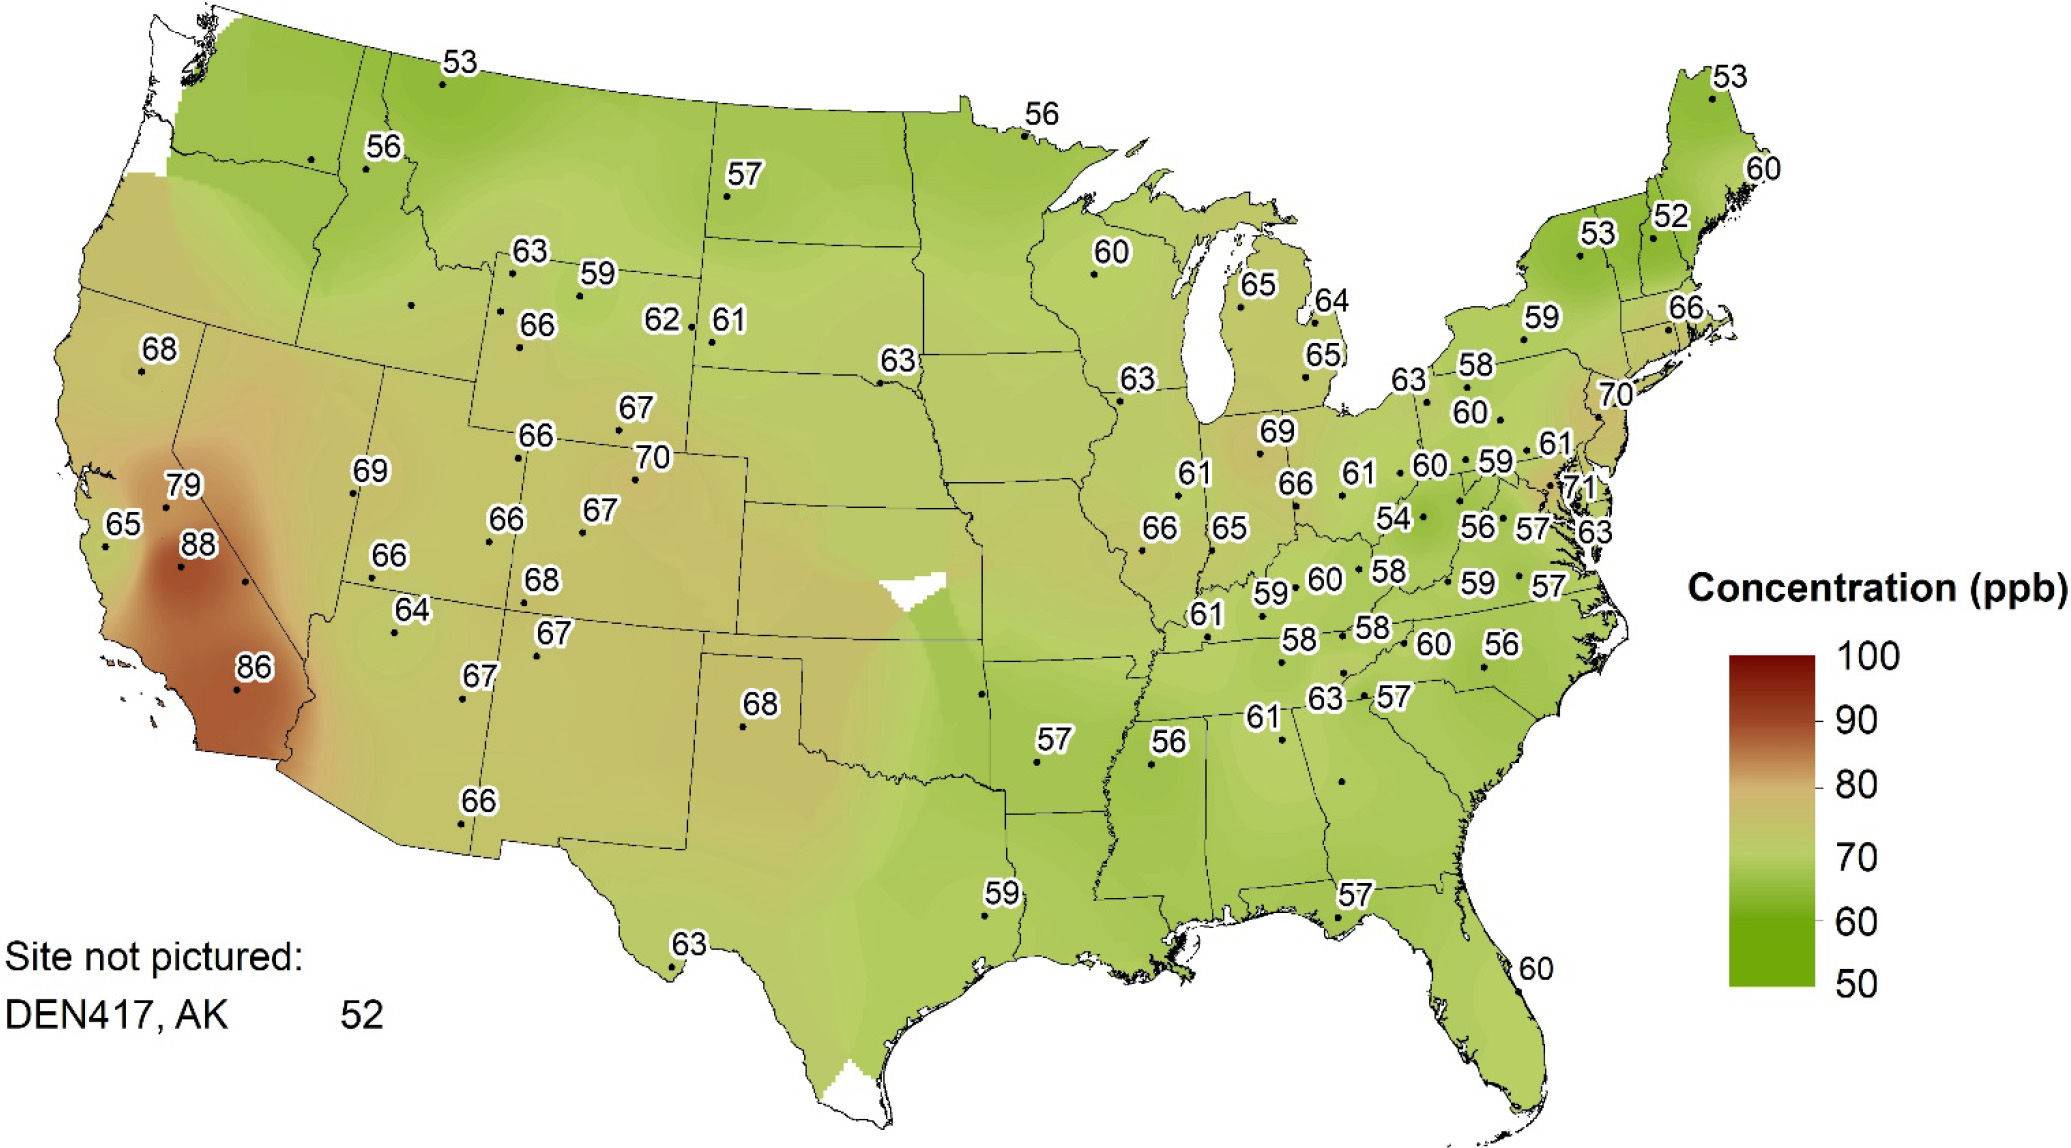
Table 1 2018–2020 O3 Design Values Greater than 70 ppb
| Site ID | State | Sponsor | 3-year Average |
|---|---|---|---|
| SEK430 | California | NPS | 88 |
| JOT403 | California | NPS | 86 |
| YOS404 | California | NPS | 79 |
| BEL116 | Maryland | EPA | 71 |
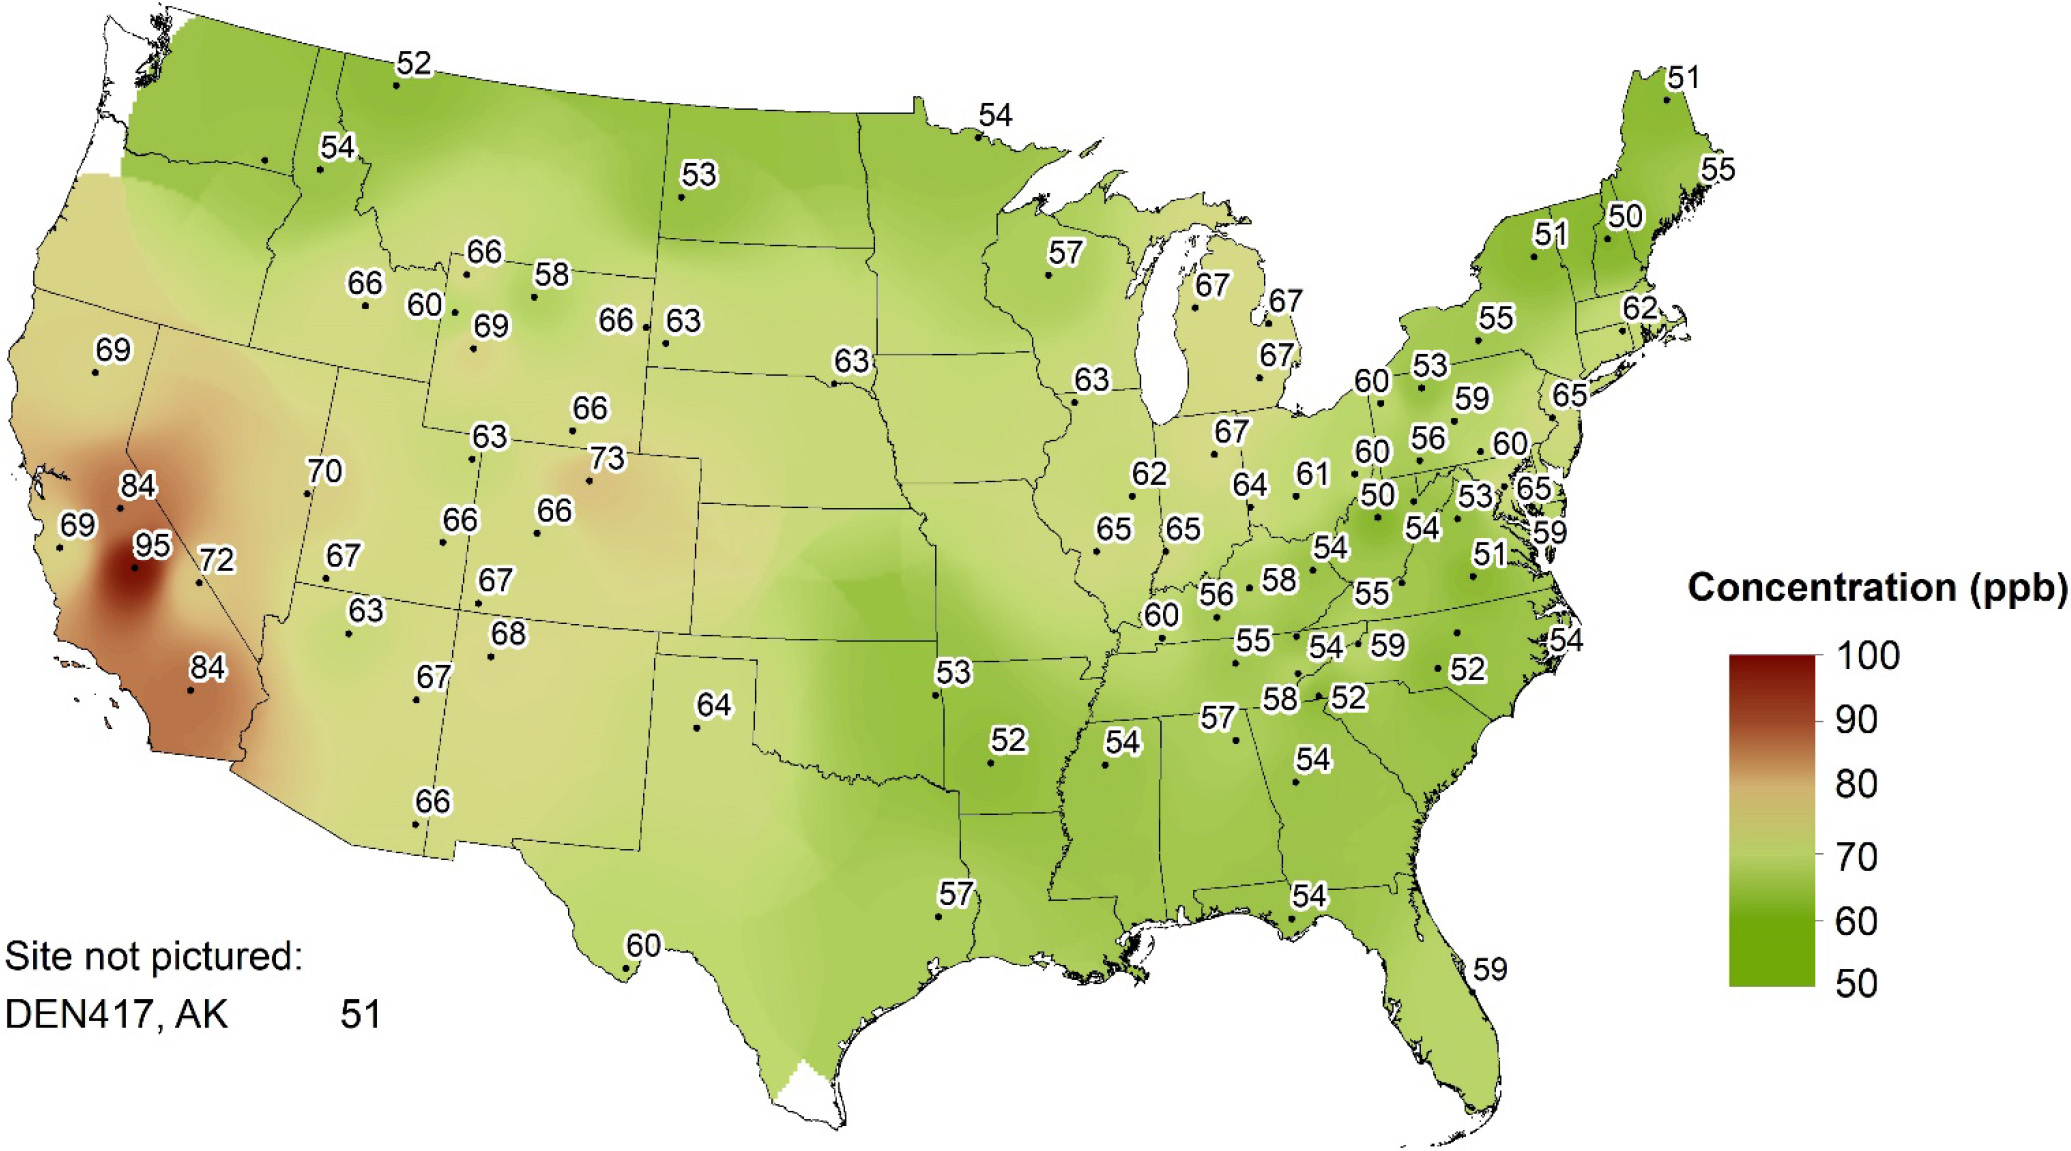
Figure 4 shows 2020 fourth highest DM8A O3 concentrations that met percent completeness criteria.
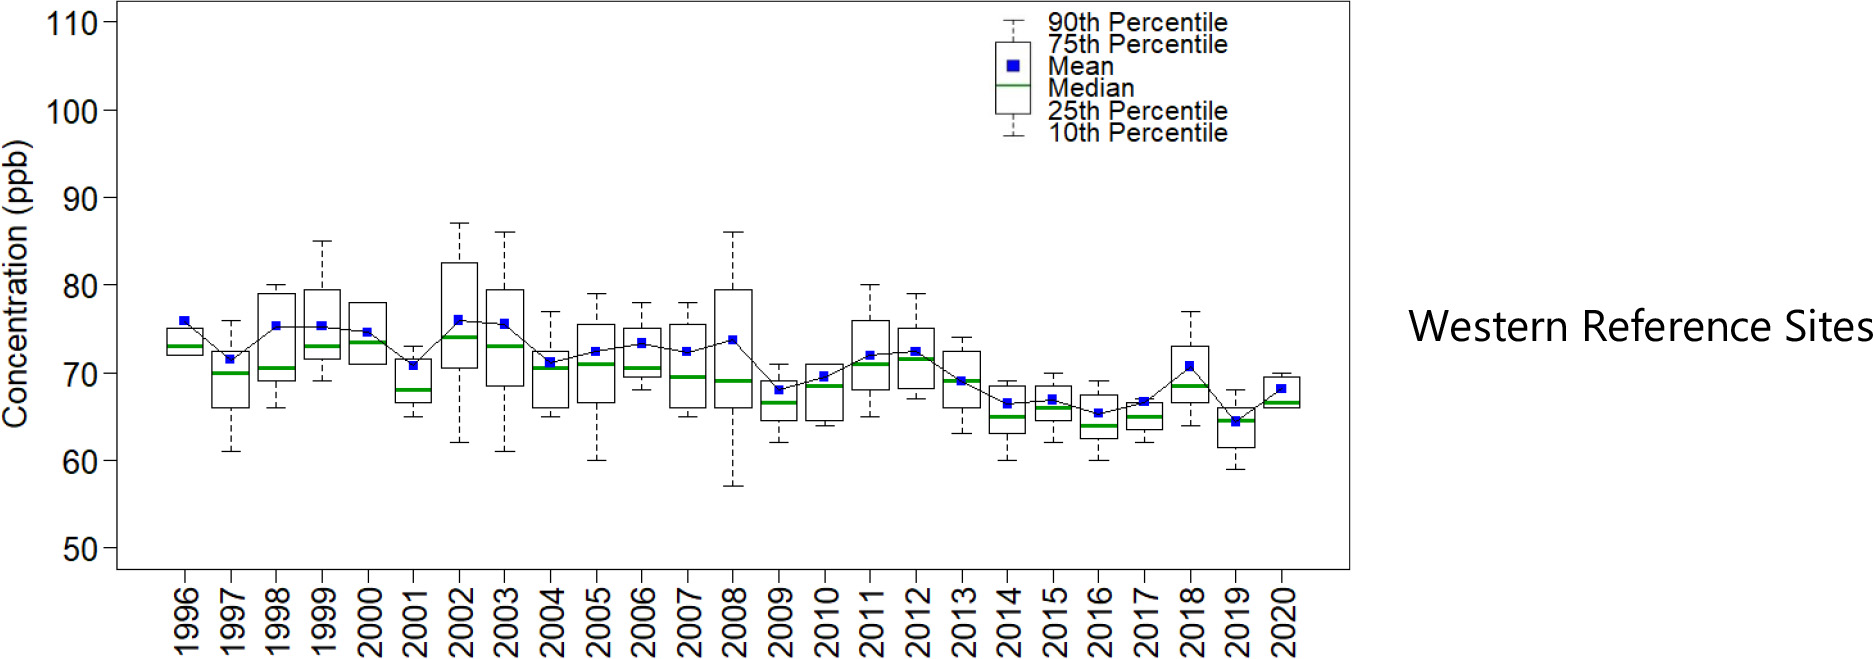
Figure 5 provides box plots depicting trends in 1-year mean, median, and annual distributions of fourth highest DM8A O3 concentrations from the 34 CASTNET eastern reference sites (Figure 5, 1 of 2) and the 16 western reference sites (Figure 5, 2 of 2)
Ozone Exposure Index Values for 2020
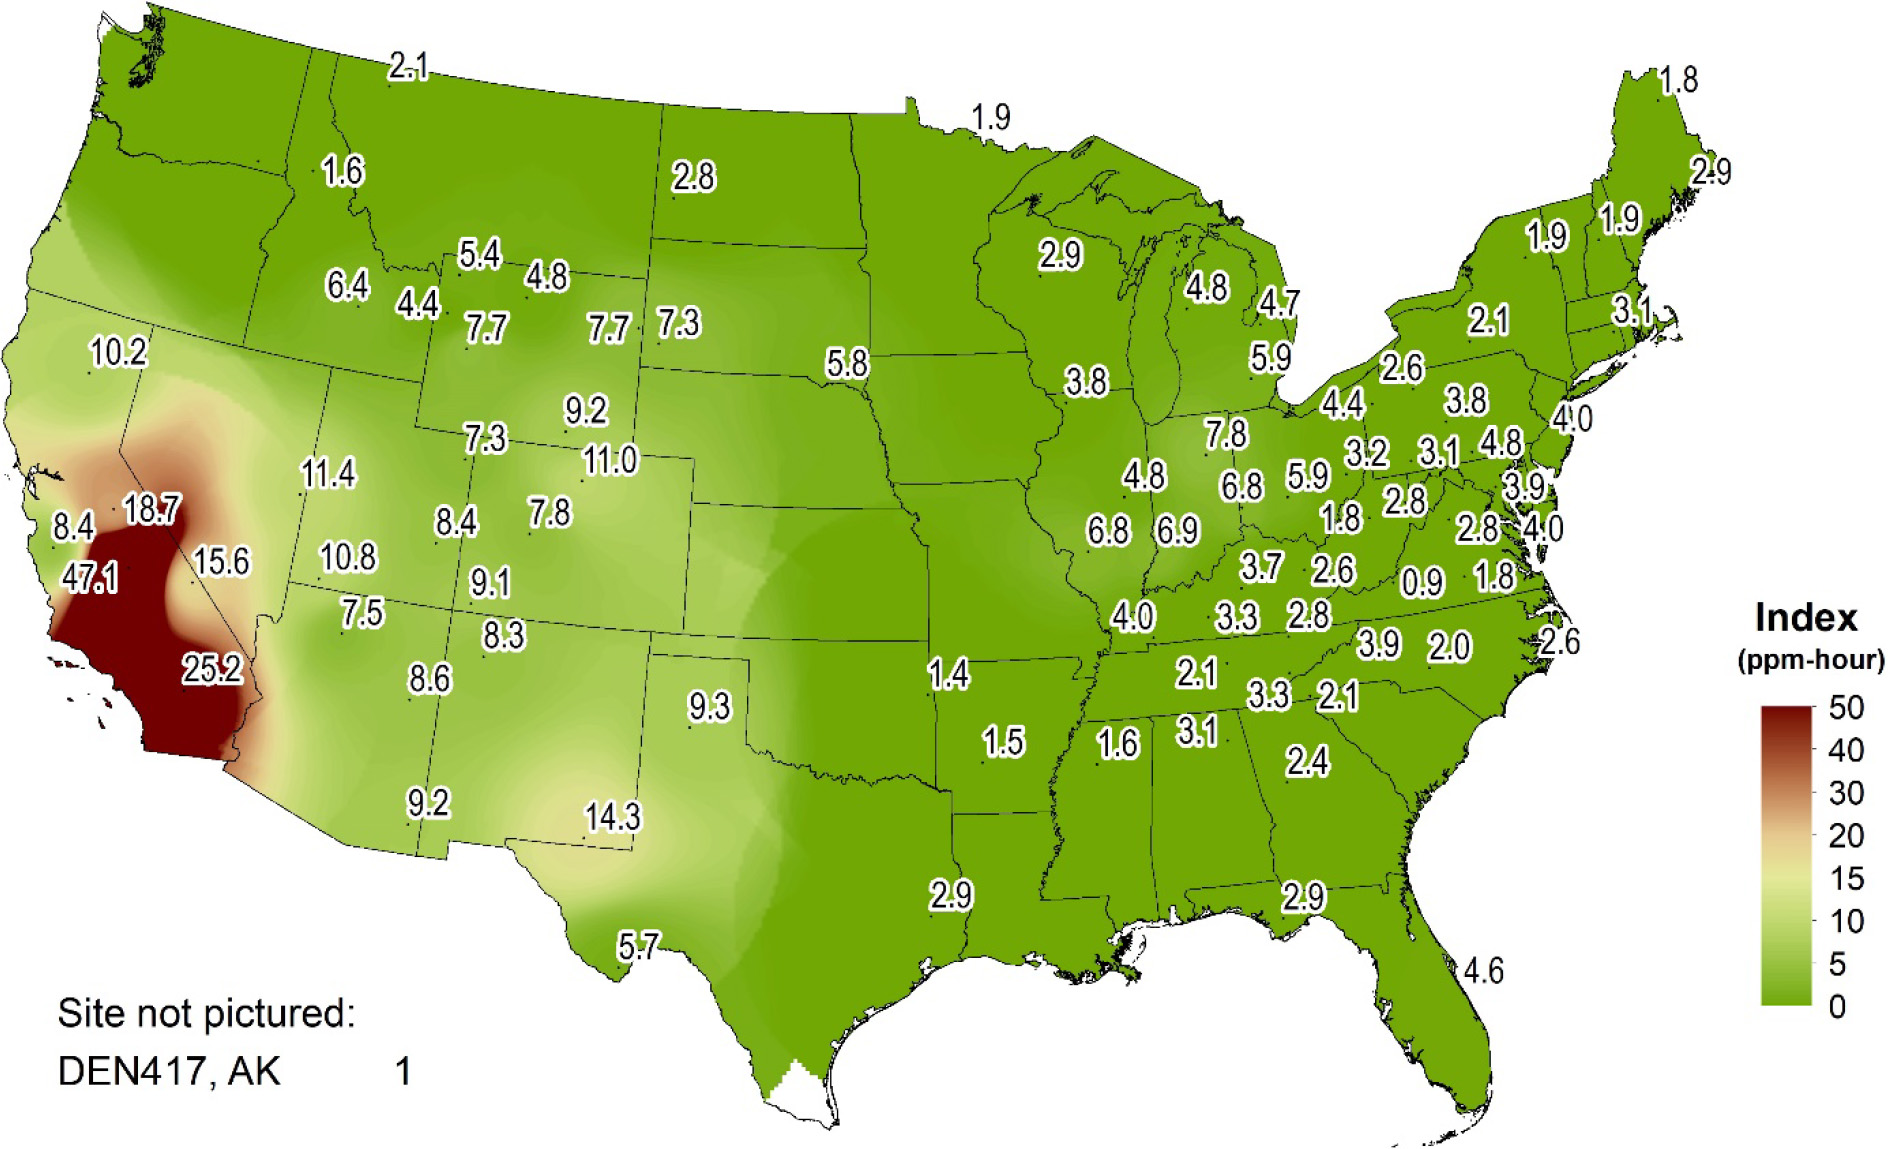
The W126 O3 exposure index is a cumulative peak-weighted exposure index (Lefohn and Runeckles, 1987) for relating reduced tree growth and crop yields to O3 exposure. W126 was developed as a seasonal measure from the sum of weighted hourly values measured during the approximately 12-hour daylight period during the growing season with the higher hourly concentrations being weighted more heavily than lower concentrations. The maximum W126 index was calculated following EPA’s methodology for this report. W126 is used to characterize high O3 concentrations over a seasonal, consecutive 3-month exposure period.
Vegetative sensitivity to O3 varies between and within species. For reference, a W126 index value of 17 ppm could result in approximately a 7.6 percent relative yield loss of soybeans or a 35.6 percent relative biomass loss of black cherry trees per year.
A map with the maximum rolling 3-month W126 values for CASTNET sites for 2020 is presented in Figure 6. The higher W126 values were measured in California and at western sites in high terrain. The highest W126 value (47.1 ppm-hour) was measured at SEK430, CA. The persistence of moderate O3 concentrations at night in high terrain produces steady exposure and high daytime W126 levels (Talbot et al., 2005)
Nitrogen Atmospheric Concentrations
Annual mean concentrations of total NO3- (HNO3 + NO3-), NH4+ , and NH3 for 2020 are presented in three maps. Trends in annual mean concentrations of total NO3- and NH4+ over the 31-year period, 1990 through 2020, were calculated from the eastern reference sites and for the 25-year period, 1996 through 2020, from the western reference sites. Trends in NH3 were estimated from AMoN data from 2008 through 2020.
Trace-level gas analyzers measured NOy at six EPA-sponsored and two NPS-sponsored CASTNET sites during 2020. These are presented at the end of this section.
Total Nitrate Concentrations
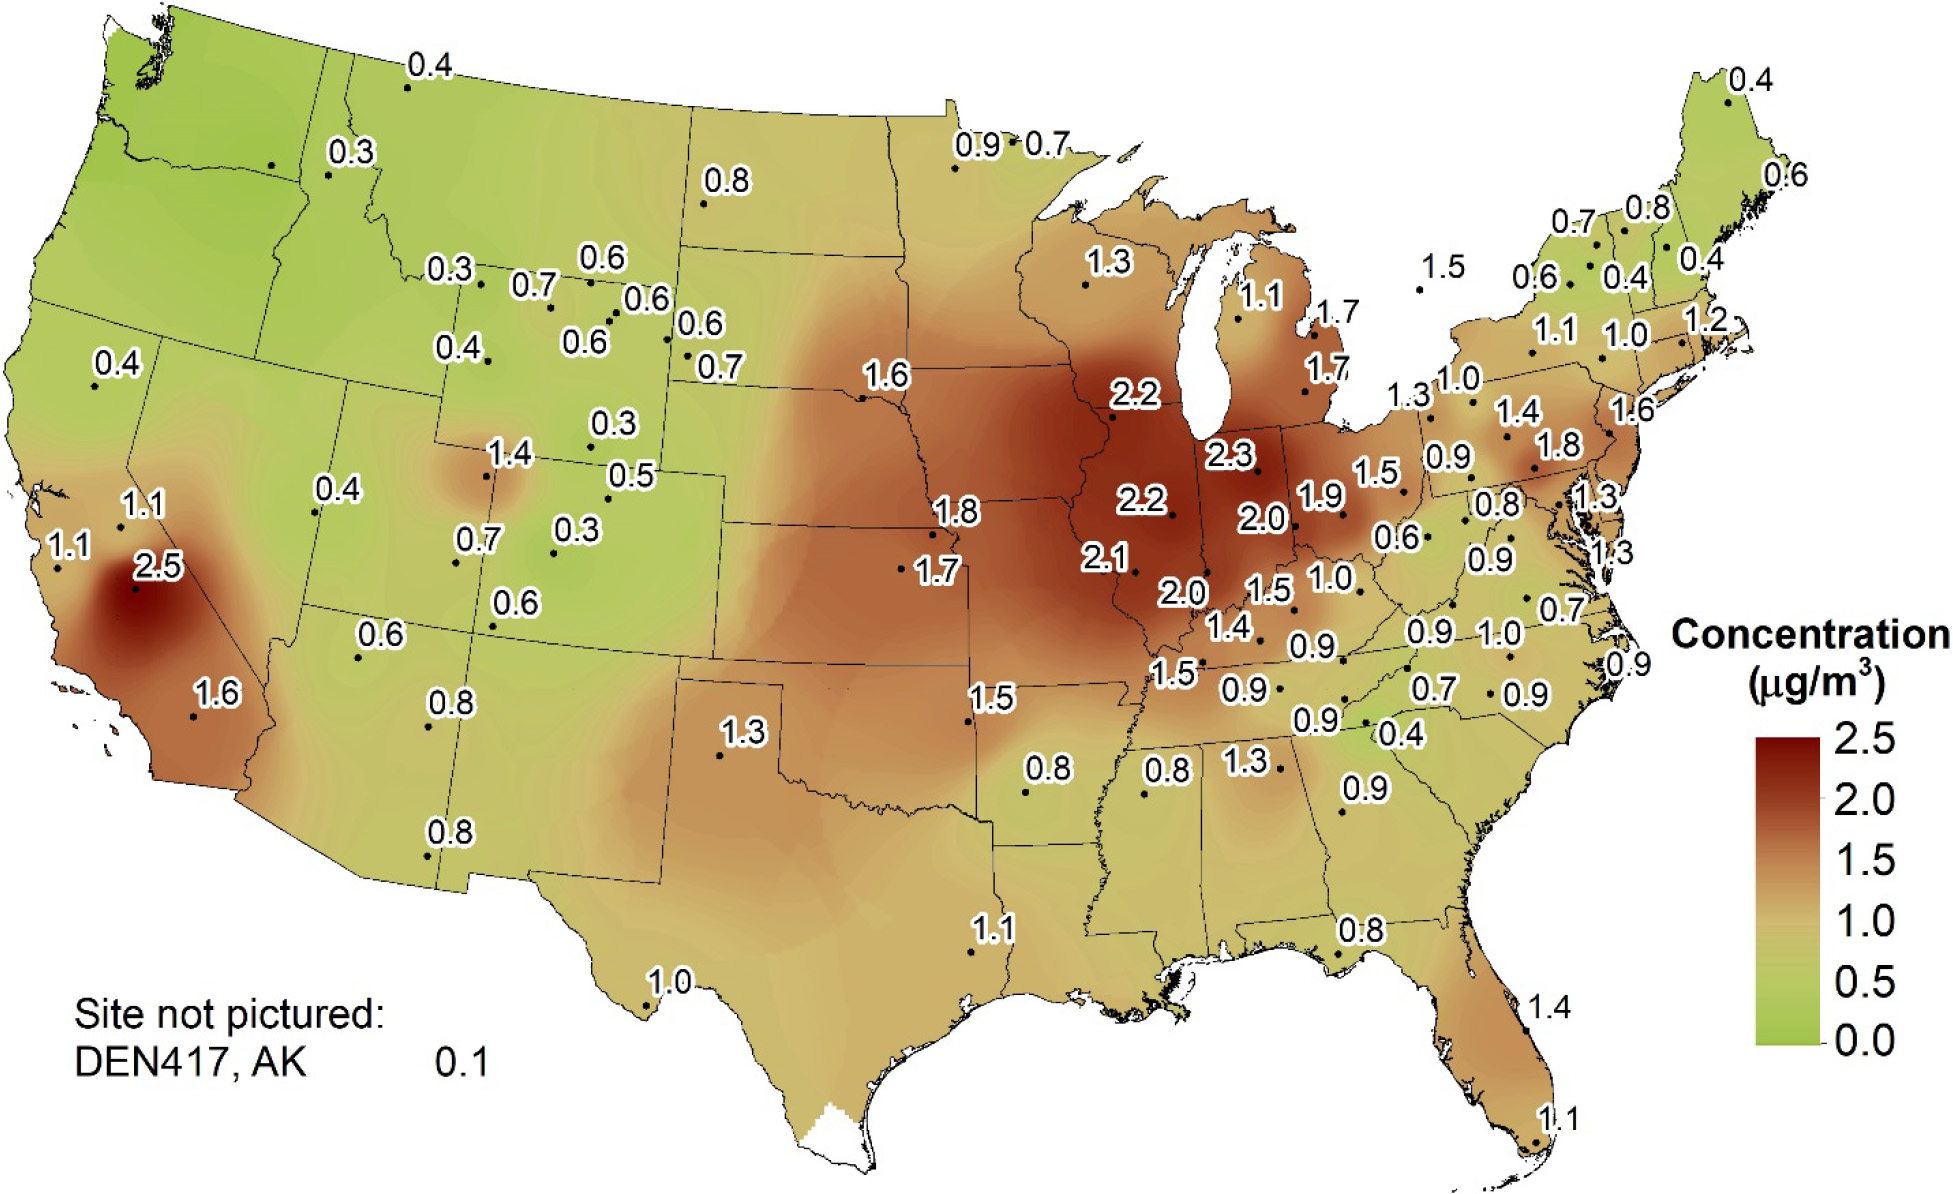
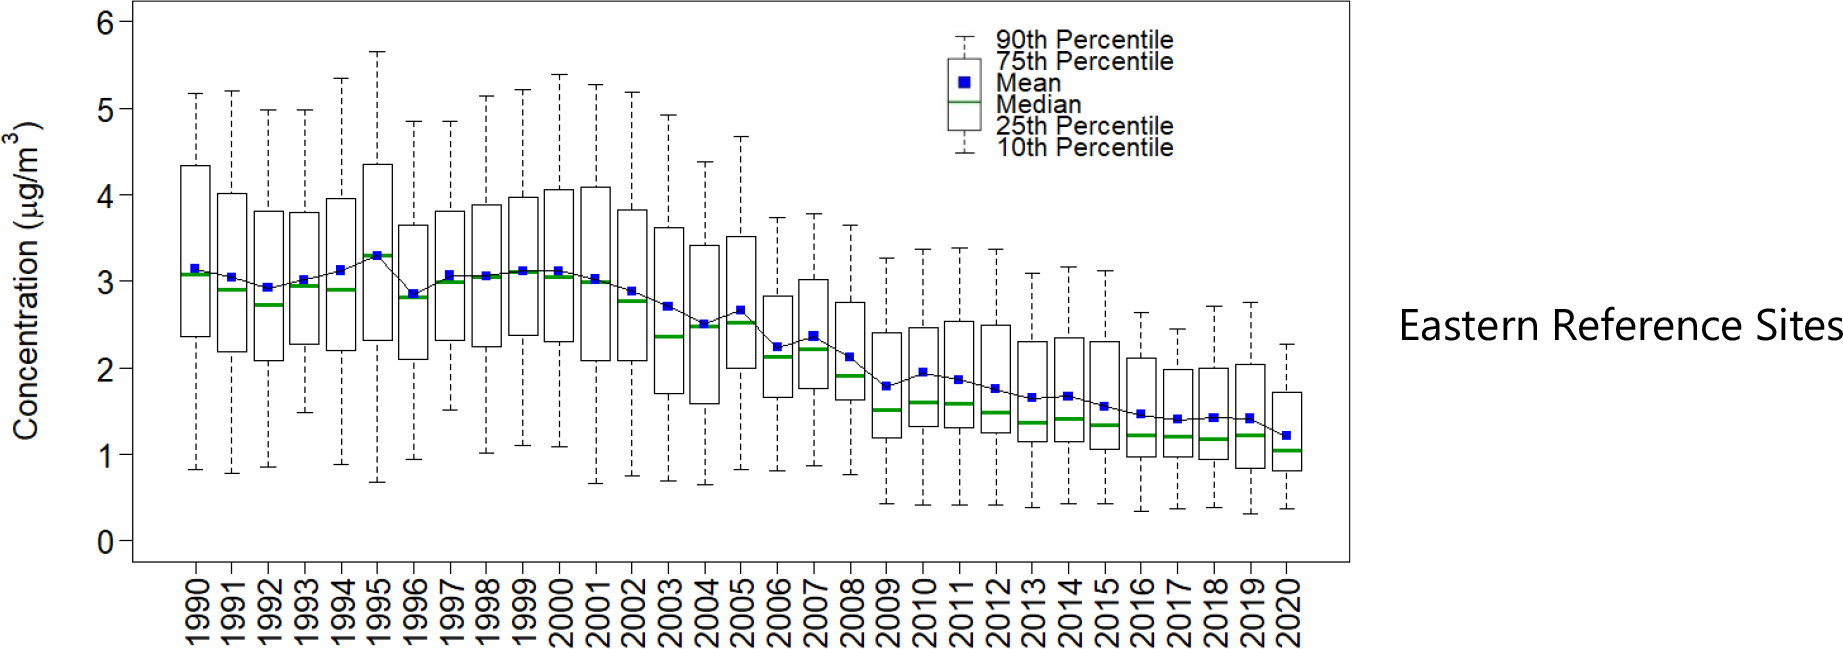
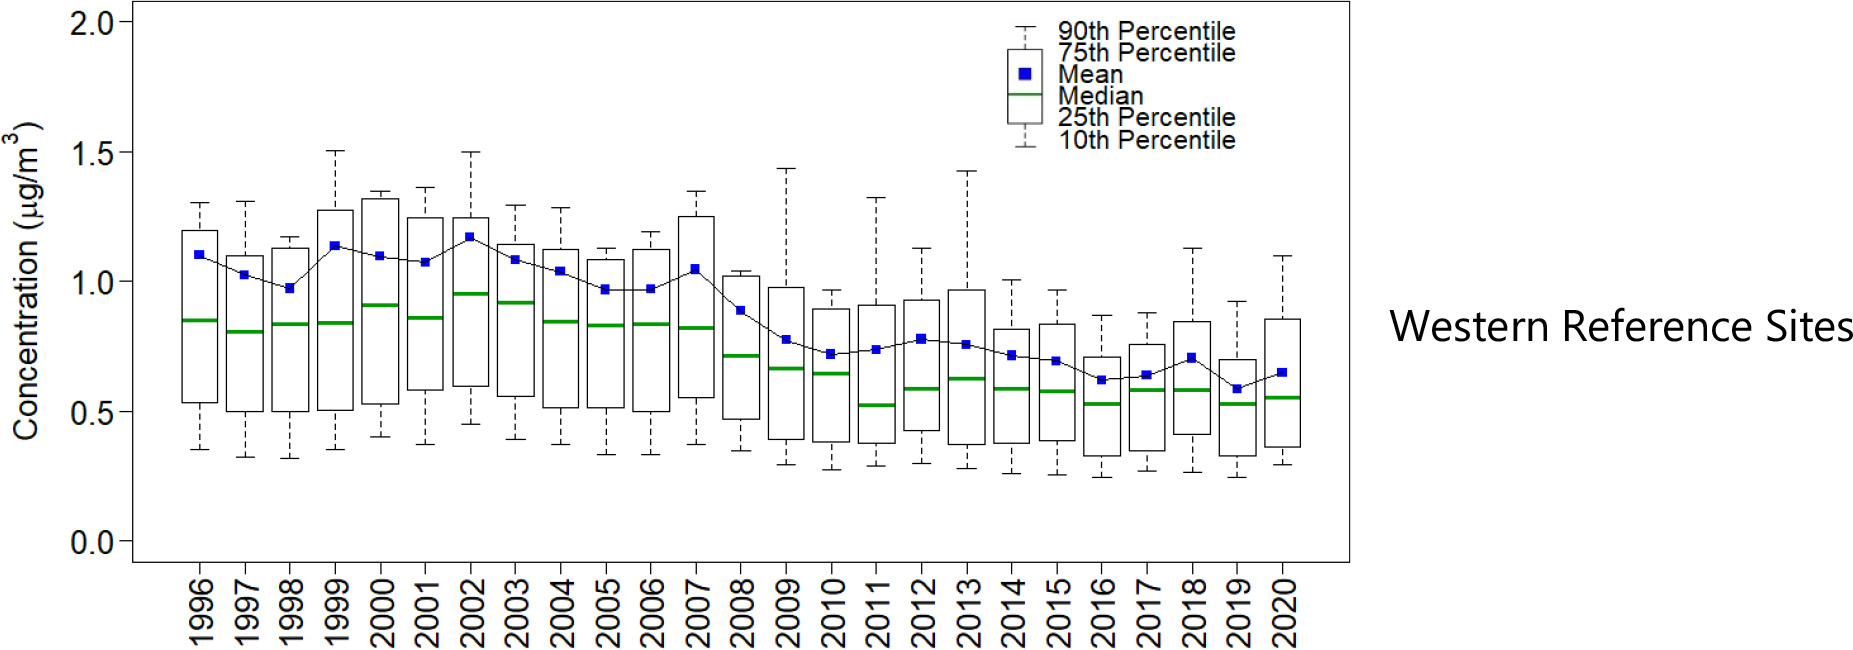
Annual mean total NO3- concentrations measured in 2020 are presented in the map in Figure 7. The site operated by the Confederated Tribes of Umatilla Indian Reservation in Washington (UMA009) did not begin operating until November 2020. It appears as a dot with no value on the various concentration maps since it did not meet the completeness criterion for 2020. To illustrate trends, Figure 8 provides box plots of total NO3- levels for the eastern and western reference sites through 2020.
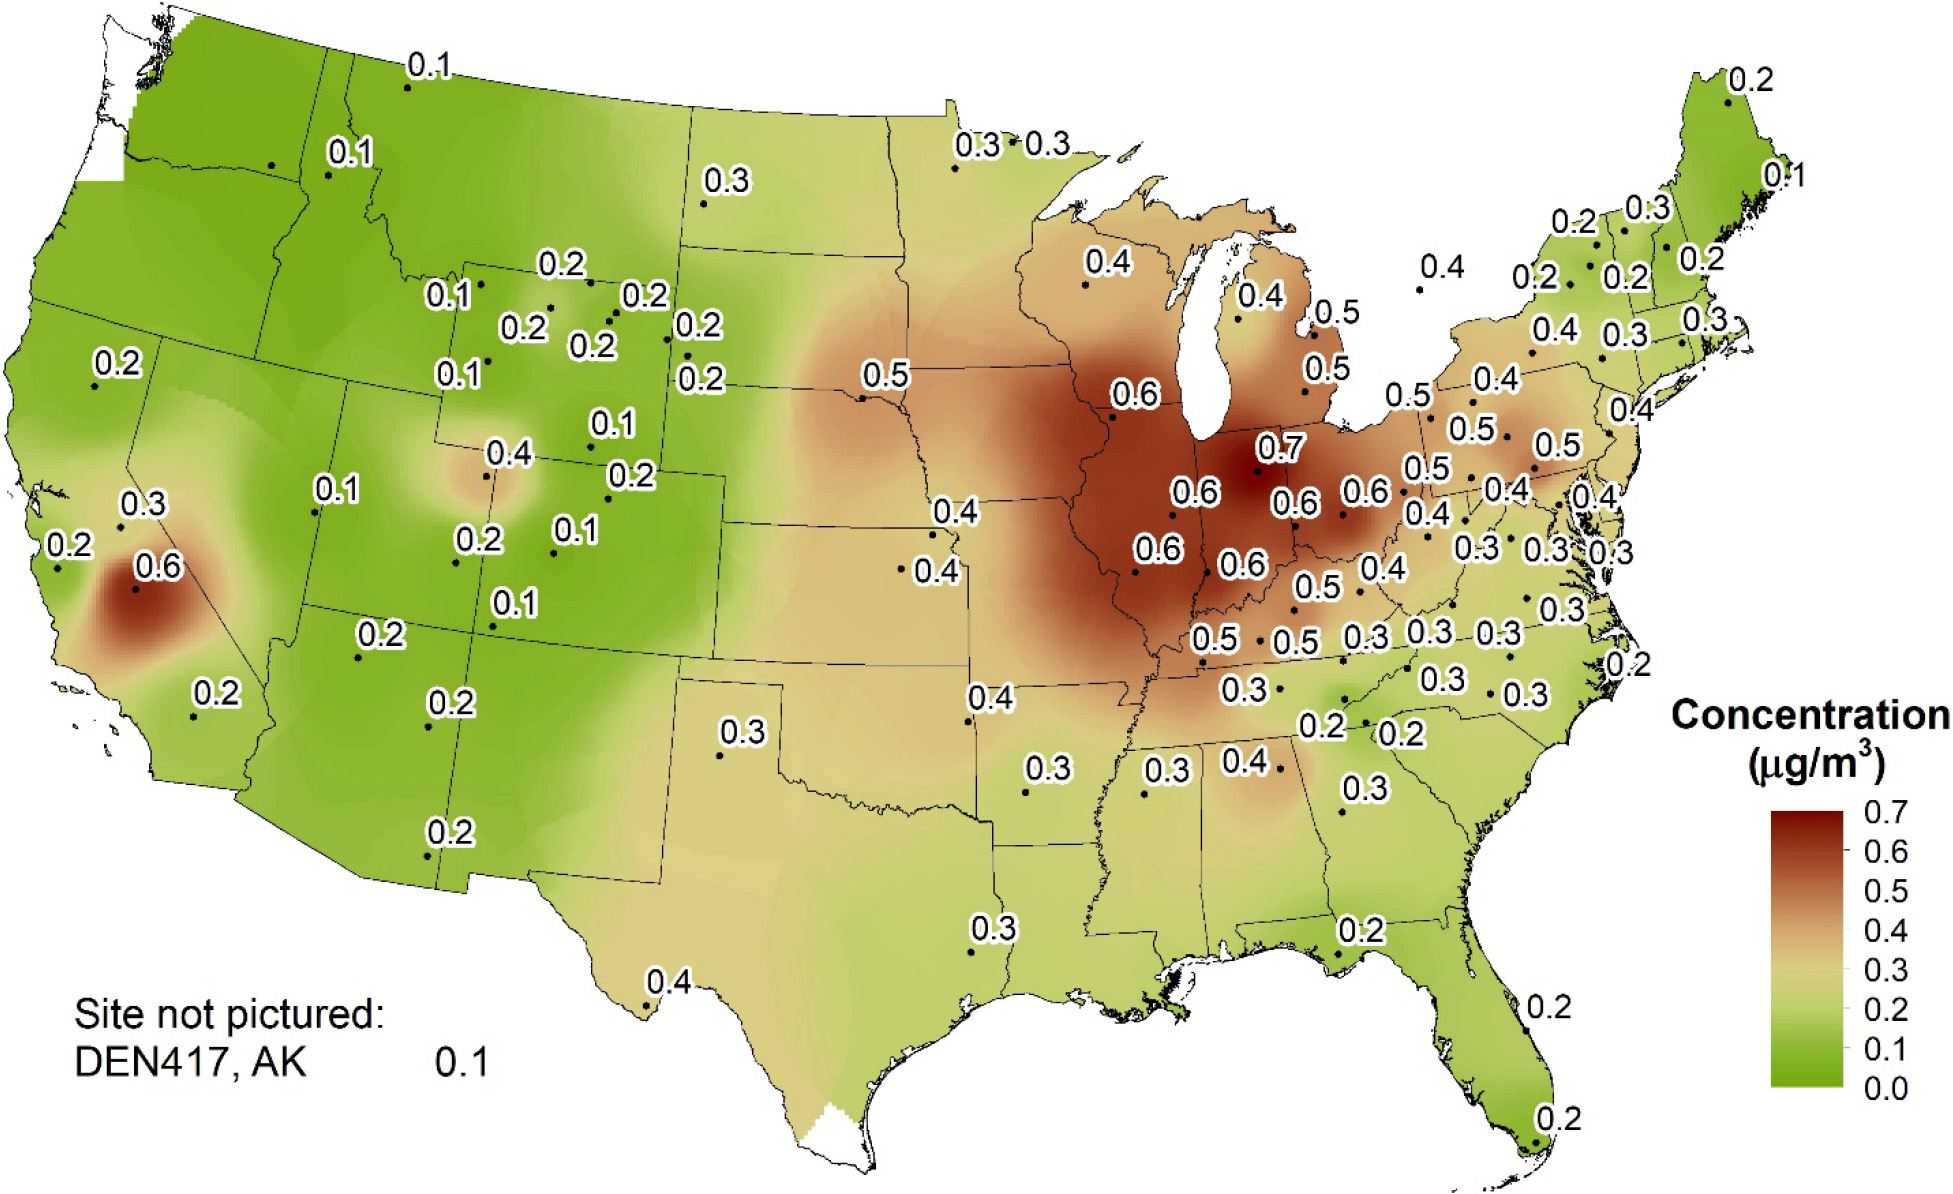
Particulate Ammonium Concentrations
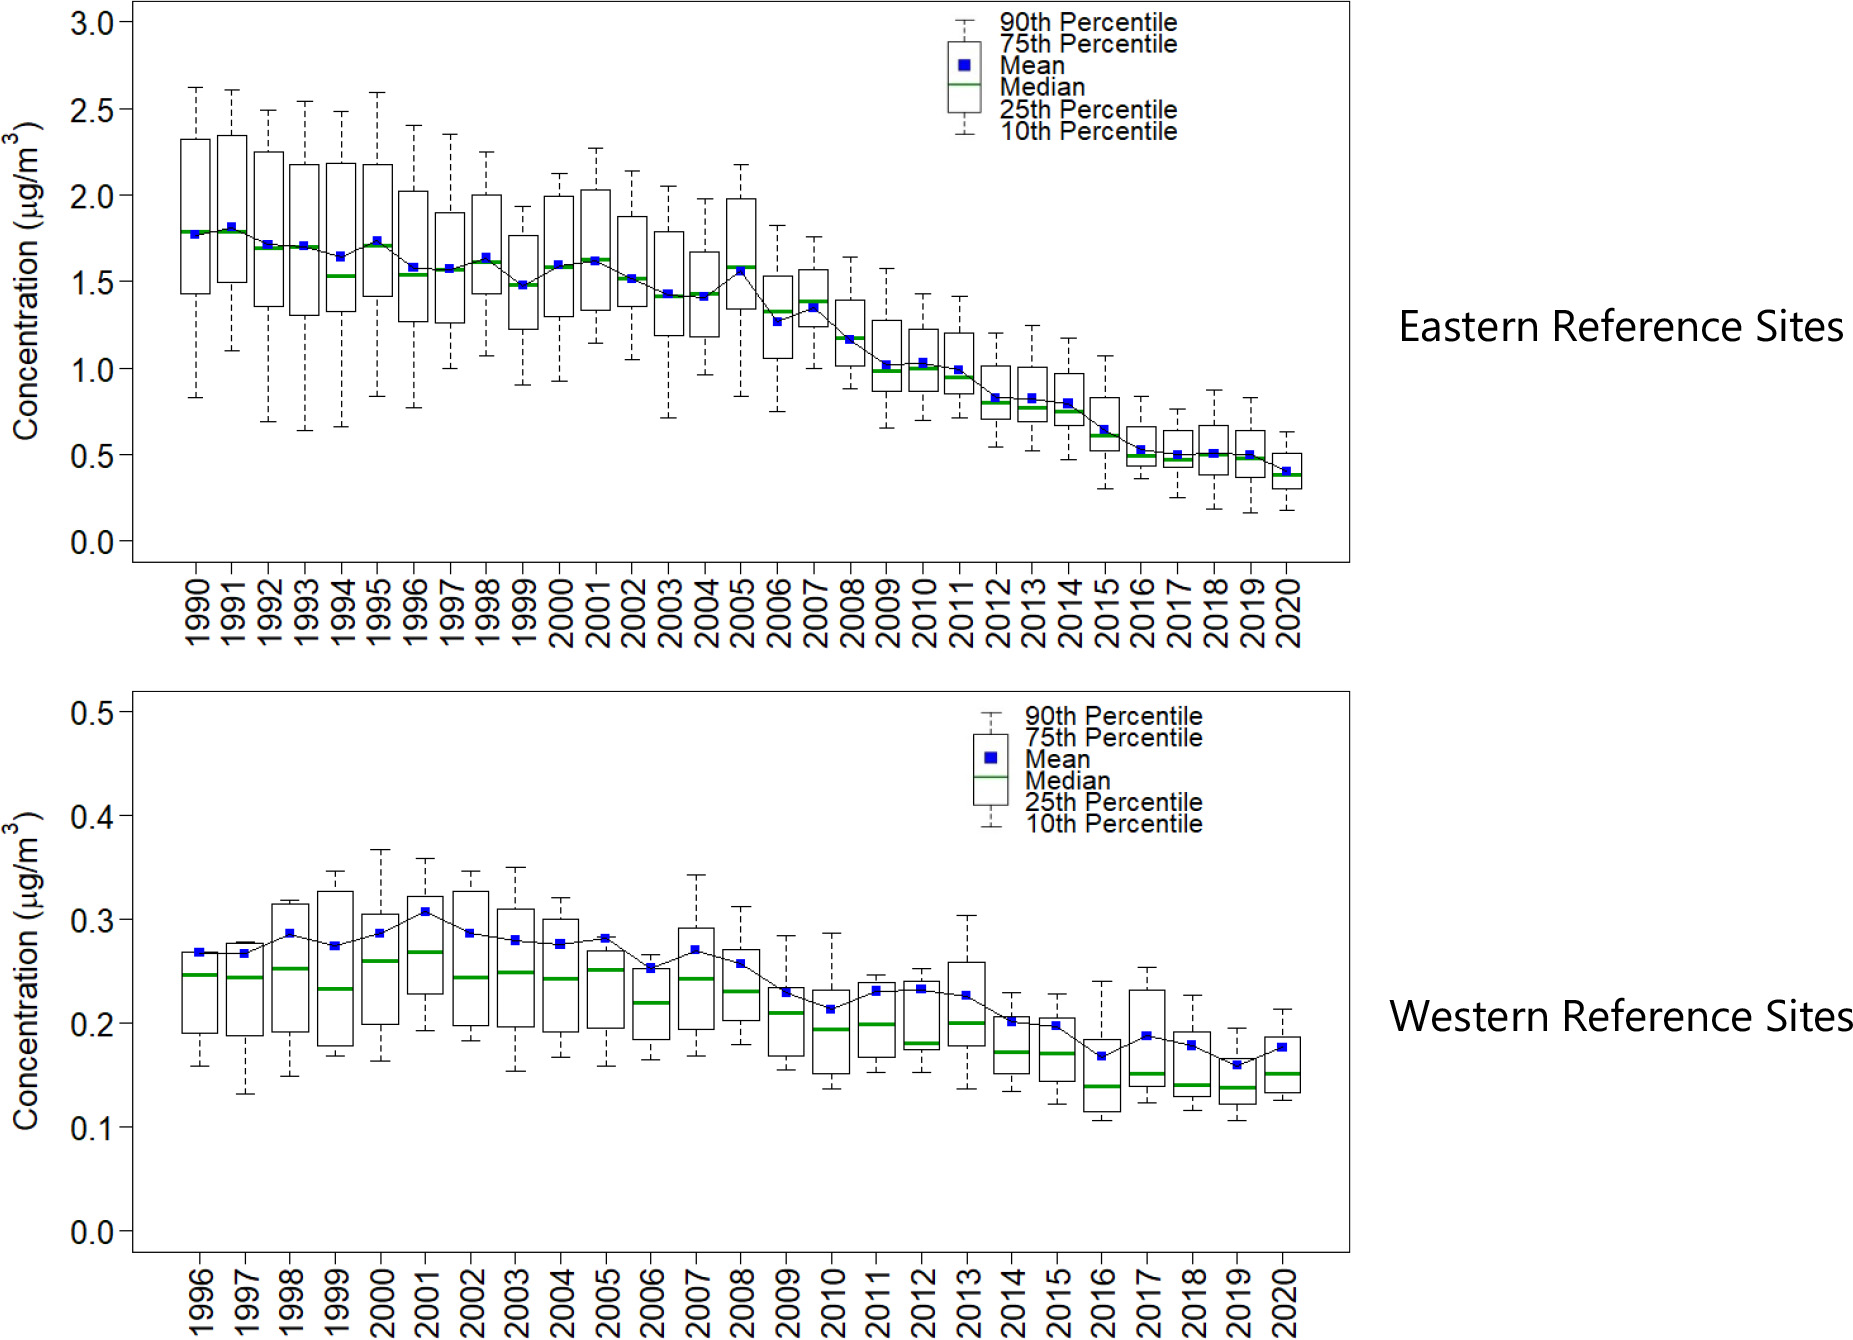
A map of 2020 annual mean particulate NH4+ concentrations is provided in Figure 9. Figure 10 shows box plots of NH4+ concentrations.
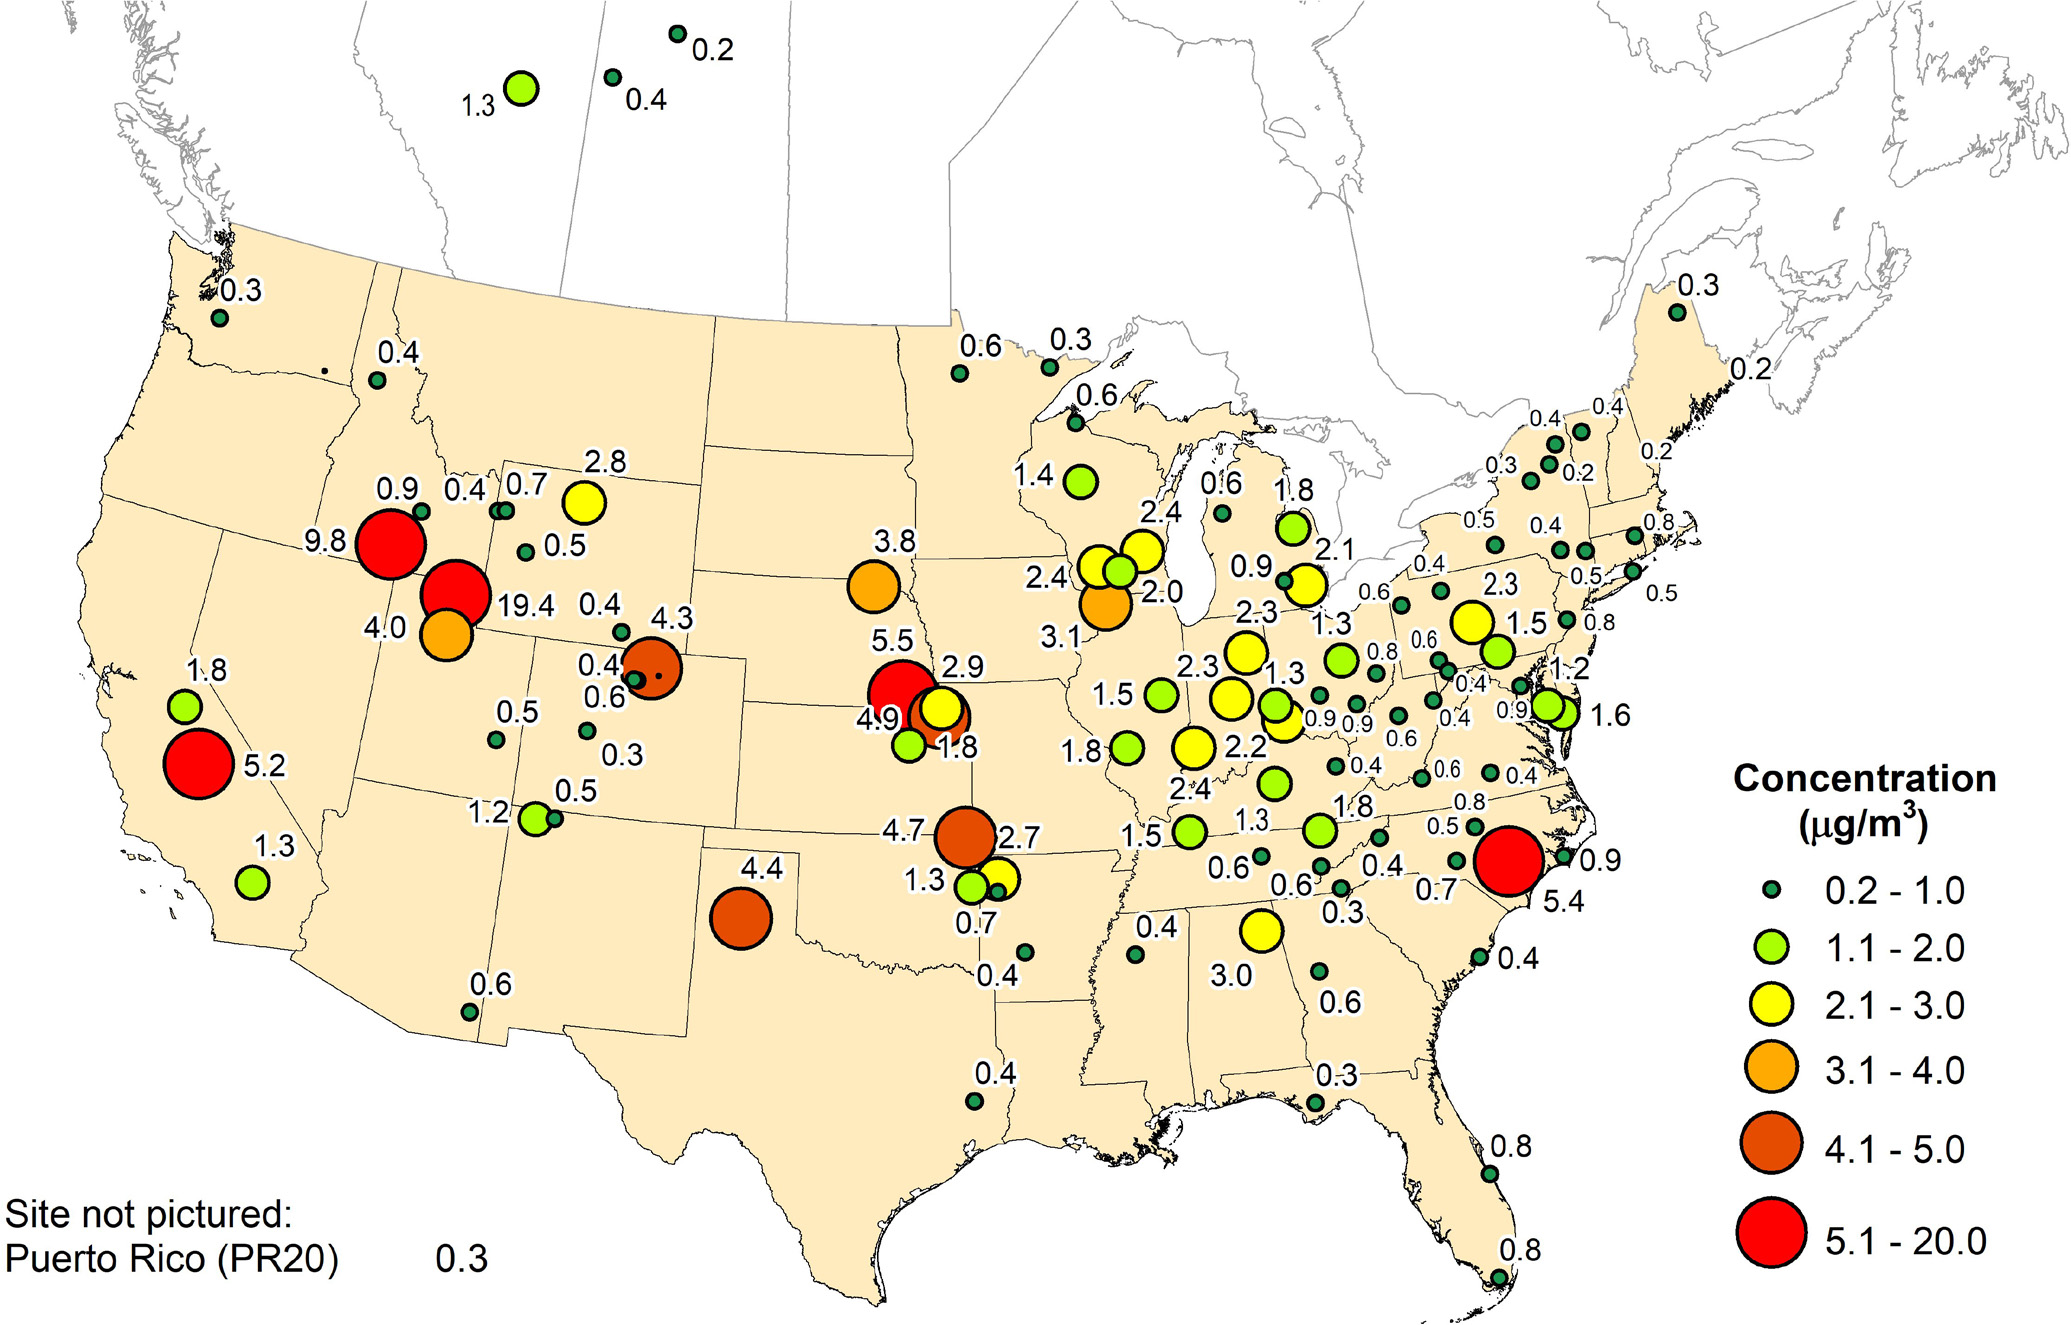
Ammonia Concentrations
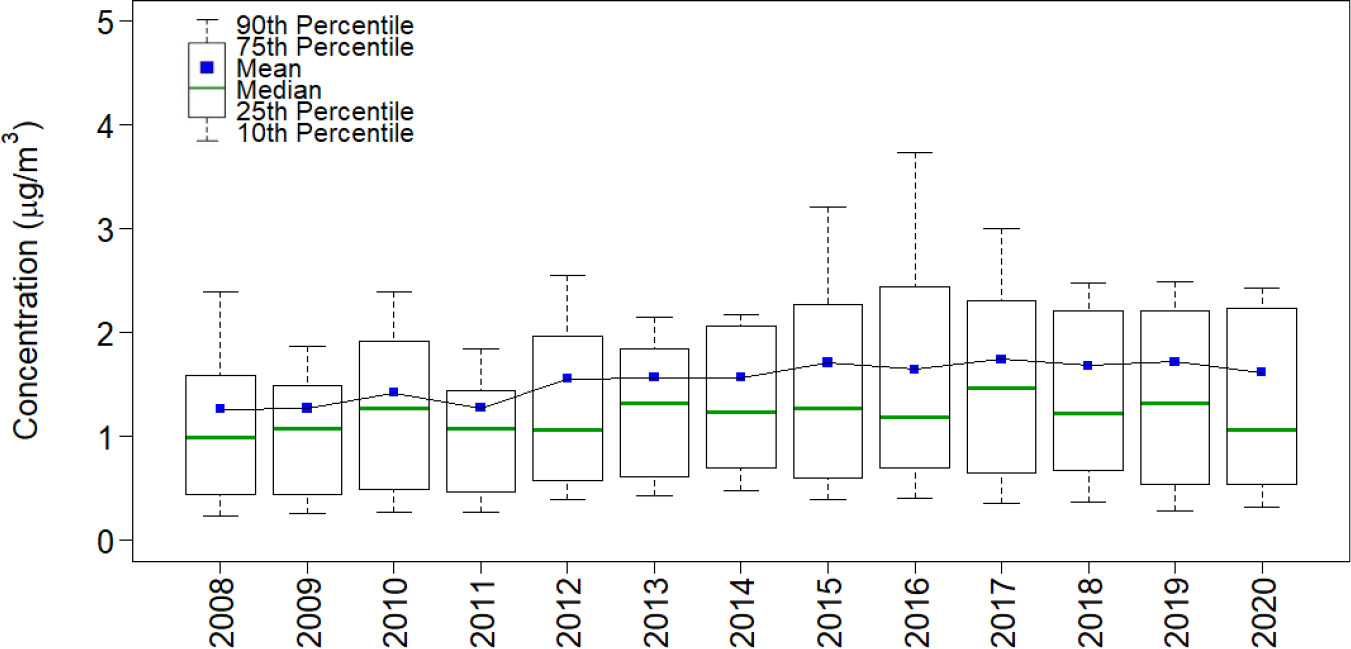
Annual mean NH3 concentrations for 2020 from NADP/AMoN sites that met completeness requirements are mapped in Figure 11. Trends from NADP/AMoN sites that were active from 2008 through 2020 are shown in Figure 12.
Continuous Trace-level NOy and Filter Pack Total Nitrate Concentrations
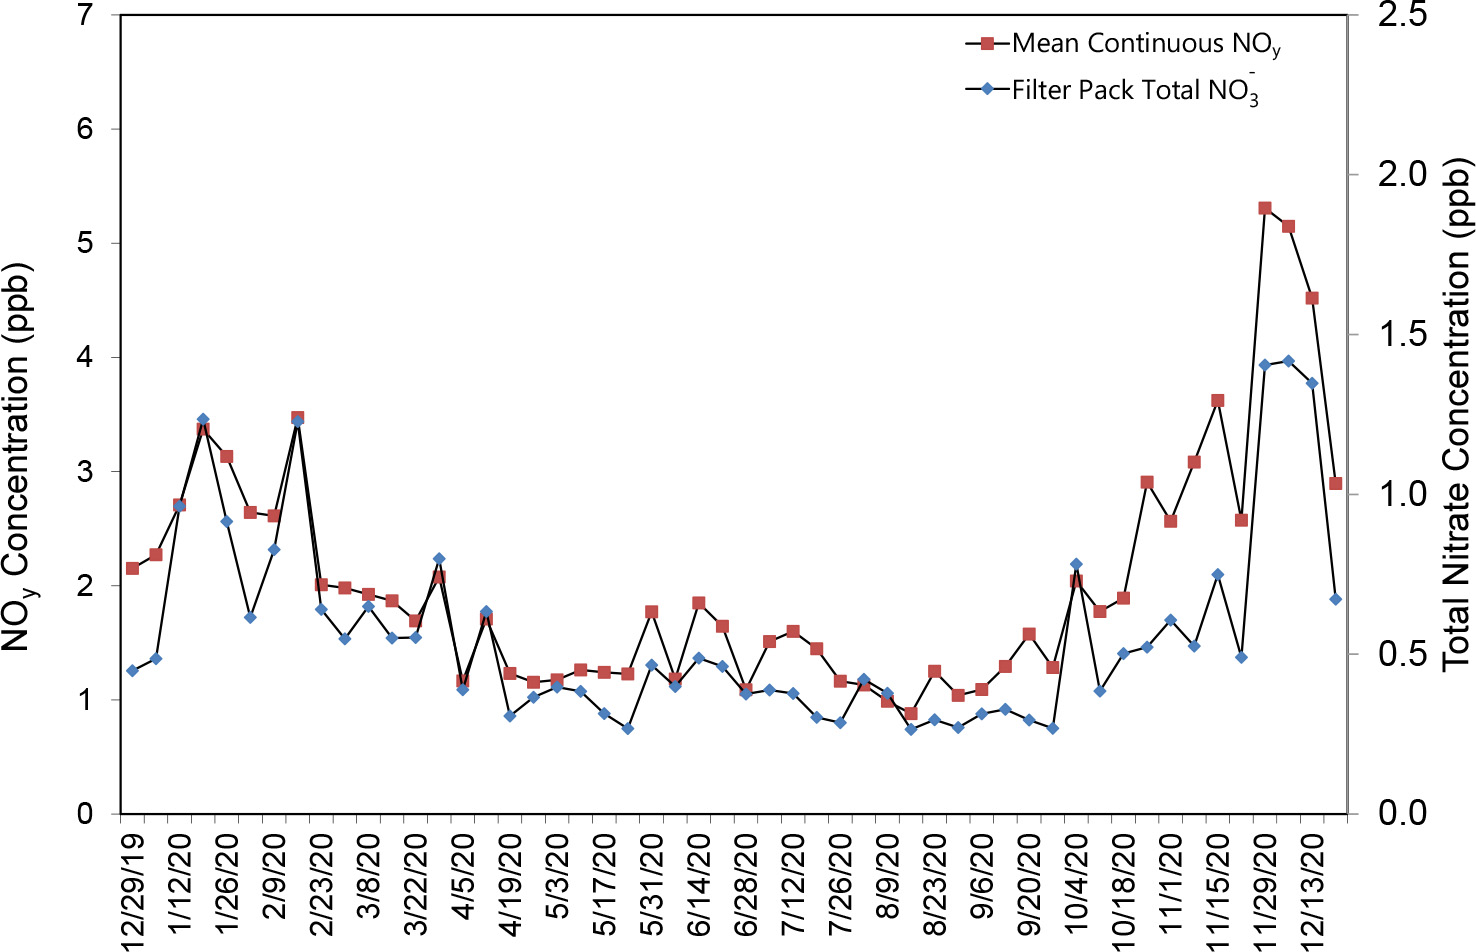
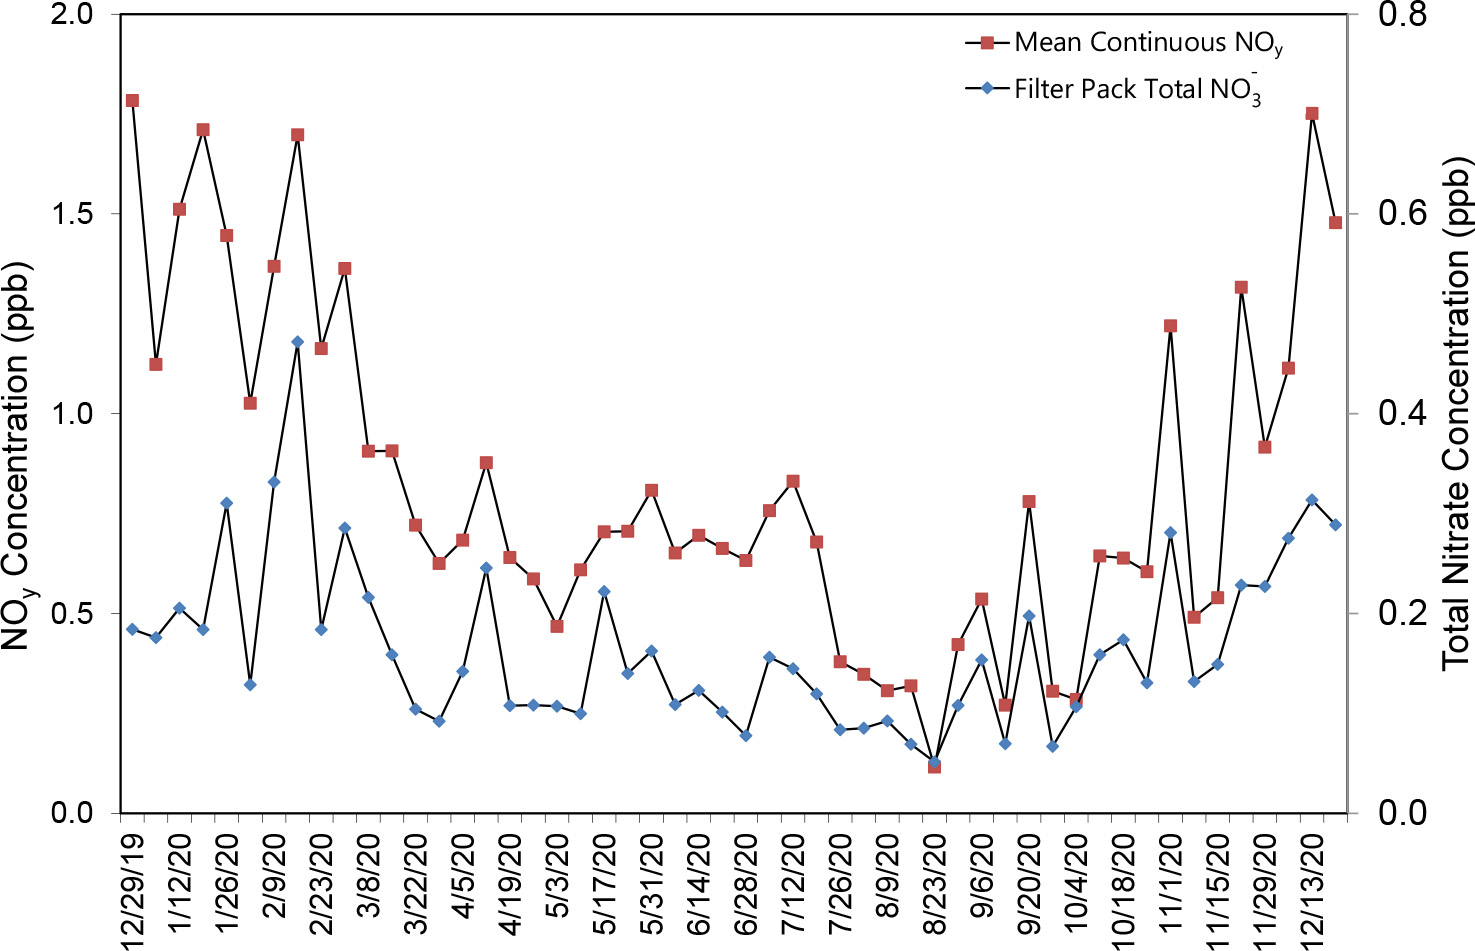
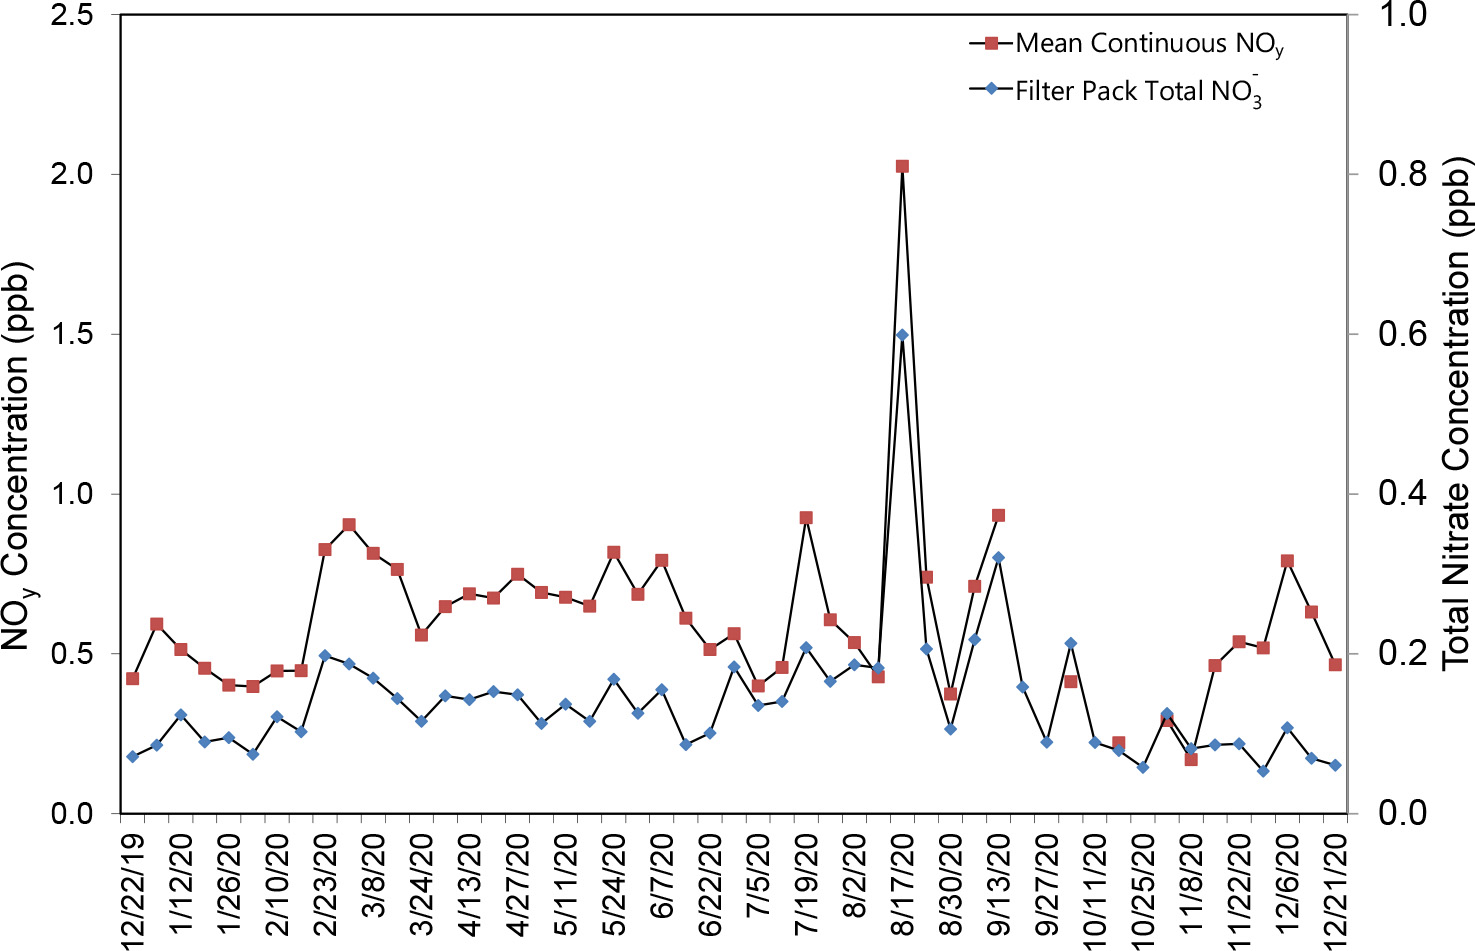
Nitric acid and particulate NO3- are measured on CASTNET filter packs, and the sum is reported as total NO3-. NOy is defined as NOx (NO + nitrogen dioxide) plus NOz (HNO3, nitrous acid, peroxyacetyl nitrate, peroxyproyl nitrate, other organic nitrates, and nitrite). It consists of reactive gases that are considered precursors of O3 and fine particulate matter (PM2.5). Because HNO3 and particulate NO3- are measured as components of NOy, NOy concentrations should always be higher than total NO3- levels (i.e., the ratio of NOy to total NO3- should always be greater than 1.0). A comparison of weekly mean continuous NOy concentrations with filter pack total NO3- levels at Mackville, KY (MAC426); Huntington Wildlife Forest, NY (HWF187); and Pinedale, WY (PND165) for 2020 was used to evaluate the 2020 measurements (Figures 13 through 15). The scales for NOy and total NO3- levels are different in the three figures. The NOy concentrations were consistently higher than the total NO3- levels, as expected. The results are similar for all eight sites operating continuous NOy analyzers. The weekly total NO3- concentrations, the average weekly NOy levels, and their ratios are listed in Table 2. These were calculated as the average of all valid weekly filter pack concentrations, the average of mean NOy values matching the run time of the weekly filter packs, and the average of the ratios calculated for each week.
Figure 13 Comparison of MAC426, KY Weekly Mean Continuous Trace-level NOy and Filter Pack Total NO3- Concentrations
 Download Figure
Figure 14 Comparison of HWF187, NY Weekly Mean Continuous Trace-level NOy and Filter Pack Total NO3- Concentrations
 Download Figure
Figure 15 Comparison of PND165, WY Weekly Mean Continuous Trace-level NOy and Filter Pack Total NO3- Concentrations
 Download Figure
Table 2 Summary of Total NO3- and NOy Measurements for 2019
| Site Location | Elevation (m) | Total NO (ppb) | NOy (ppb) | Ratio |
|---|---|---|---|---|
| DUK008, NC | 164* | 0.40 | 2.27 | 6.71 |
| BVL130, IL | 213 | 0.86 | 3.94 | 5.01 |
| MAC426, KY | 243 | 0.56 | 2.04 | 3.76 |
| HWF187, NY | 497 | 0.17 | 0.83 | 5.07 |
| GRS420, TN | 793 | 0.34 | 1.60 | 4.83 |
| PNF126, NC | 1216 | 0.26 | 0.66 | 2.31 |
| PND165, WY | 2386 | 0.14 | 0.62 | 4.69 |
| ROM206, CO | 2742 | 0.20 | 1.27 | 7.33 |
Note: *The inlet for the enhanced NOy monitor is located at the top of the 30-m tower.
Sulfur Atmospheric Concentrations
Annual mean concentrations of SO2 and SO42- for 2020 are presented in this section. Trends in annual mean concentrations are also shown.
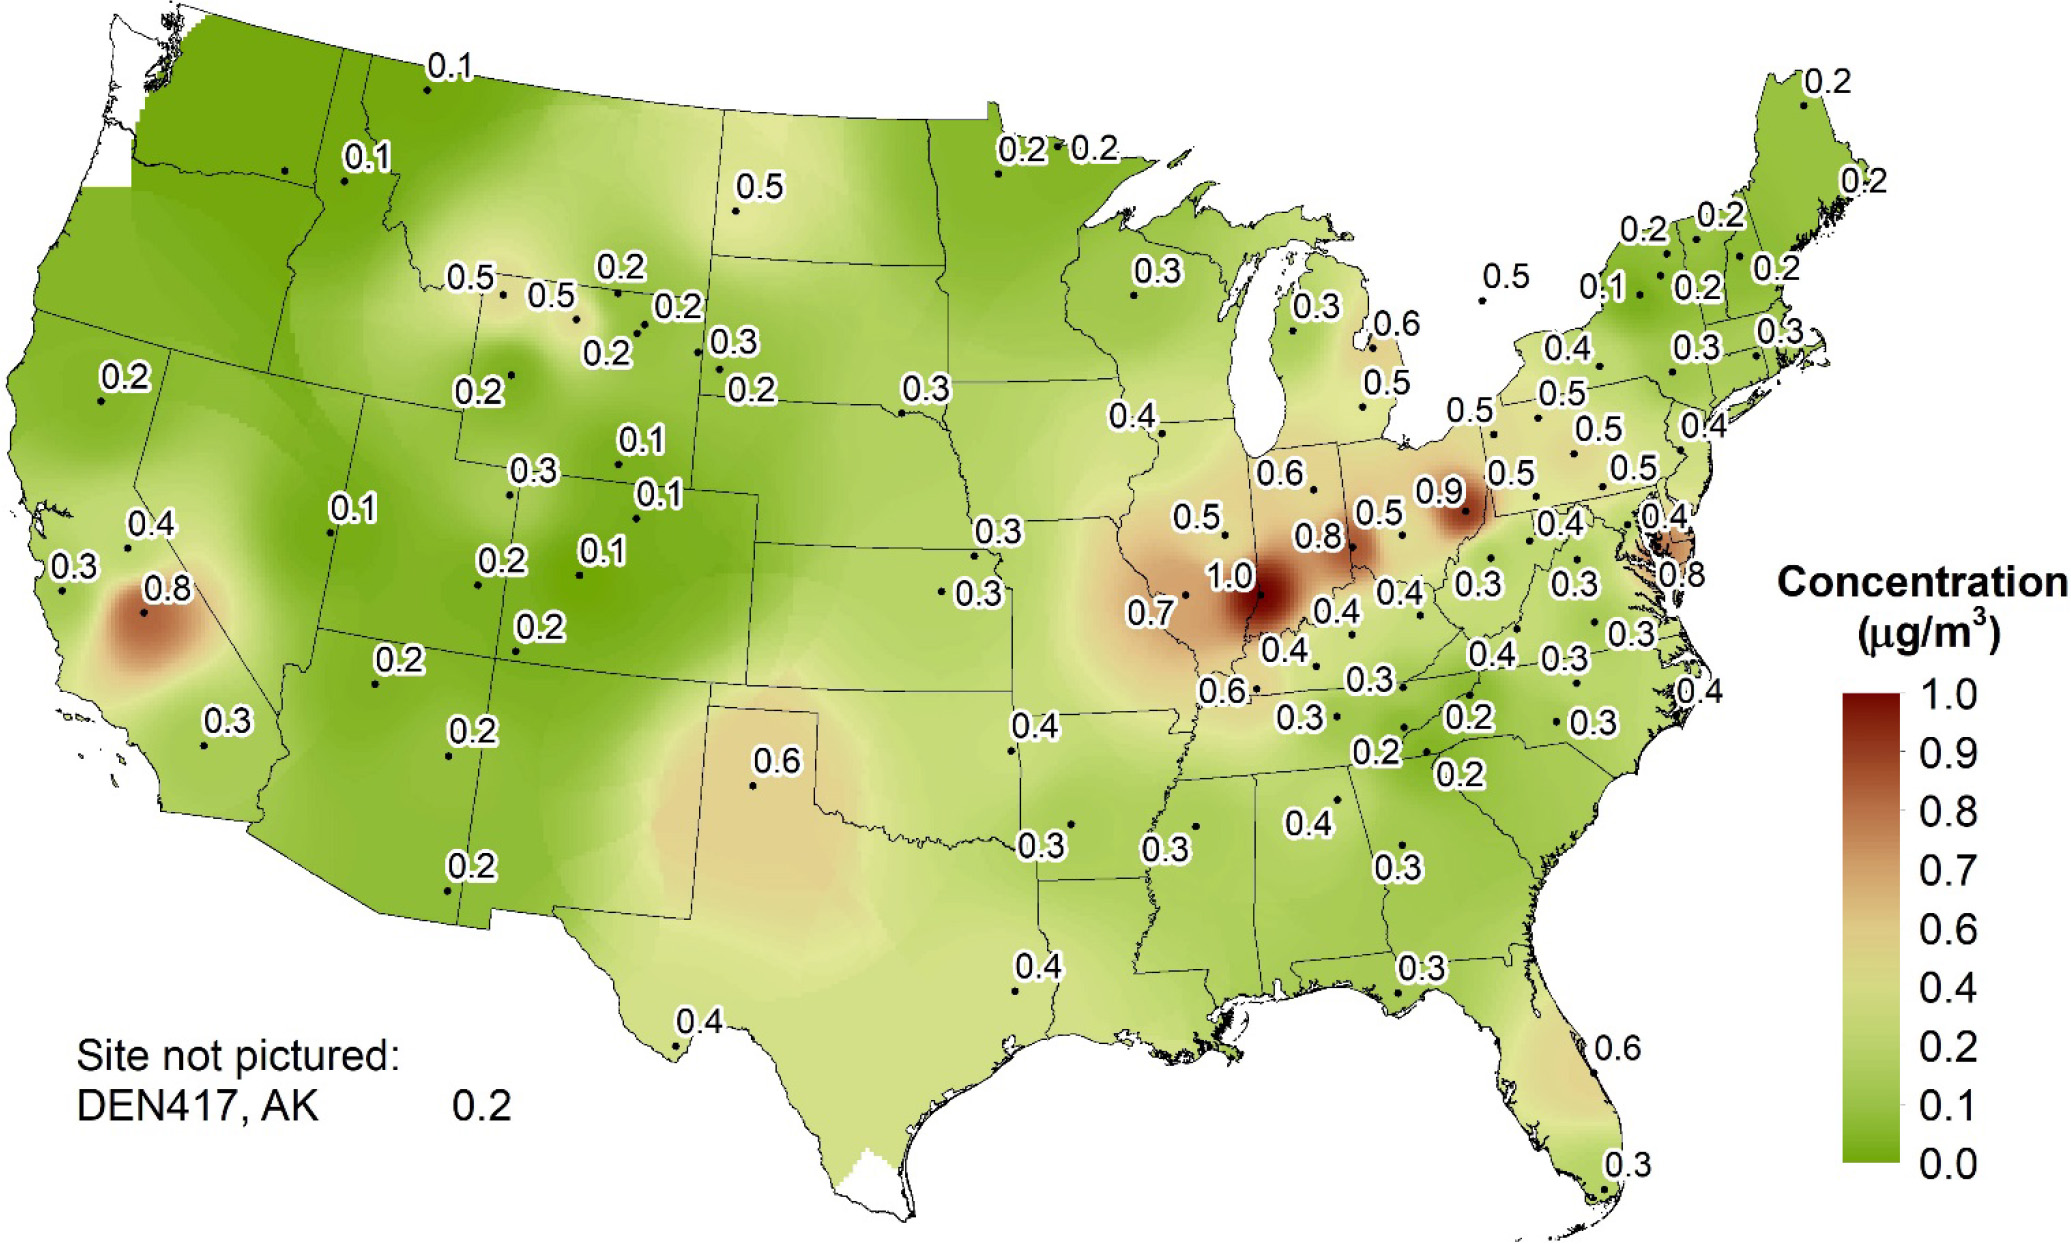
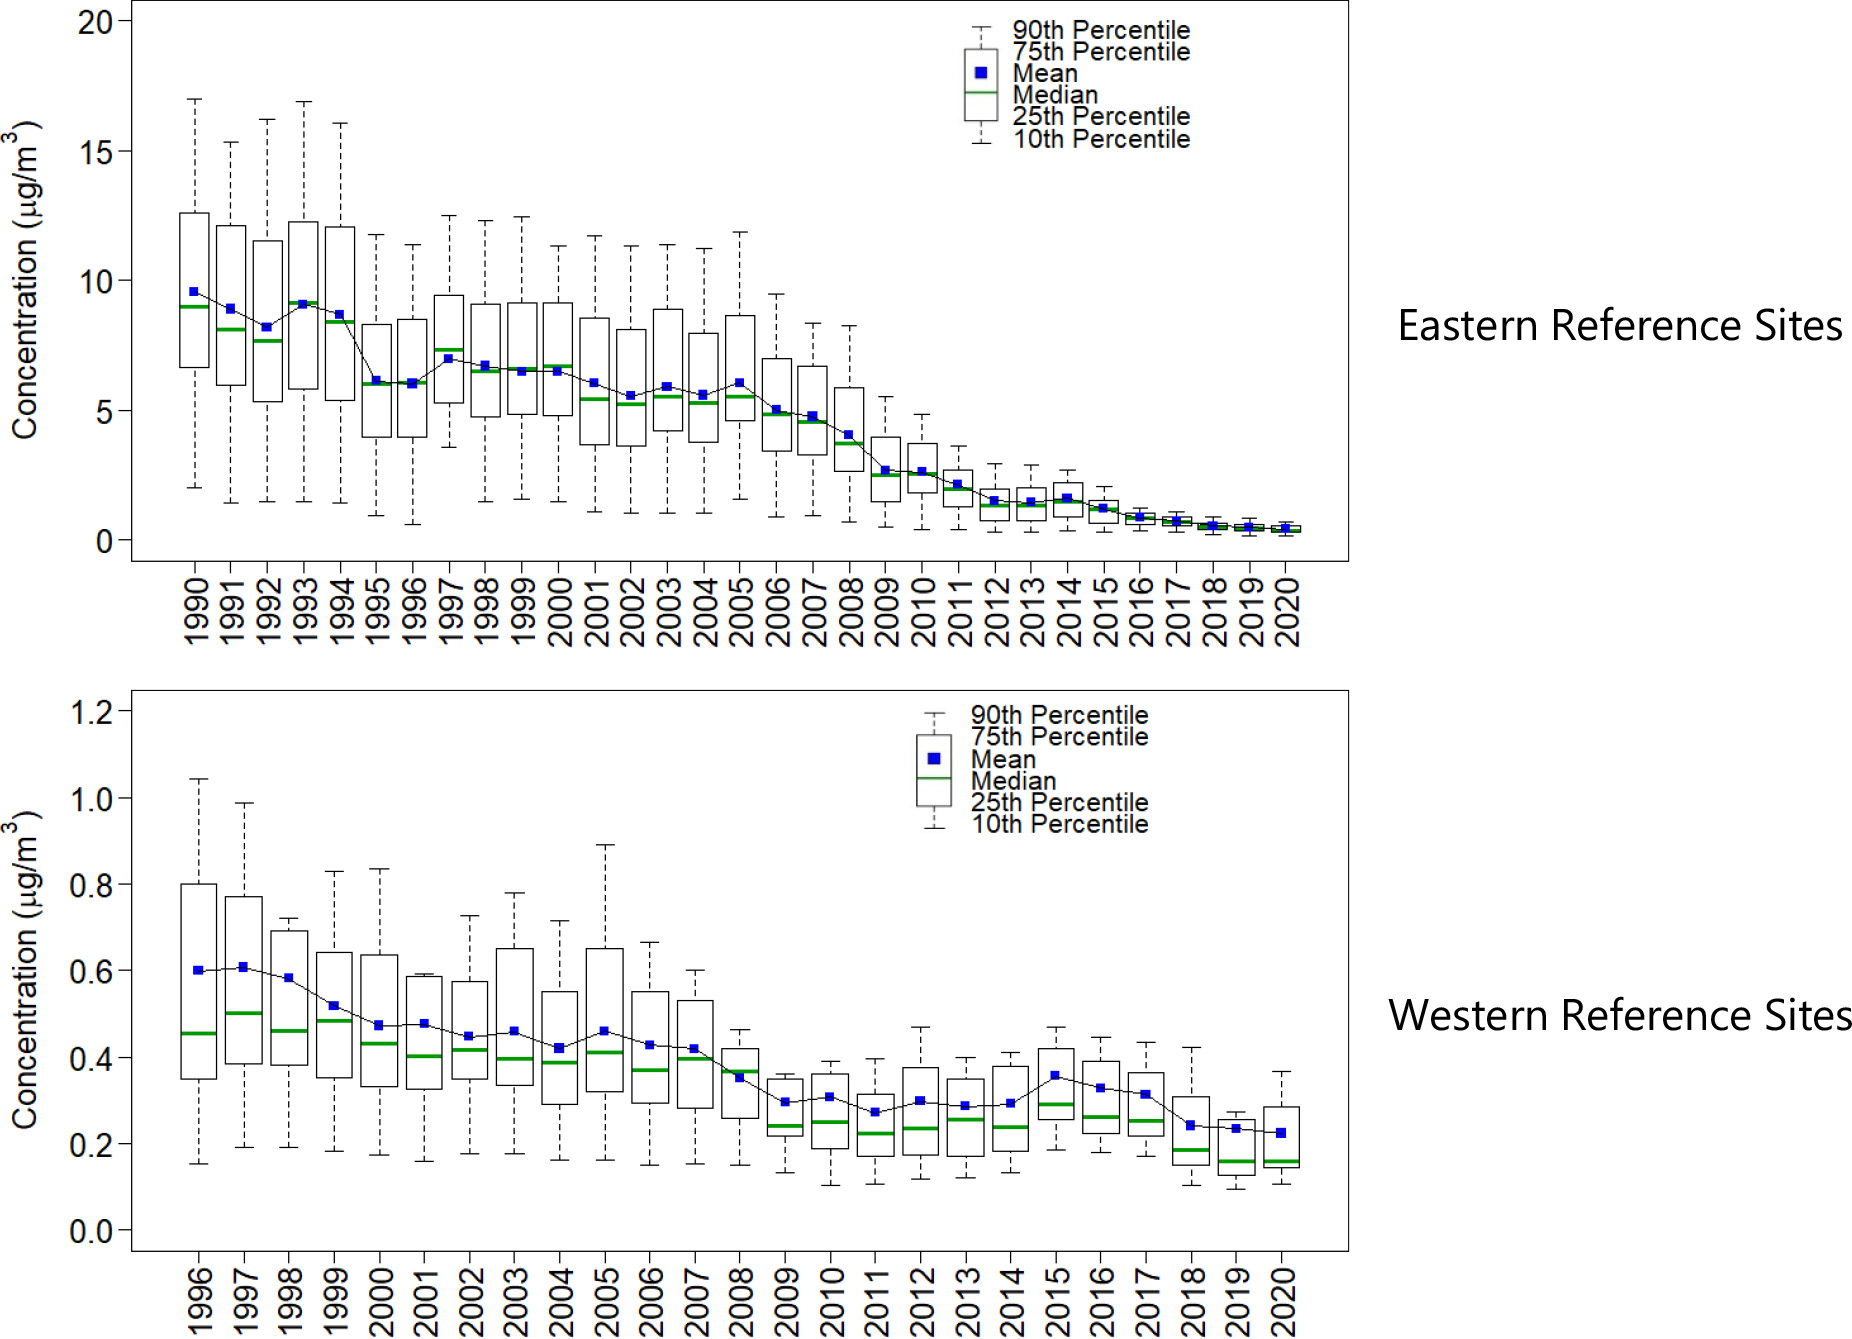
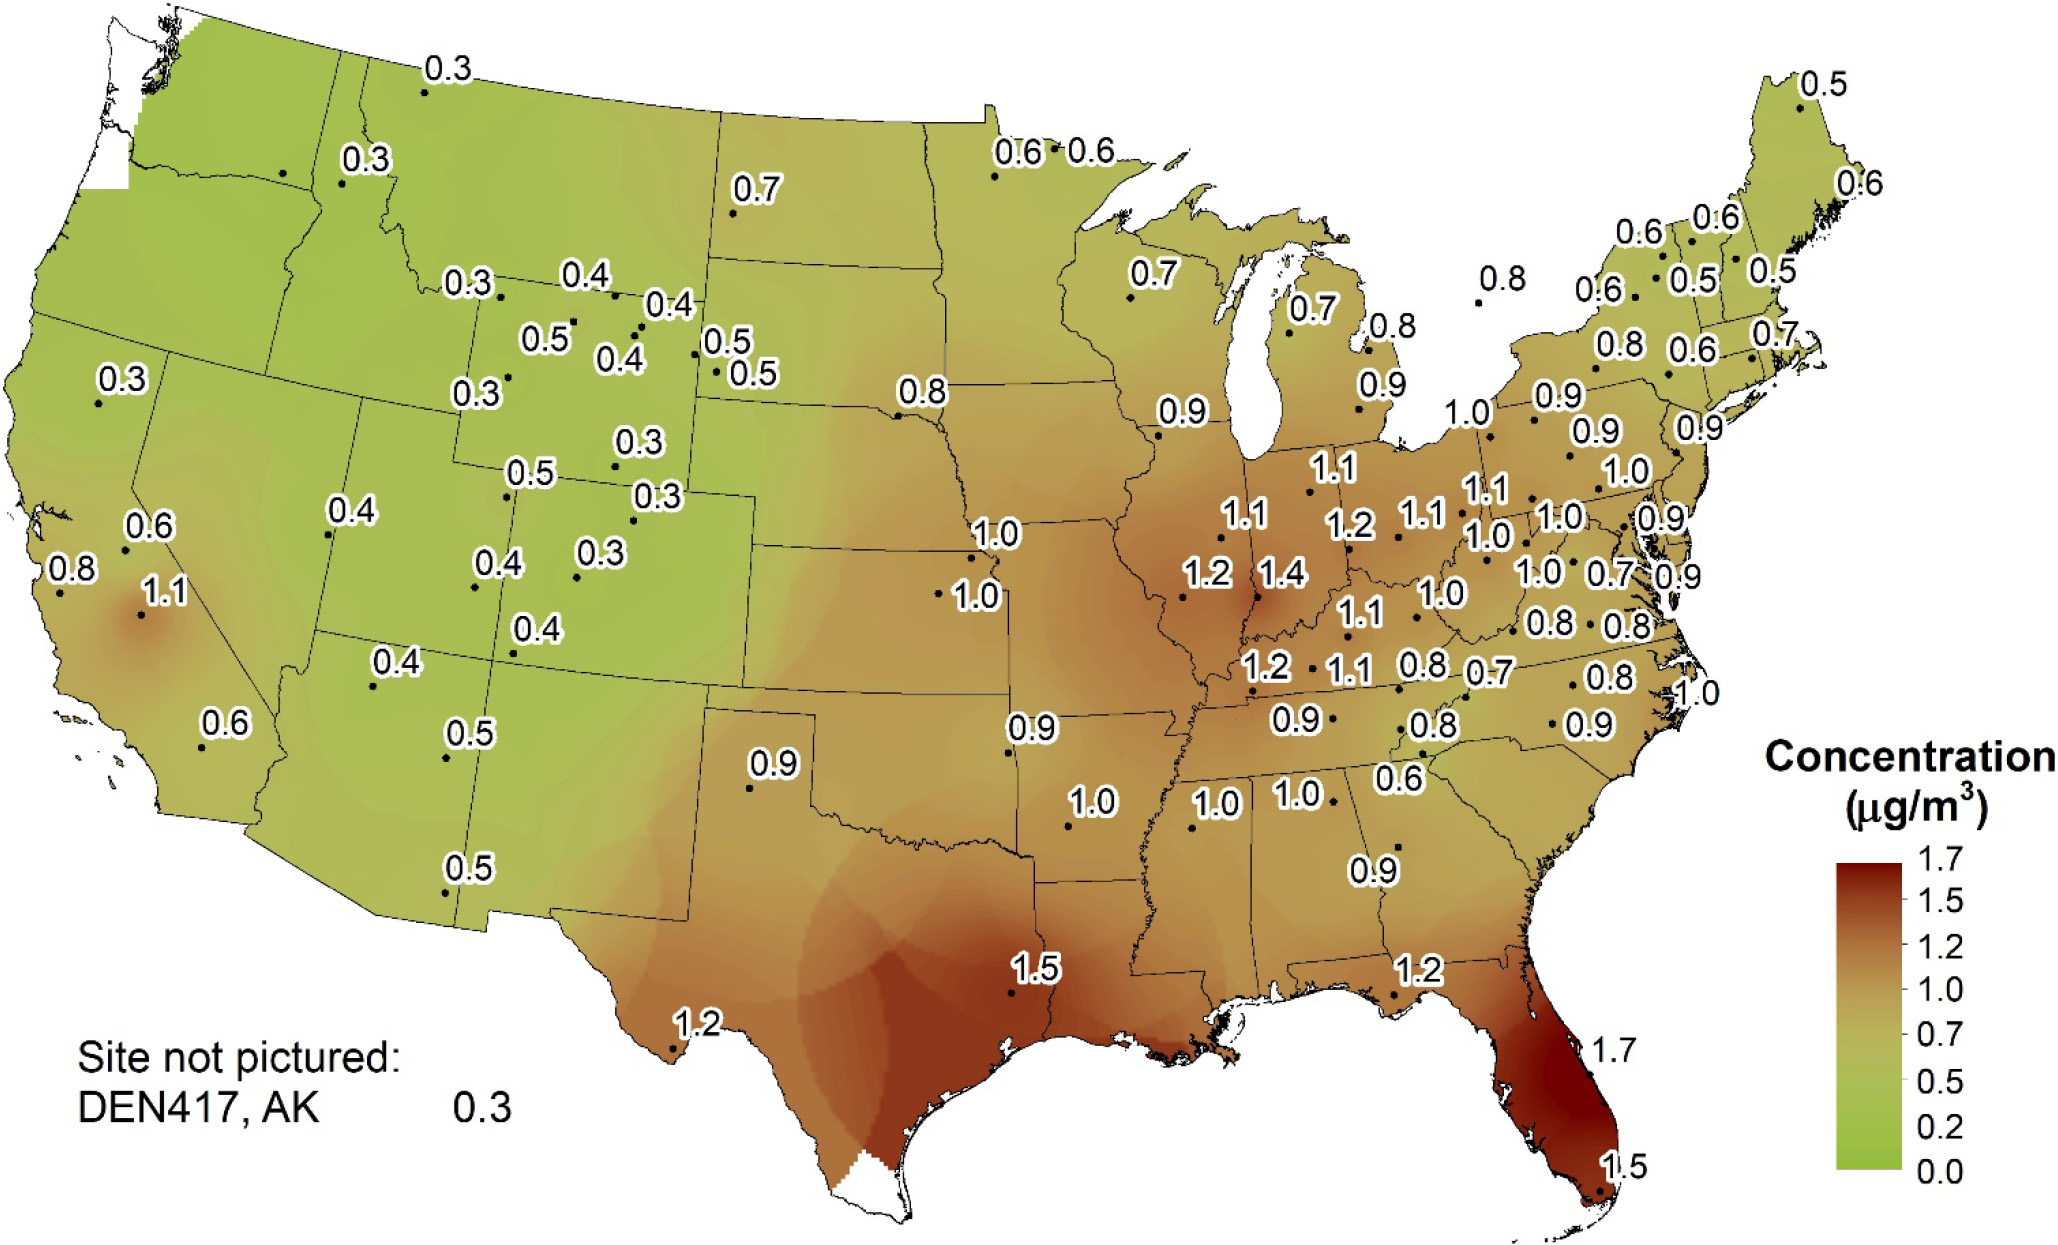
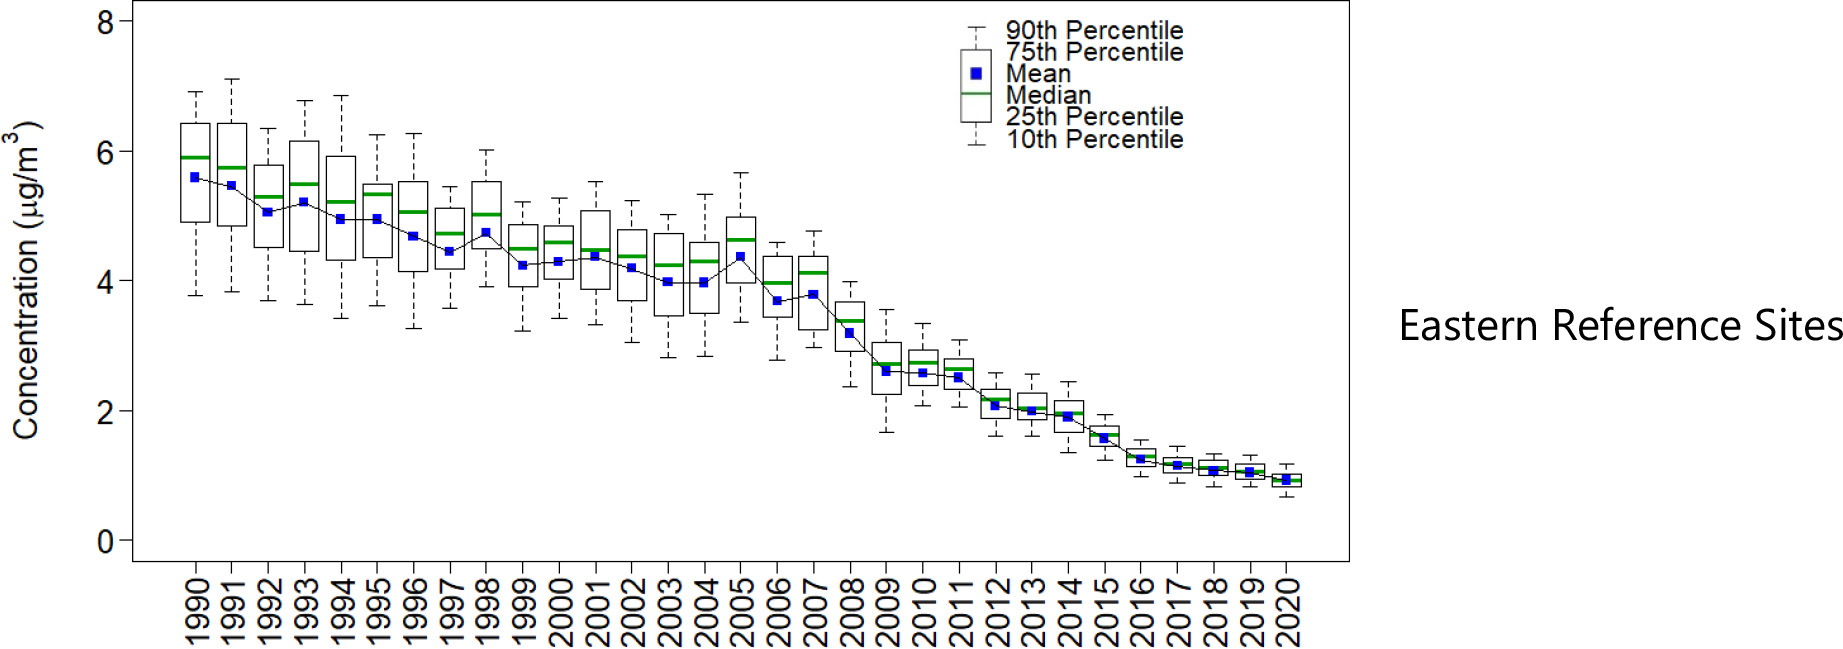
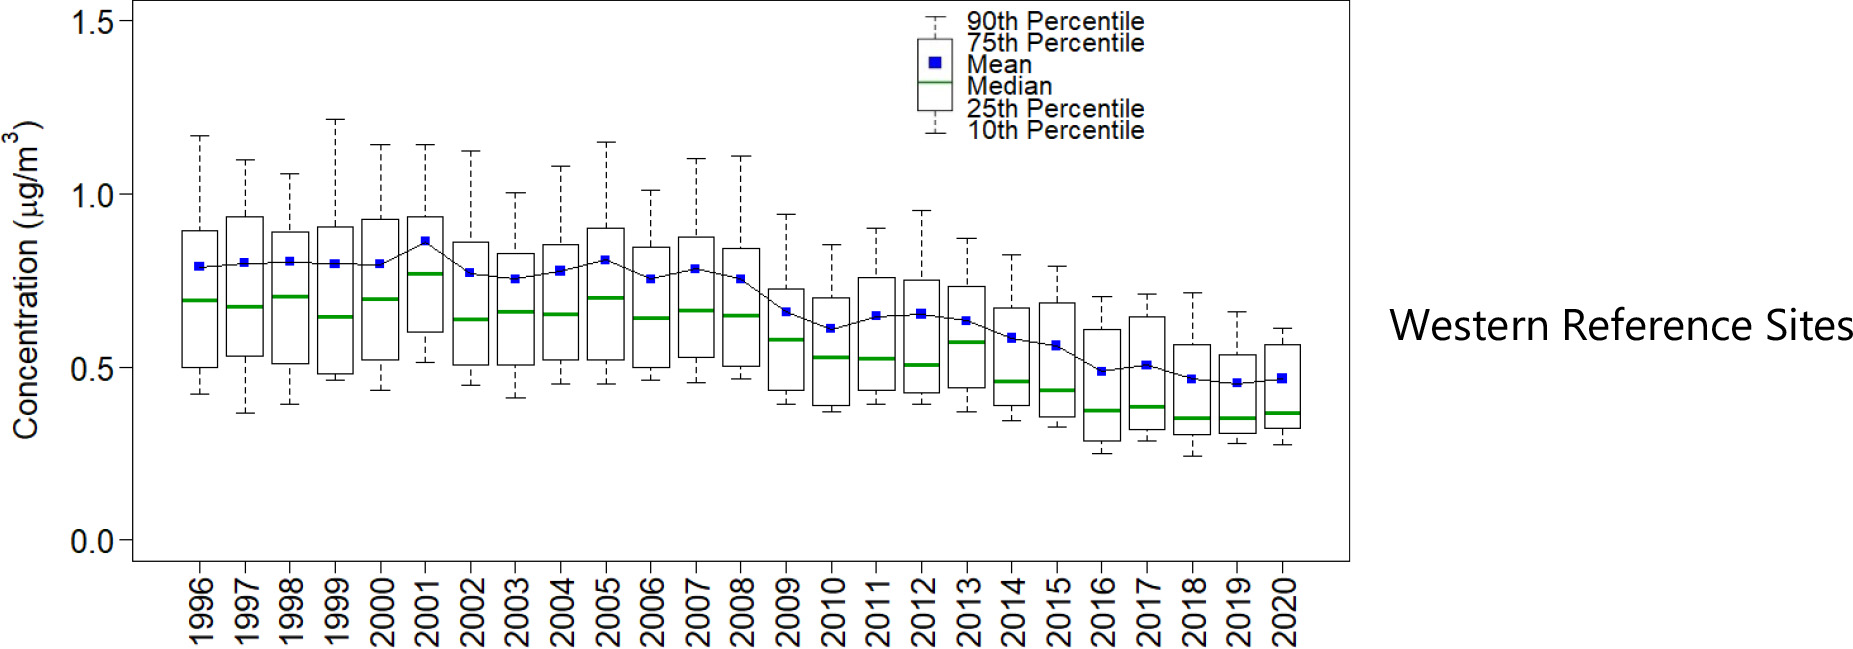
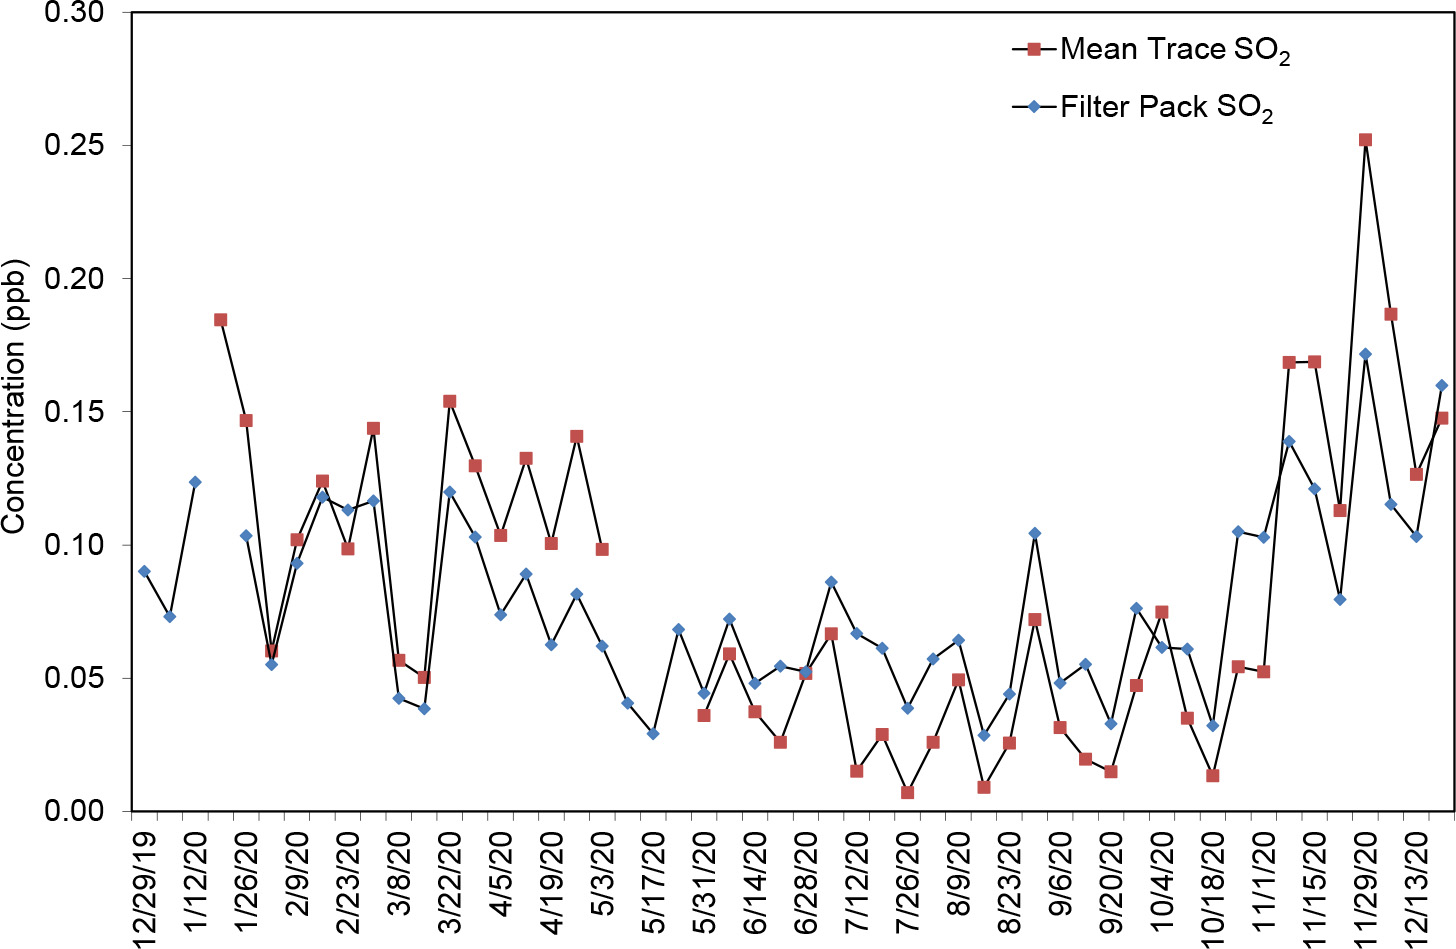
Figure 20 provides a diagram that compares weekly filter pack SO2 concentrations with continuous trace level gas data measured at GRS420, TN. The continuous analyzer provides a gross check of the filter pack measurements despite its occasional uncorrected baseline drift. The continuous analyzer data can also be used to produce diurnal profiles of hourly SO2 concentrations and detect the presence of SO2 plumes.
Figure 20 Comparison of GRS420 Weekly Mean Continuous and Filter Pack SO2 Concentrations
 Download Figure
Atmospheric Deposition
Gaseous and particulate nitrogen, sulfur, and other trace pollutants are deposited to the environment through dry and wet atmospheric processes. A primary goal of CASTNET is to estimate the dry deposition of pollutants from the atmosphere to sensitive ecosystems. The NADP TDep measurement-model technique (Schwede and Lear, 2014) combines CASTNET monitoring data with output from the Community Multiscale Air Quality (CMAQ) modeling system (Byun and Schere, 2006) to estimate dry deposition. The TDep method uses measured air concentration data from CASTNET when available and CMAQ output in areas where monitoring data are not available. CMAQ also provides modeled data for species that are not routinely measured. TDep and its recent updates are discussed on the TDep web page. See also the NADP Fact Sheet, “Hybrid Approach to Mapping Total Deposition.”
For wet deposition, the TDep method combines precipitation amounts measured at NADP/NTN sites with a Parameter-elevation Regressions on Independent Slopes Model (PRISM) surface of precipitation data to develop a continuous grid of precipitation data. PRISM uses terrain elevation, slope, and aspect and climatic measurements to estimate precipitation amounts. Pollutant concentrations in precipitation are measured by NADP/NTN, extrapolated into a grid using an inverse distance weighting algorithm, and then multiplied by the combined precipitation grid to generate estimates of wet deposition. For 2020, dry and wet deposition rates were added to obtain estimates of total deposition of nitrogen, sulfur, base cations, and Cl -, which are presented on the maps in this chapter as kilograms per hectare per year (kg ha -1 yr -1 ) unless otherwise noted.
Nitrogen Deposition
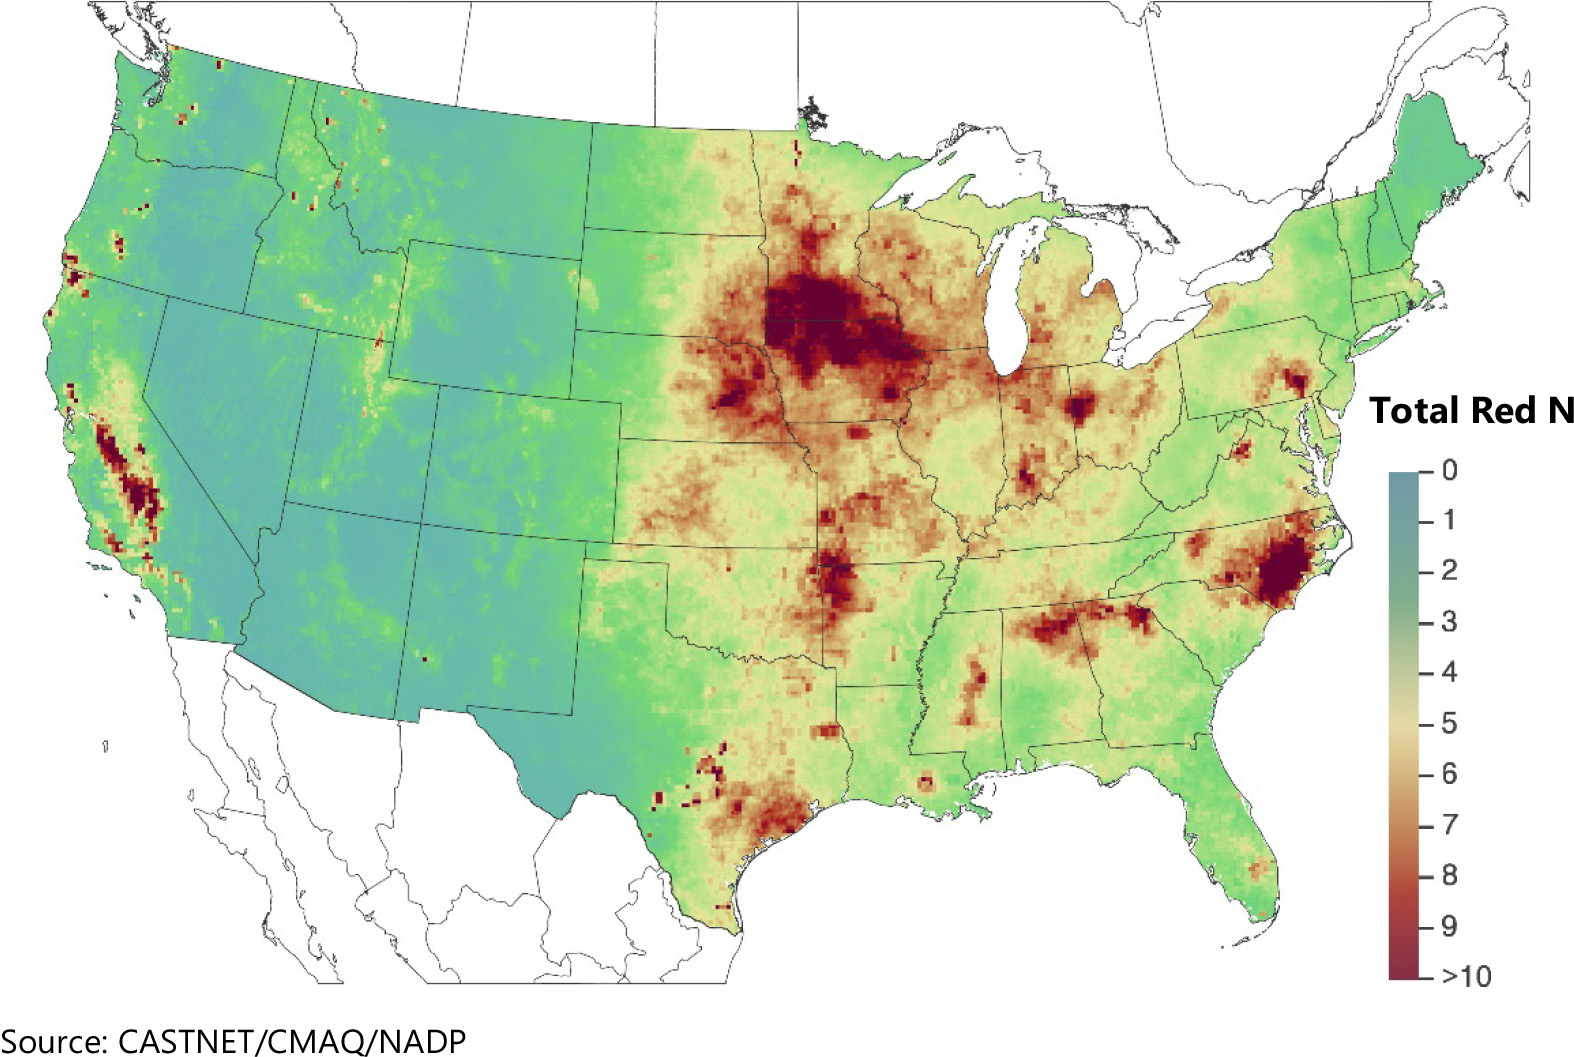
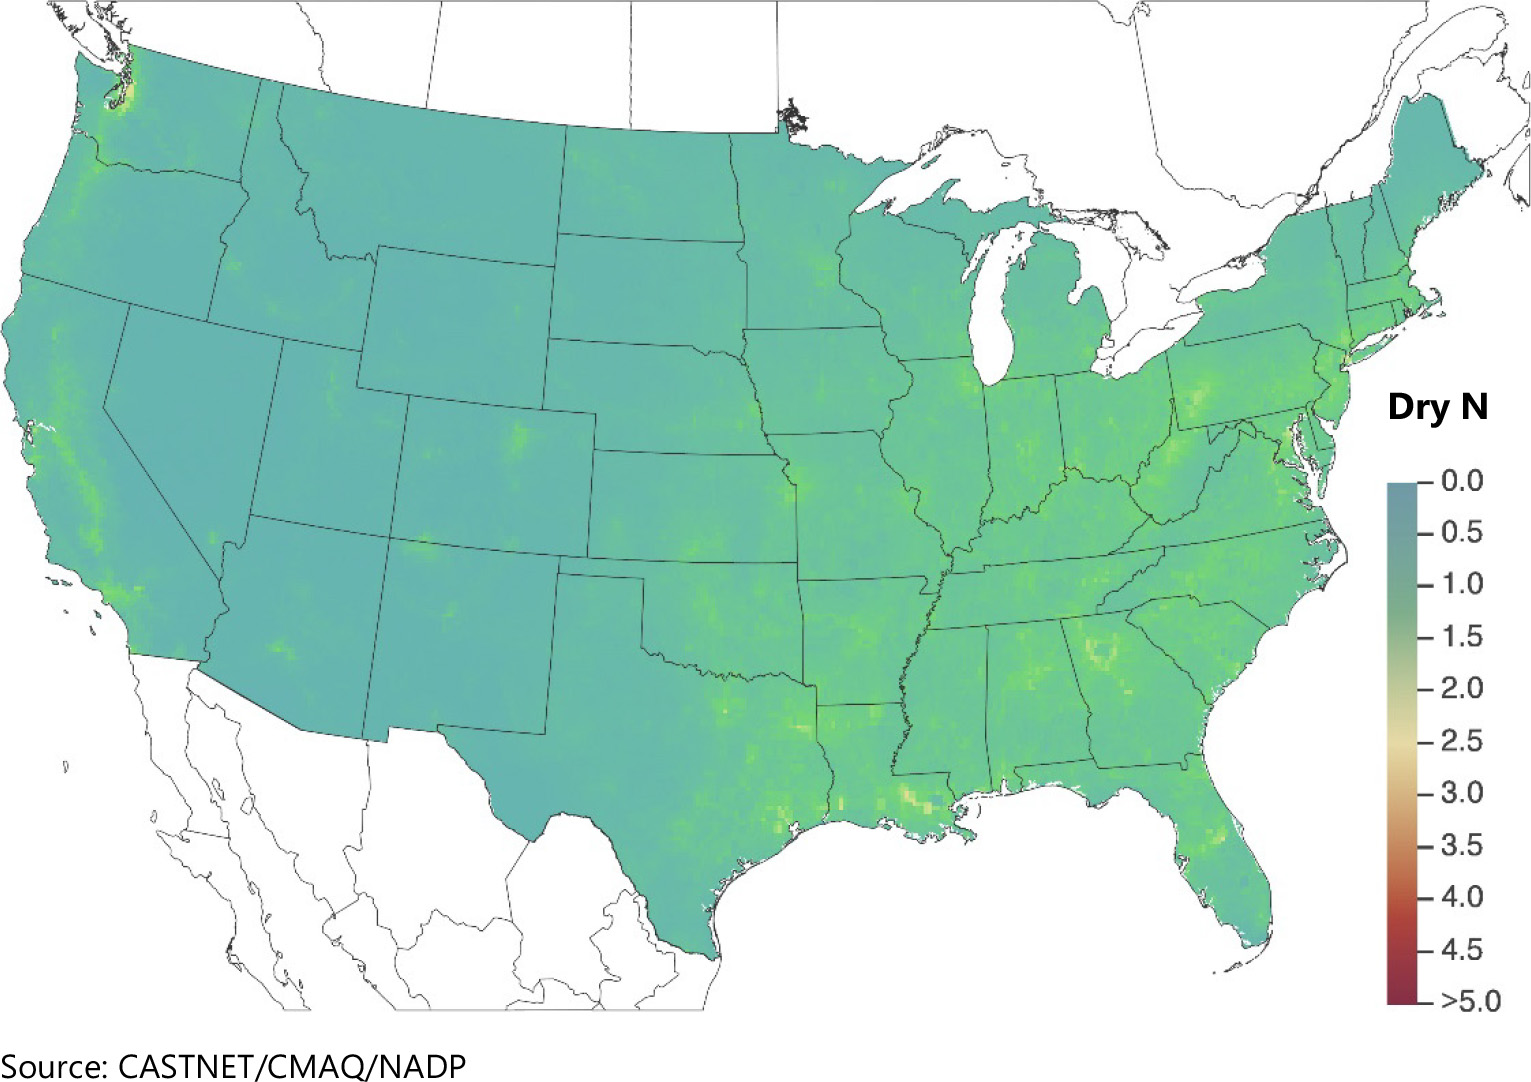
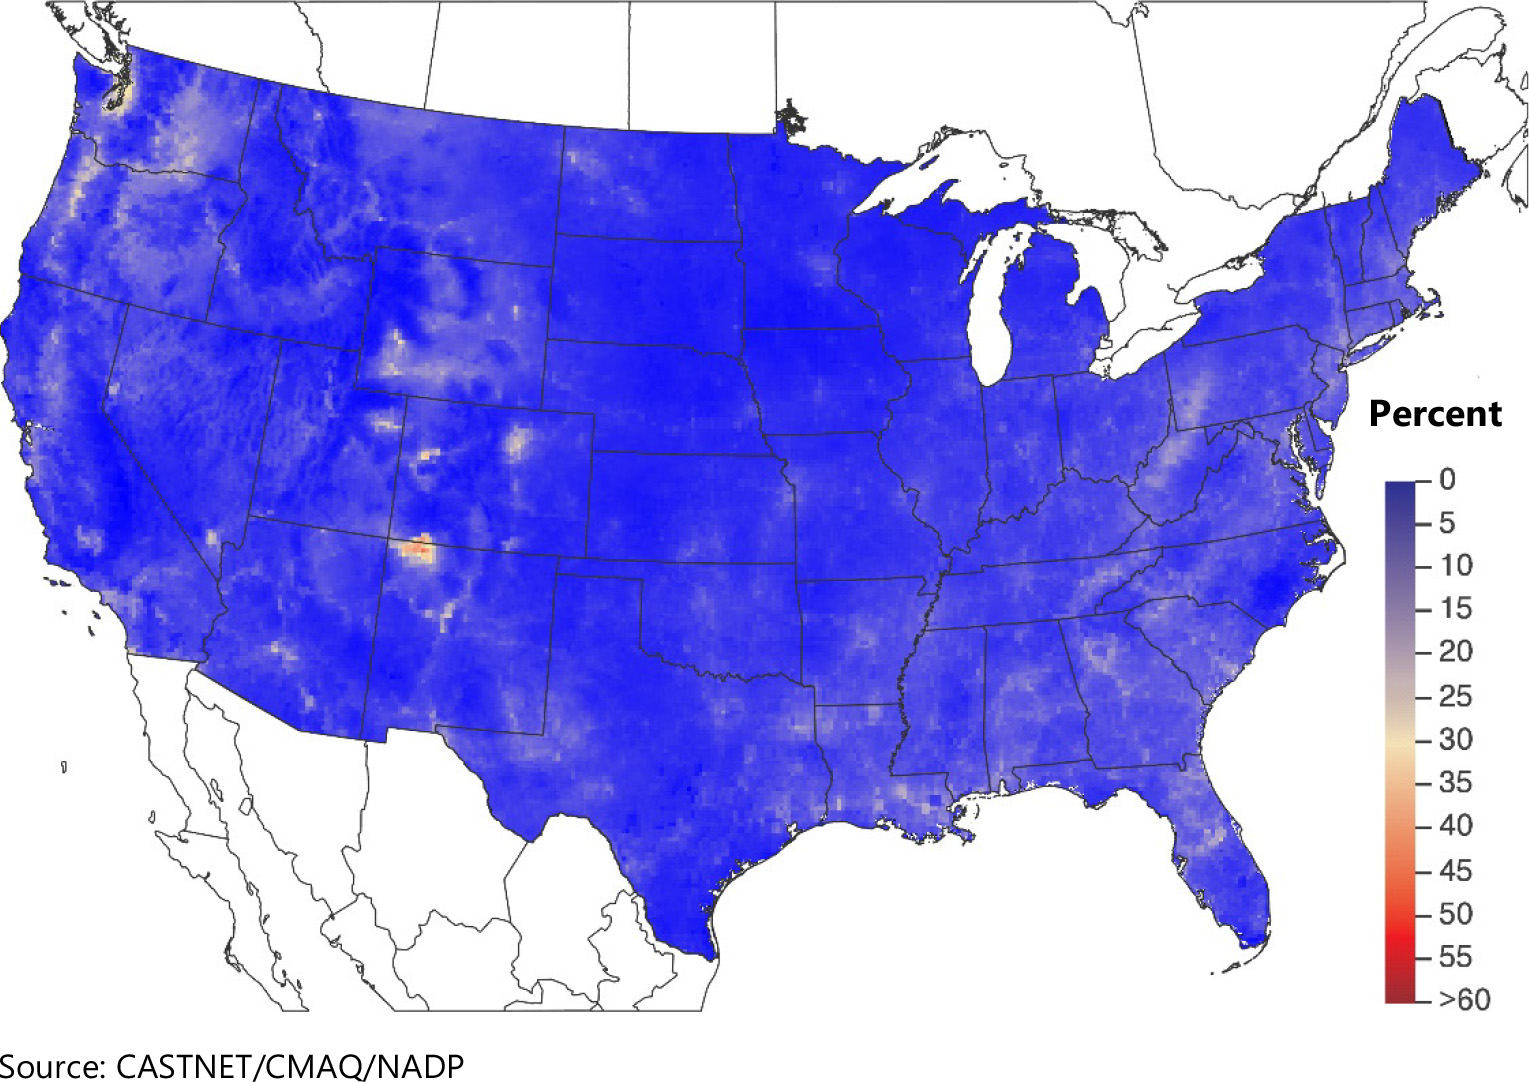
A map of the dry deposition fluxes of nitrogen (N) estimated for 2020 by the TDep method is shown in Figure 21. The magnitude of the deposition fluxes is illustrated by the shading in the figure legend. A map of total deposition of N estimated for 2020 is given in Figure 22. The percentage of total deposition of N due to dry deposition is shown in Figure 23. A map of TDep estimates of total deposition of reduced N species for 2020 is given in Figure 24. Figure 25 gives the percentage of total deposition of reduced N. Dry deposition of N species that are not routinely measured but are modeled by CMAQ and used by TDep is shown in the map in Figure 26, and its percentage of total deposition is shown in Figure 27. Estimates of annual gross dry deposition of NH3 as N for 2020 is shown in Figure 28.
Sulfur Deposition
Figure 29 shows a map of TDep estimates of total deposition of sulfur (S) for 2020. The magnitude of the deposition fluxes is illustrated by the shading in the figure legend. The percentage of total deposition of S due to dry deposition is shown in Figure 30.
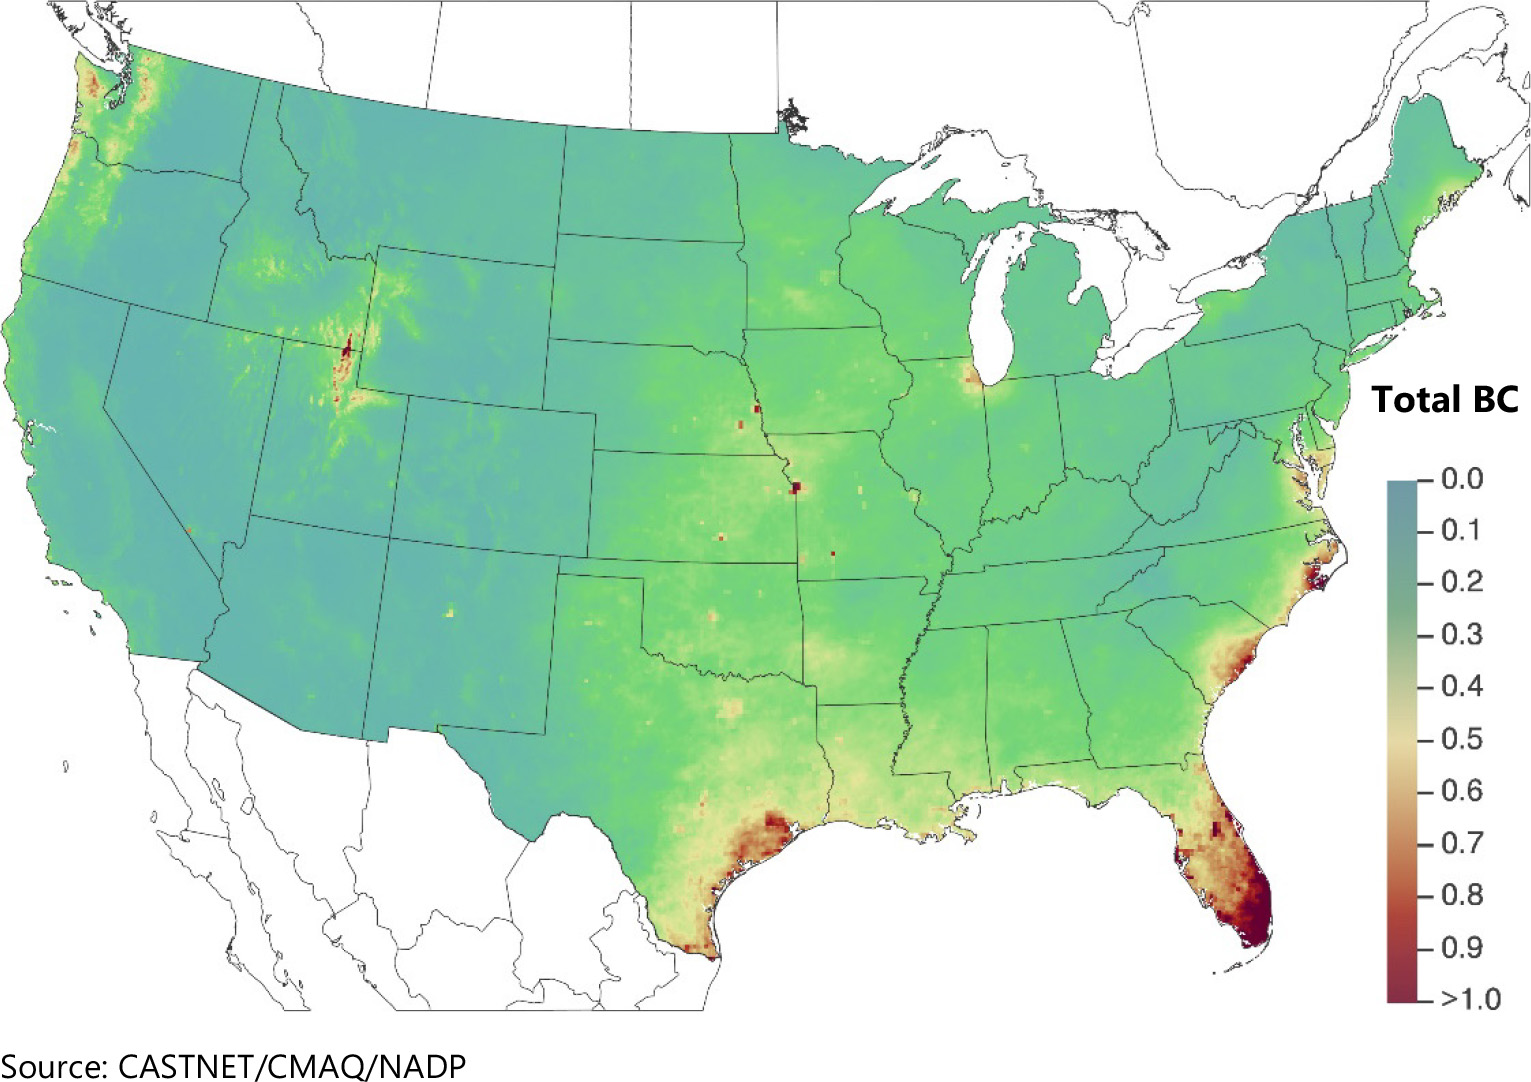
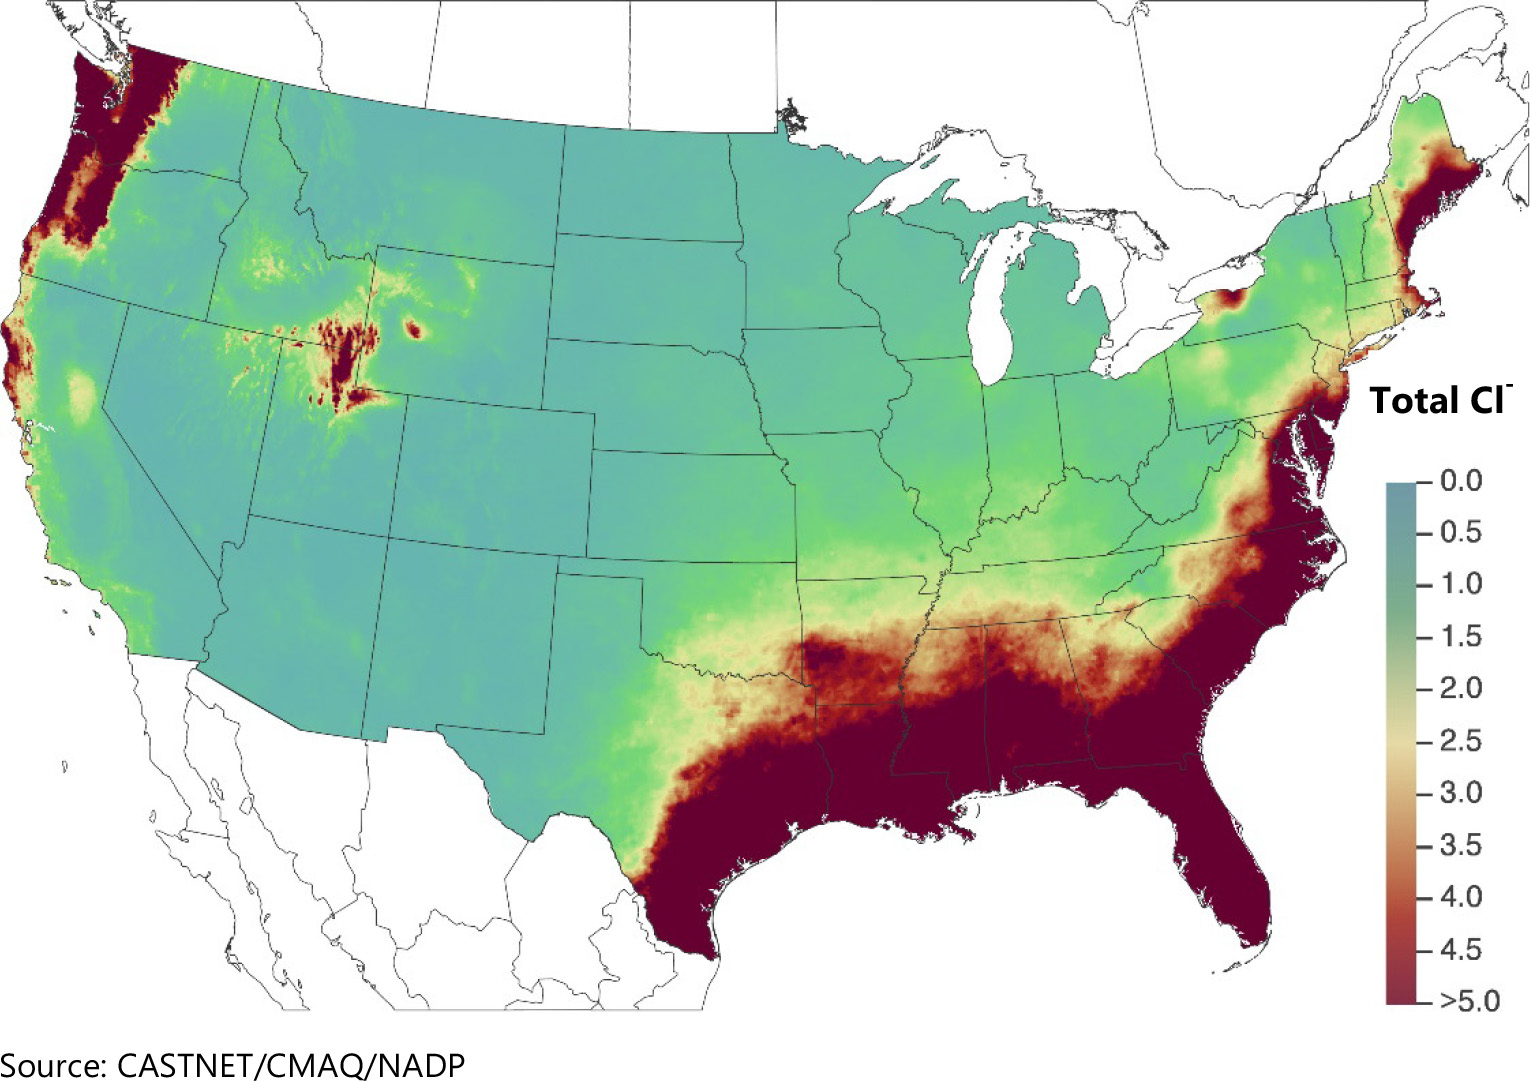
Deposition of Base Cations and Chloride
A map of 2020 estimated total deposition of the base cations Ca 2+ , K + , Mg 2+ , and Na + is provided in Figure 31. Figure 32 provides 2020 estimated rates of deposition of total Cl -.
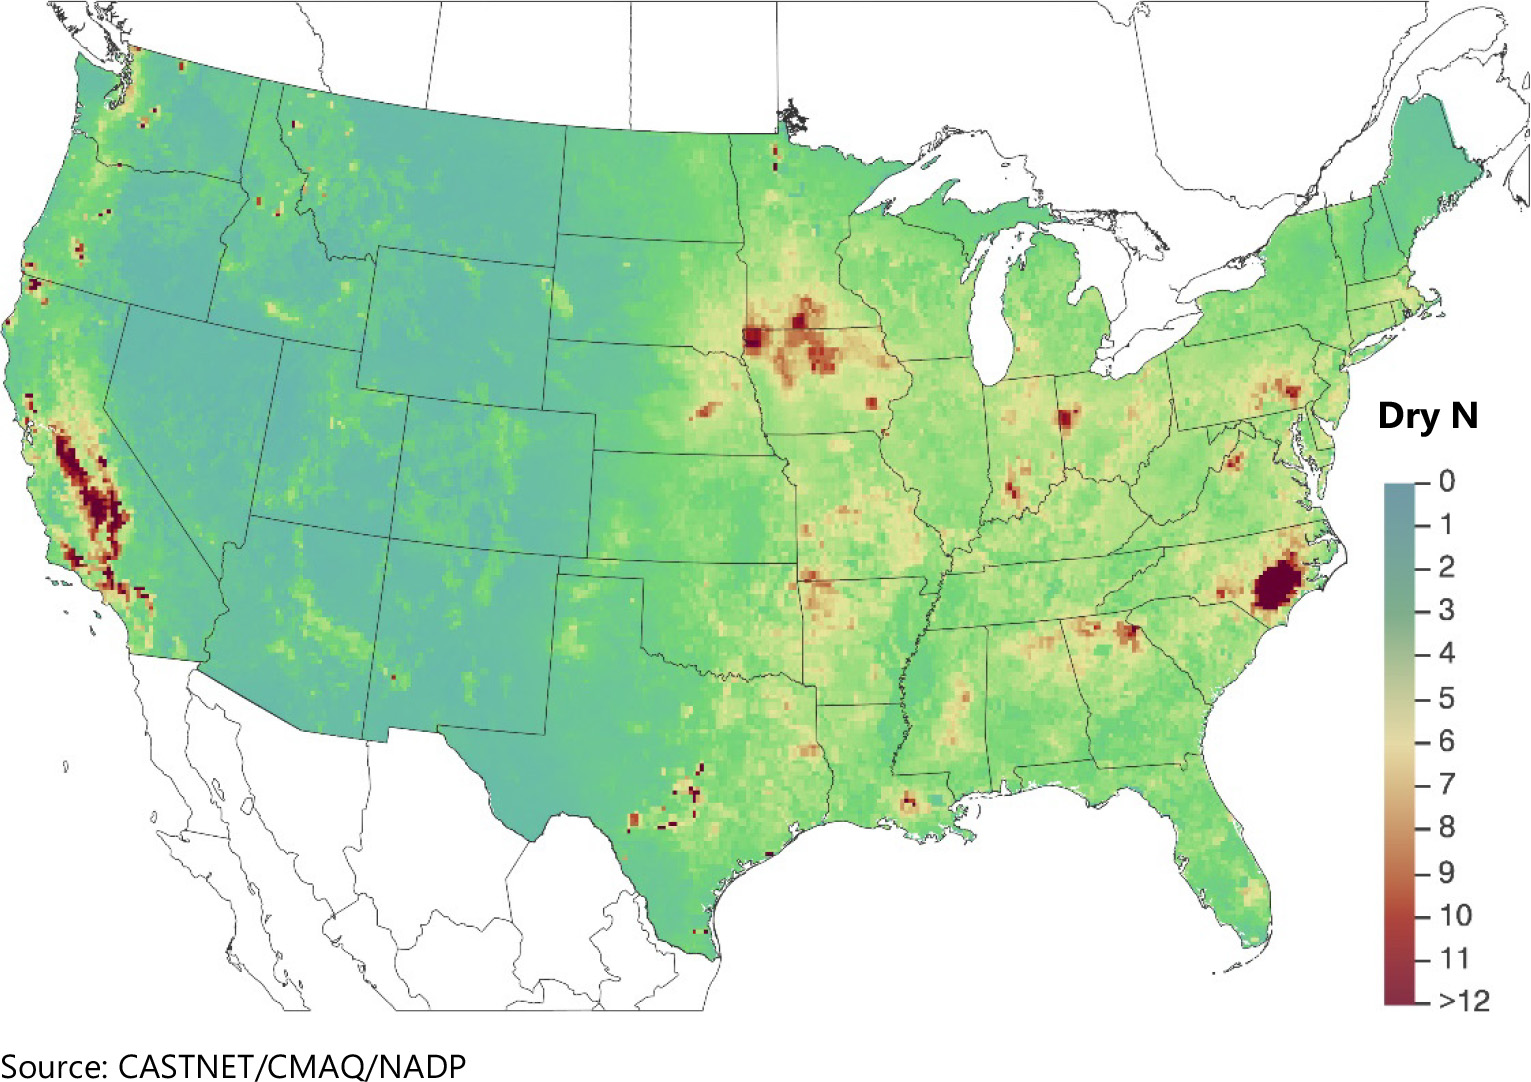
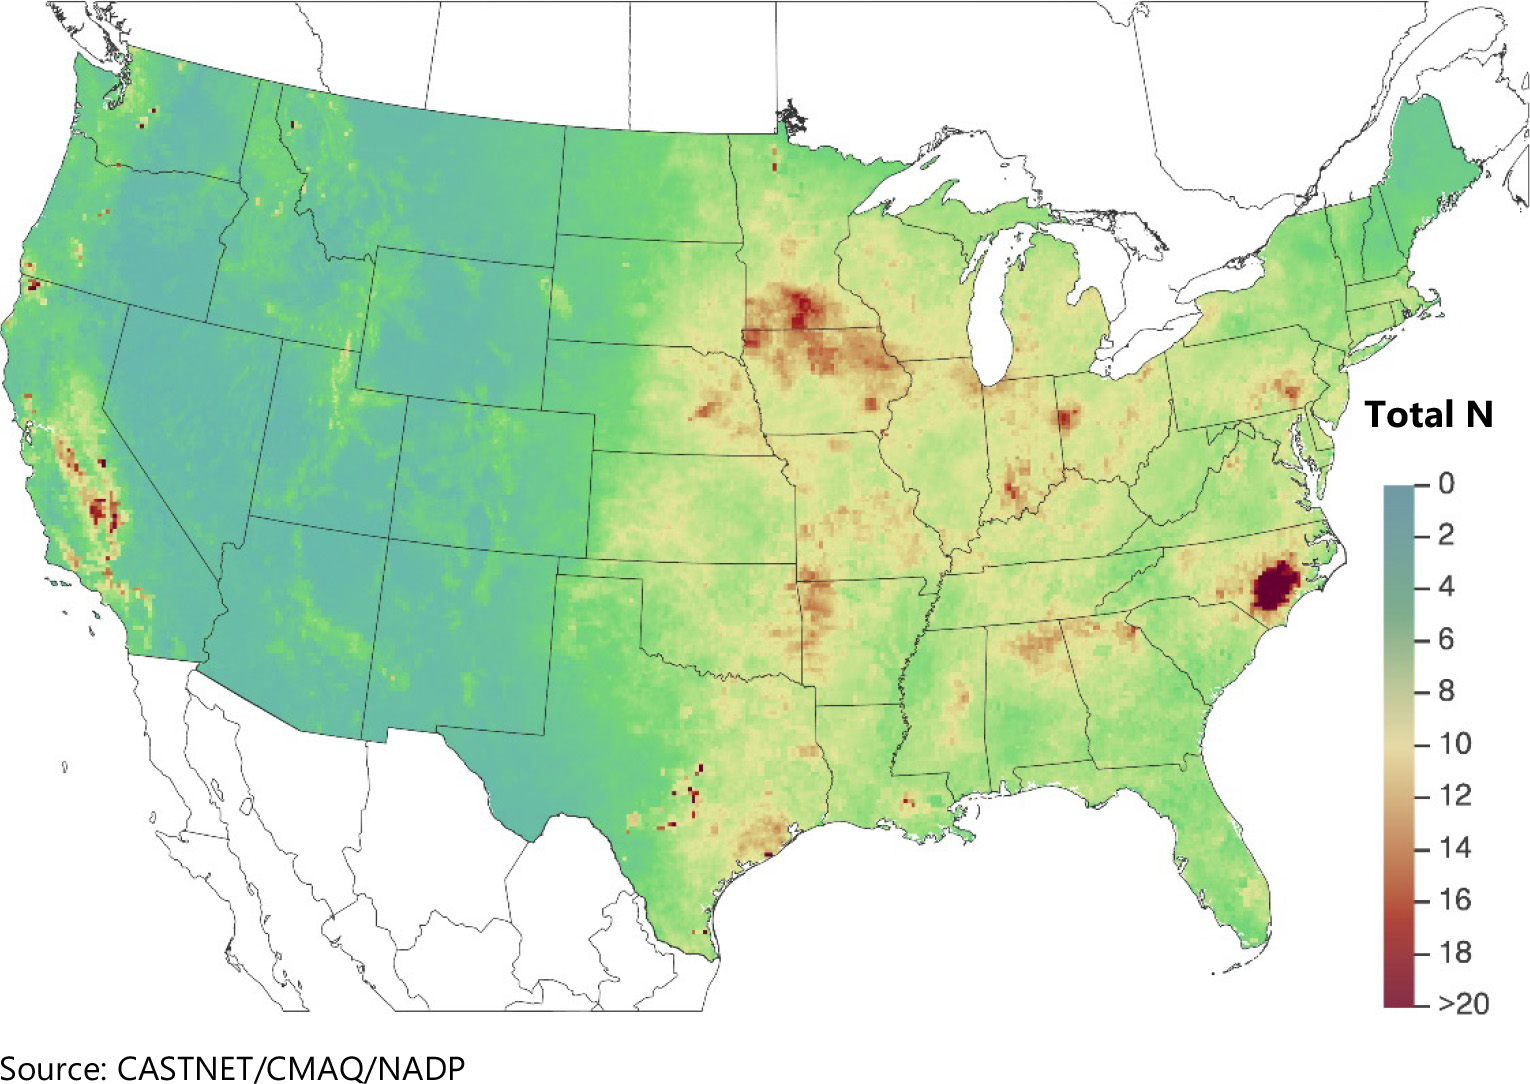
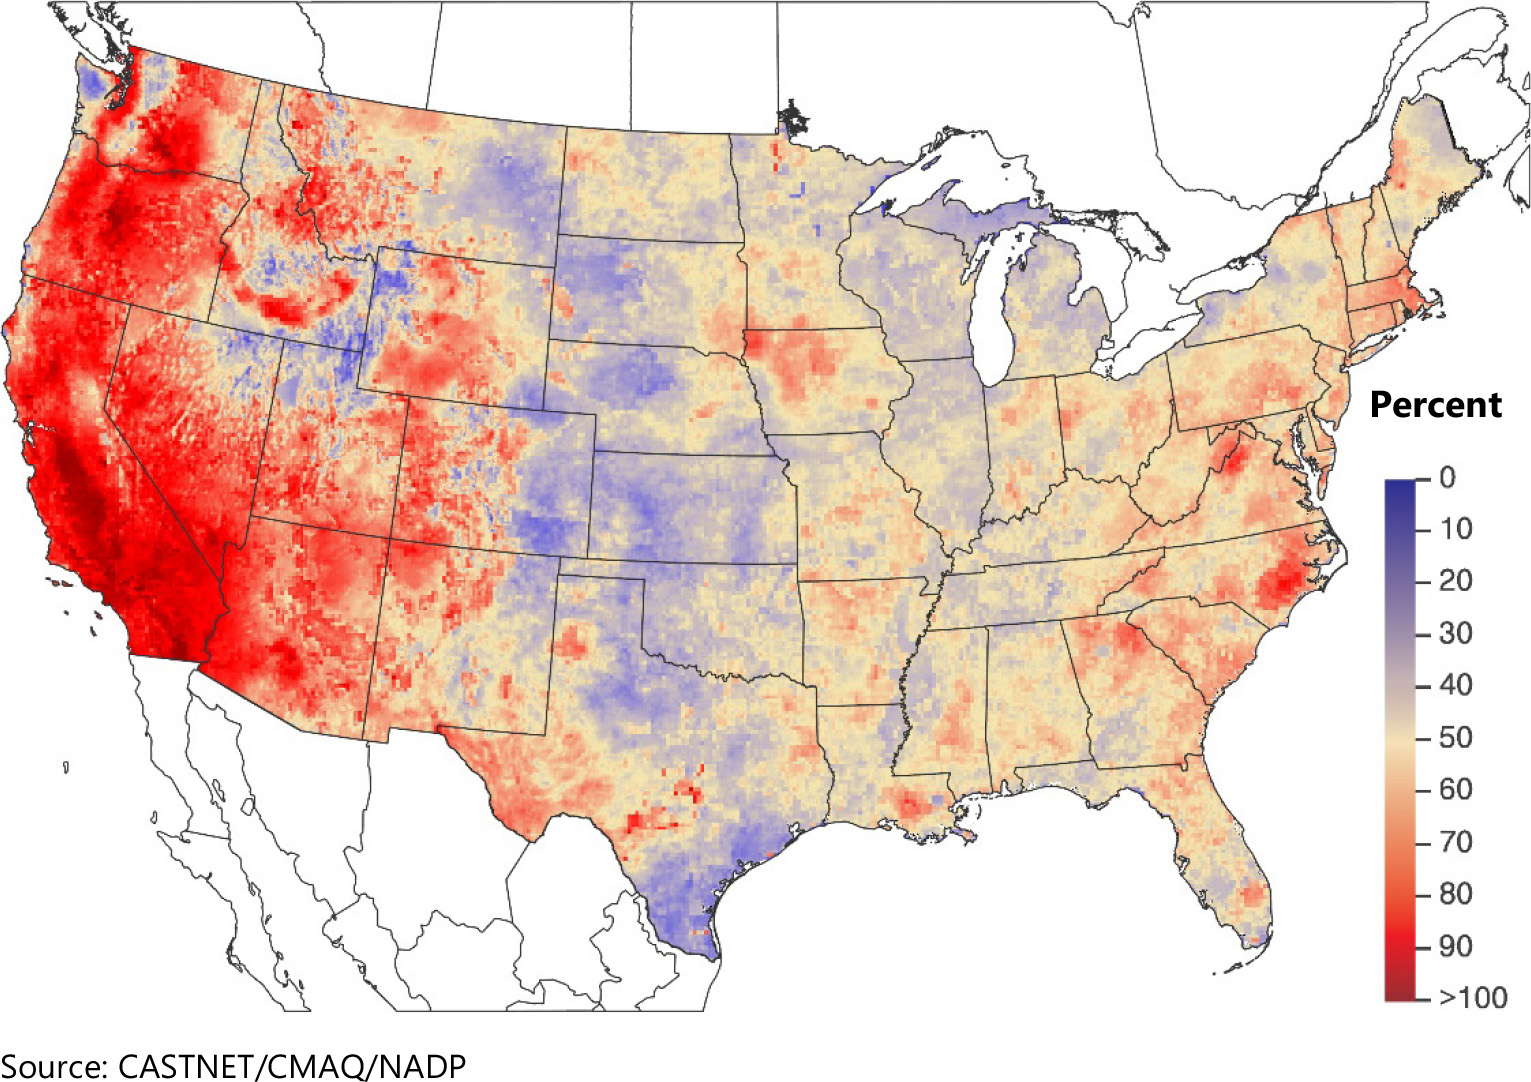
Figure 24 TDep Total Deposition Estimates of Reduced N Species (kg ha -1 yr -1 ) for 2020
 Download Figure
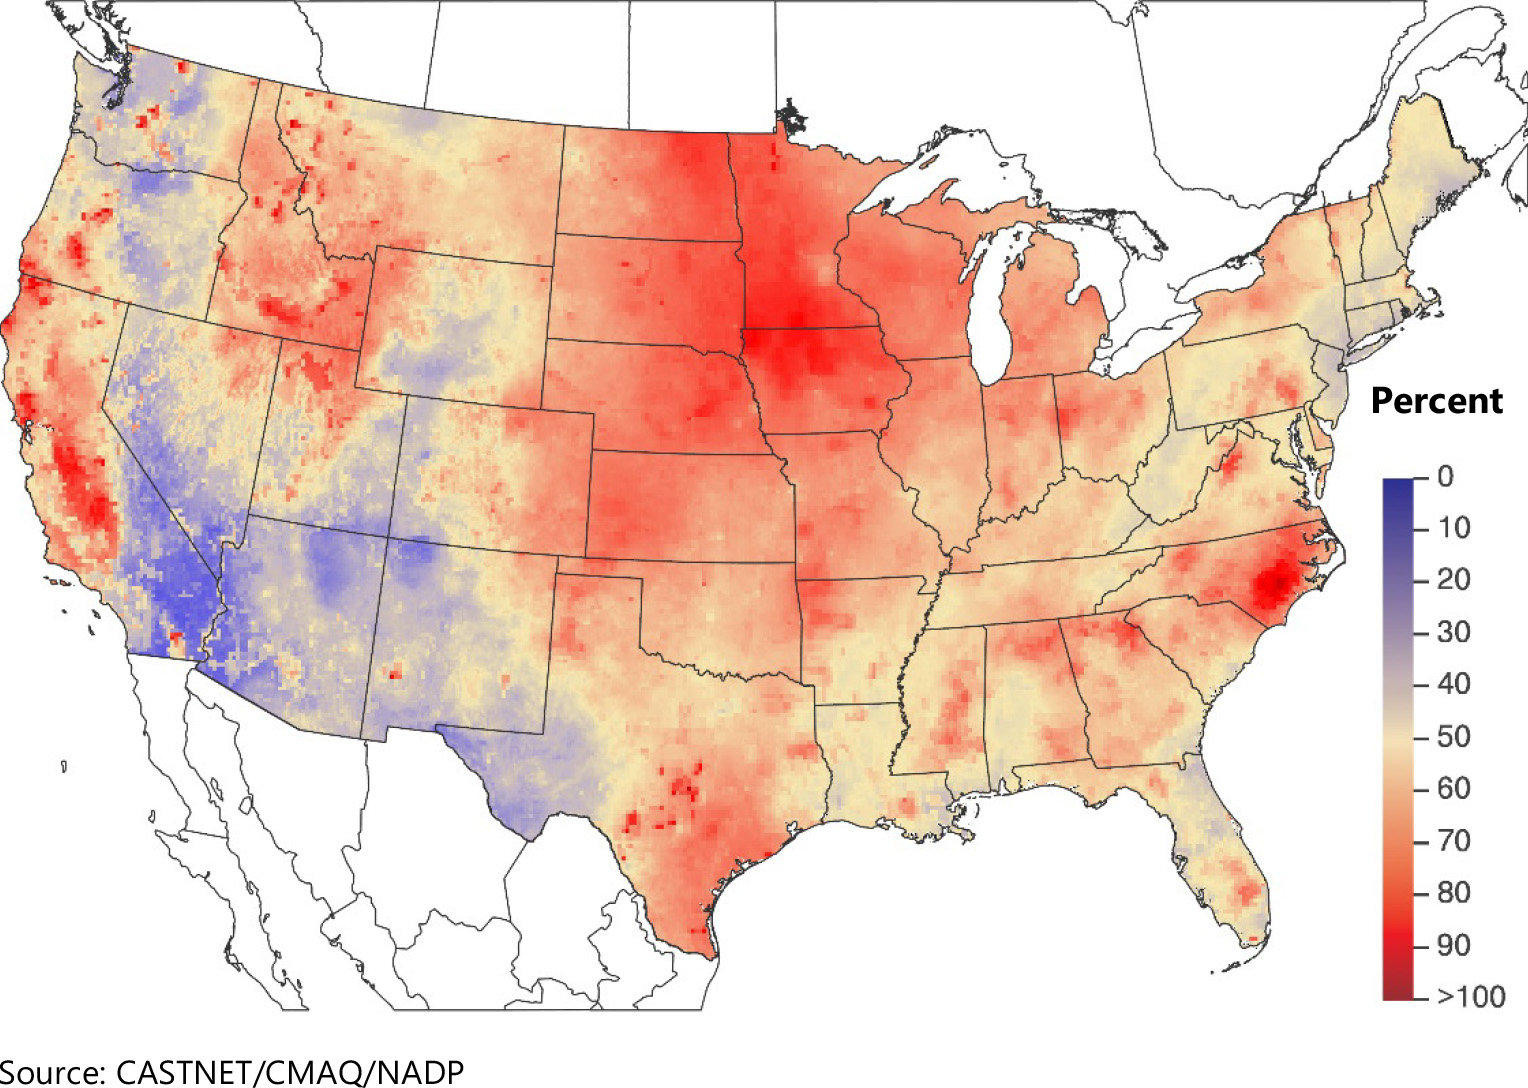
Figure 26 TDep Dry Deposition Estimates of Unmonitored N Species (kg ha -1 yr -1 ) for 2020
 Download Figure
Figure 27 TDep Percent of Total Deposition of N from Dry Deposition of Unmonitored Species for 2020
 Download Figure
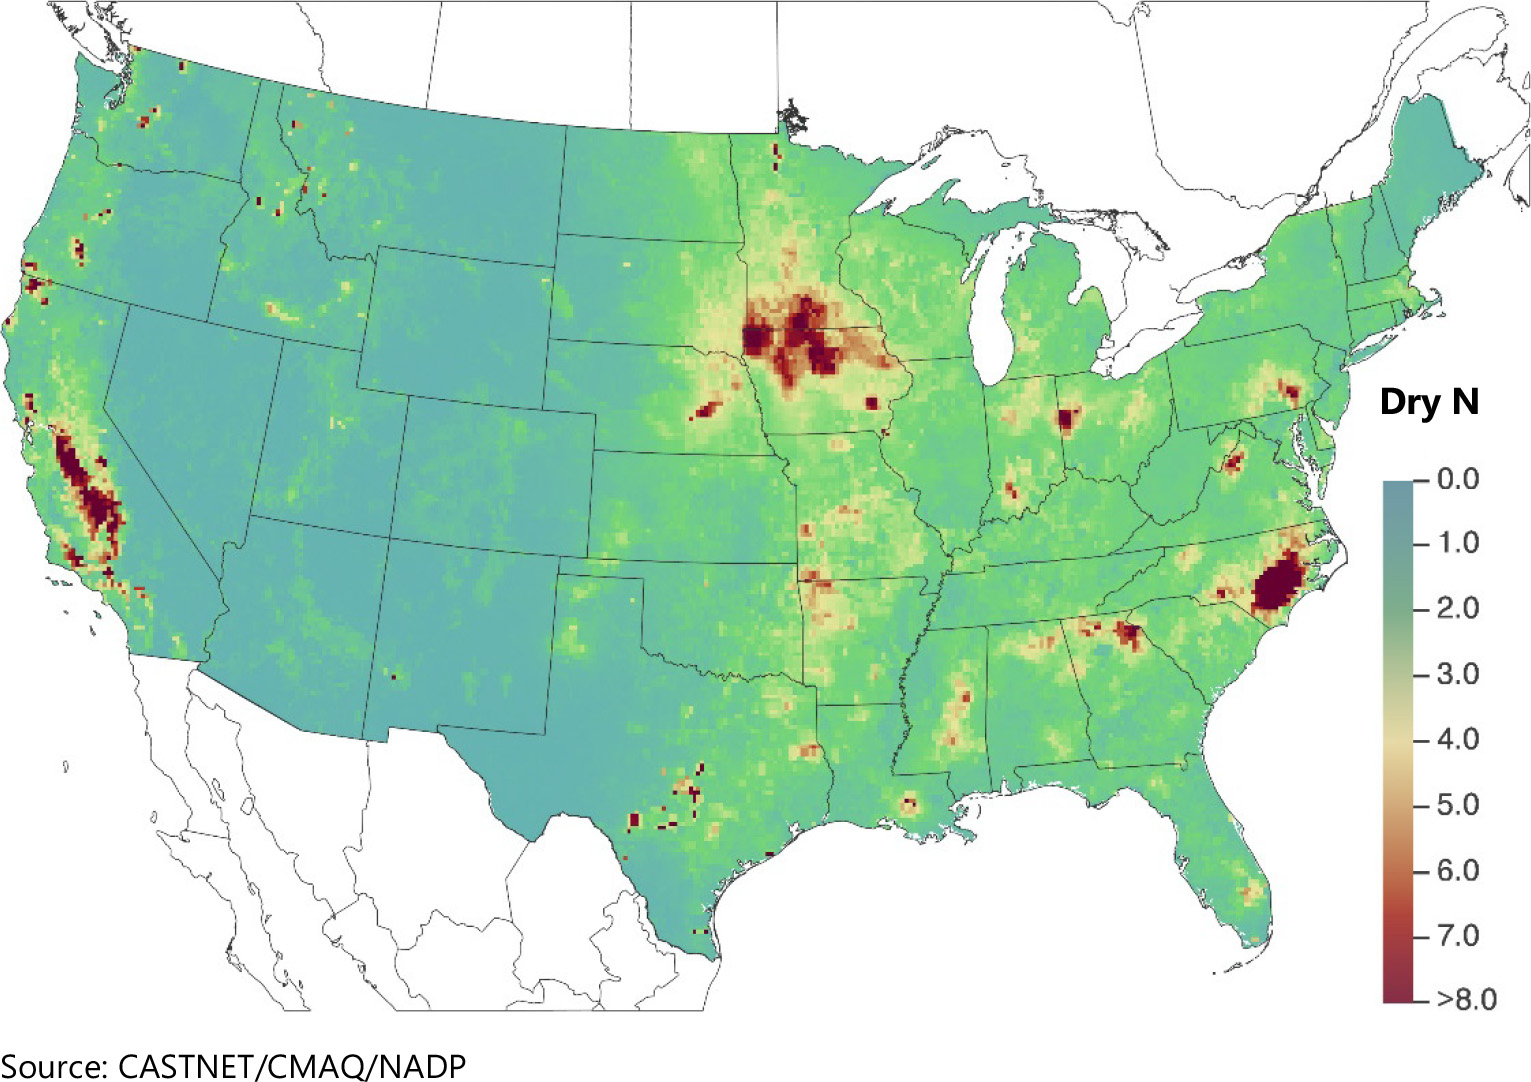
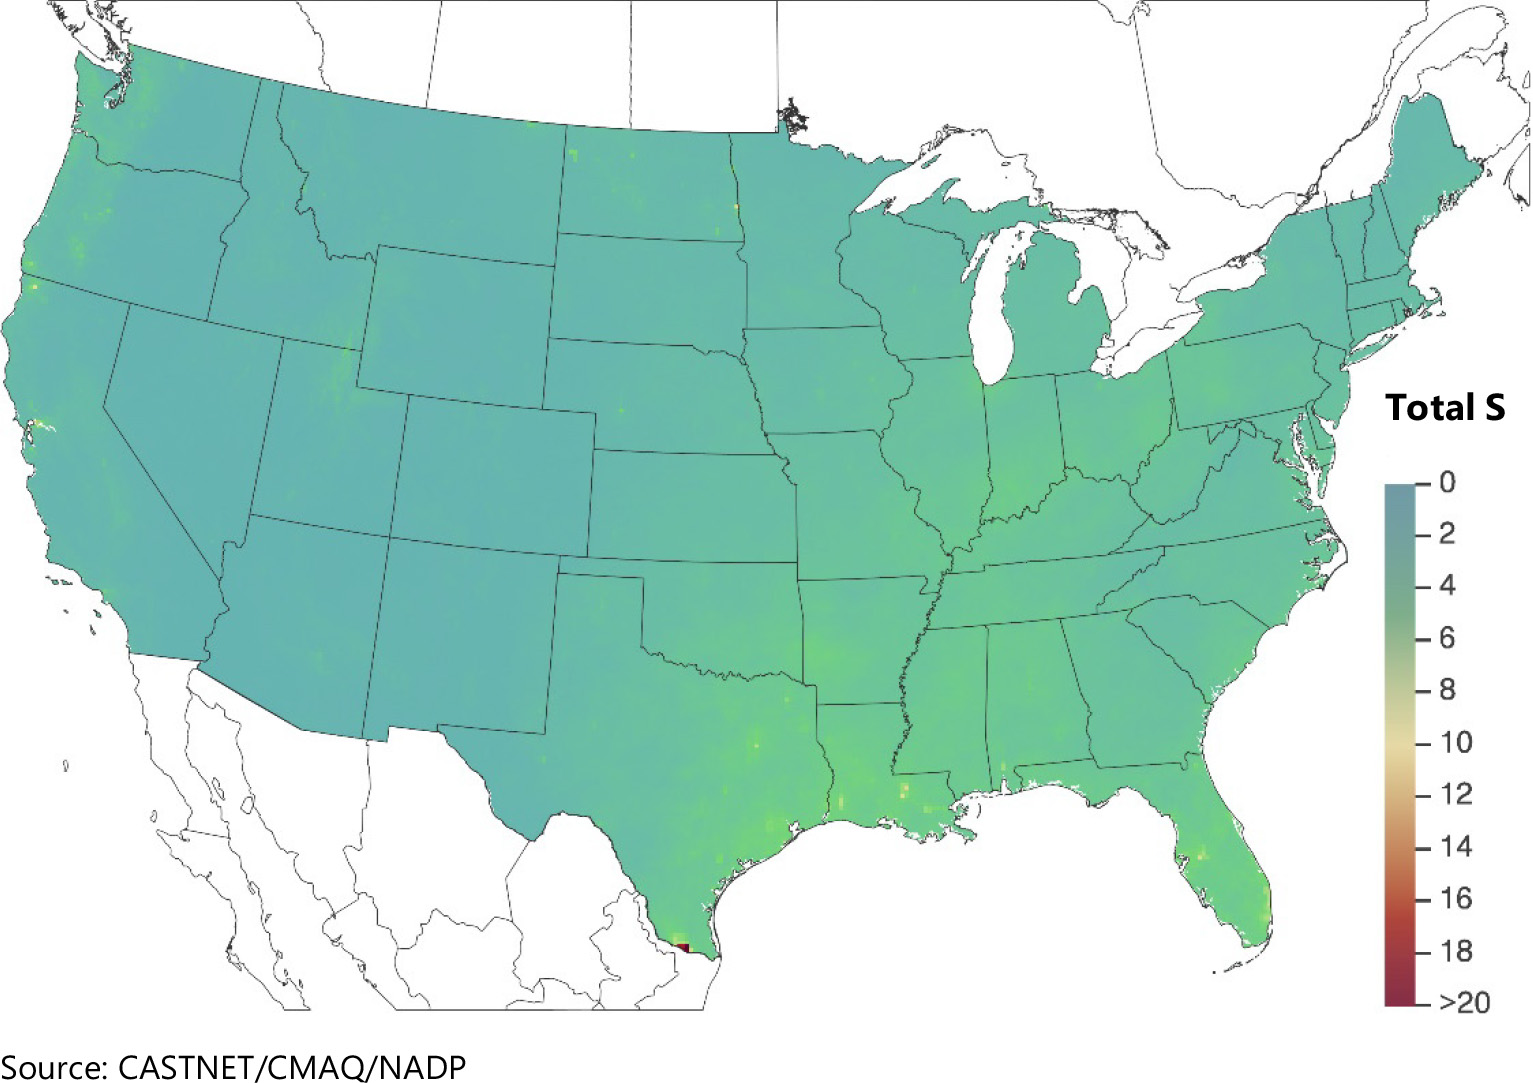
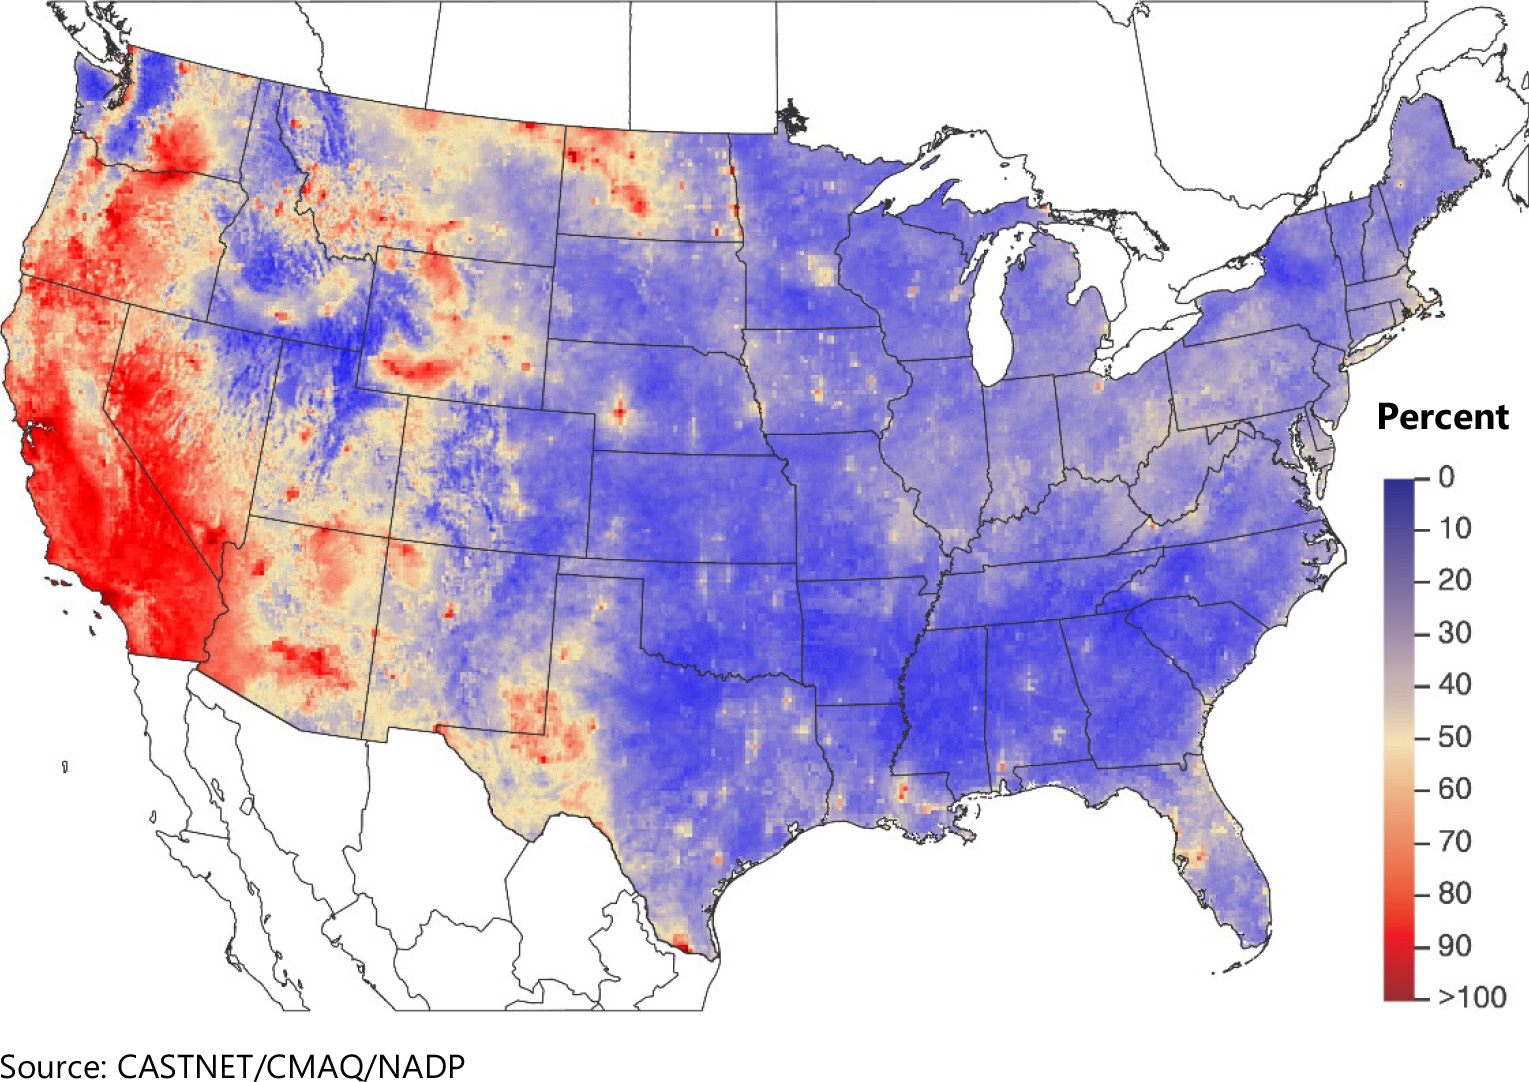
Figure 31 TDep Total Deposition Estimates of the Base Cations Ca 2+, K + , Mg 2+, and Na + (kiloequivalents per hectare per year) for 2020
 Download Figure
References
Byun, D. and Schere, K. L. 2006. Review of the Governing Equations, Computational Algorithms, and Other Components of the Models‐3 Community Multiscale Air Quality (CMAQ) Modeling System. Applied Mechanics Reviews, 59: 51‐77. doi:10.1115/1.2128636.
Lefohn, A.S. and Runeckles, V.C. 1987. Establishing a Standard to Protect Vegetation - Ozone Exposure/Dose Considerations. Atmos. Environ., 21:561-568. doi: https://doi.org/10.1016/0004- 6981(87)90038-2
Schwede, D. B. and Lear, G. G. 2014. A Novel Hybrid Approach for Estimating Total Deposition in the United States. Atmospheric Environment, 92:207-220. doi:10.1016/j.atmosenv.2014.04.008.
Talbot, R., Mao, H., and Sive, B. 2005. Diurnal Characteristics of Surface Level O3 and other Important Trace Gases in New England, J. Geophys. Res., 110, D09307, https://doi.org/10.1029/2004JD005449.
Wood Environment & Infrastructure Solutions, Inc. (Wood). 2020. Clean Air Status and Trends Network (CASTNET) 2018 Annual Report. Prepared for U.S. Environmental Protection Agency (EPA), Office of Air and Radiation, Clean Air Markets Division, Washington, DC. Contract No. EP-W-16-015. Gainesville, FL. http://java.epa.gov/castnet/documents.do.