CASTNET Overview
Introduction
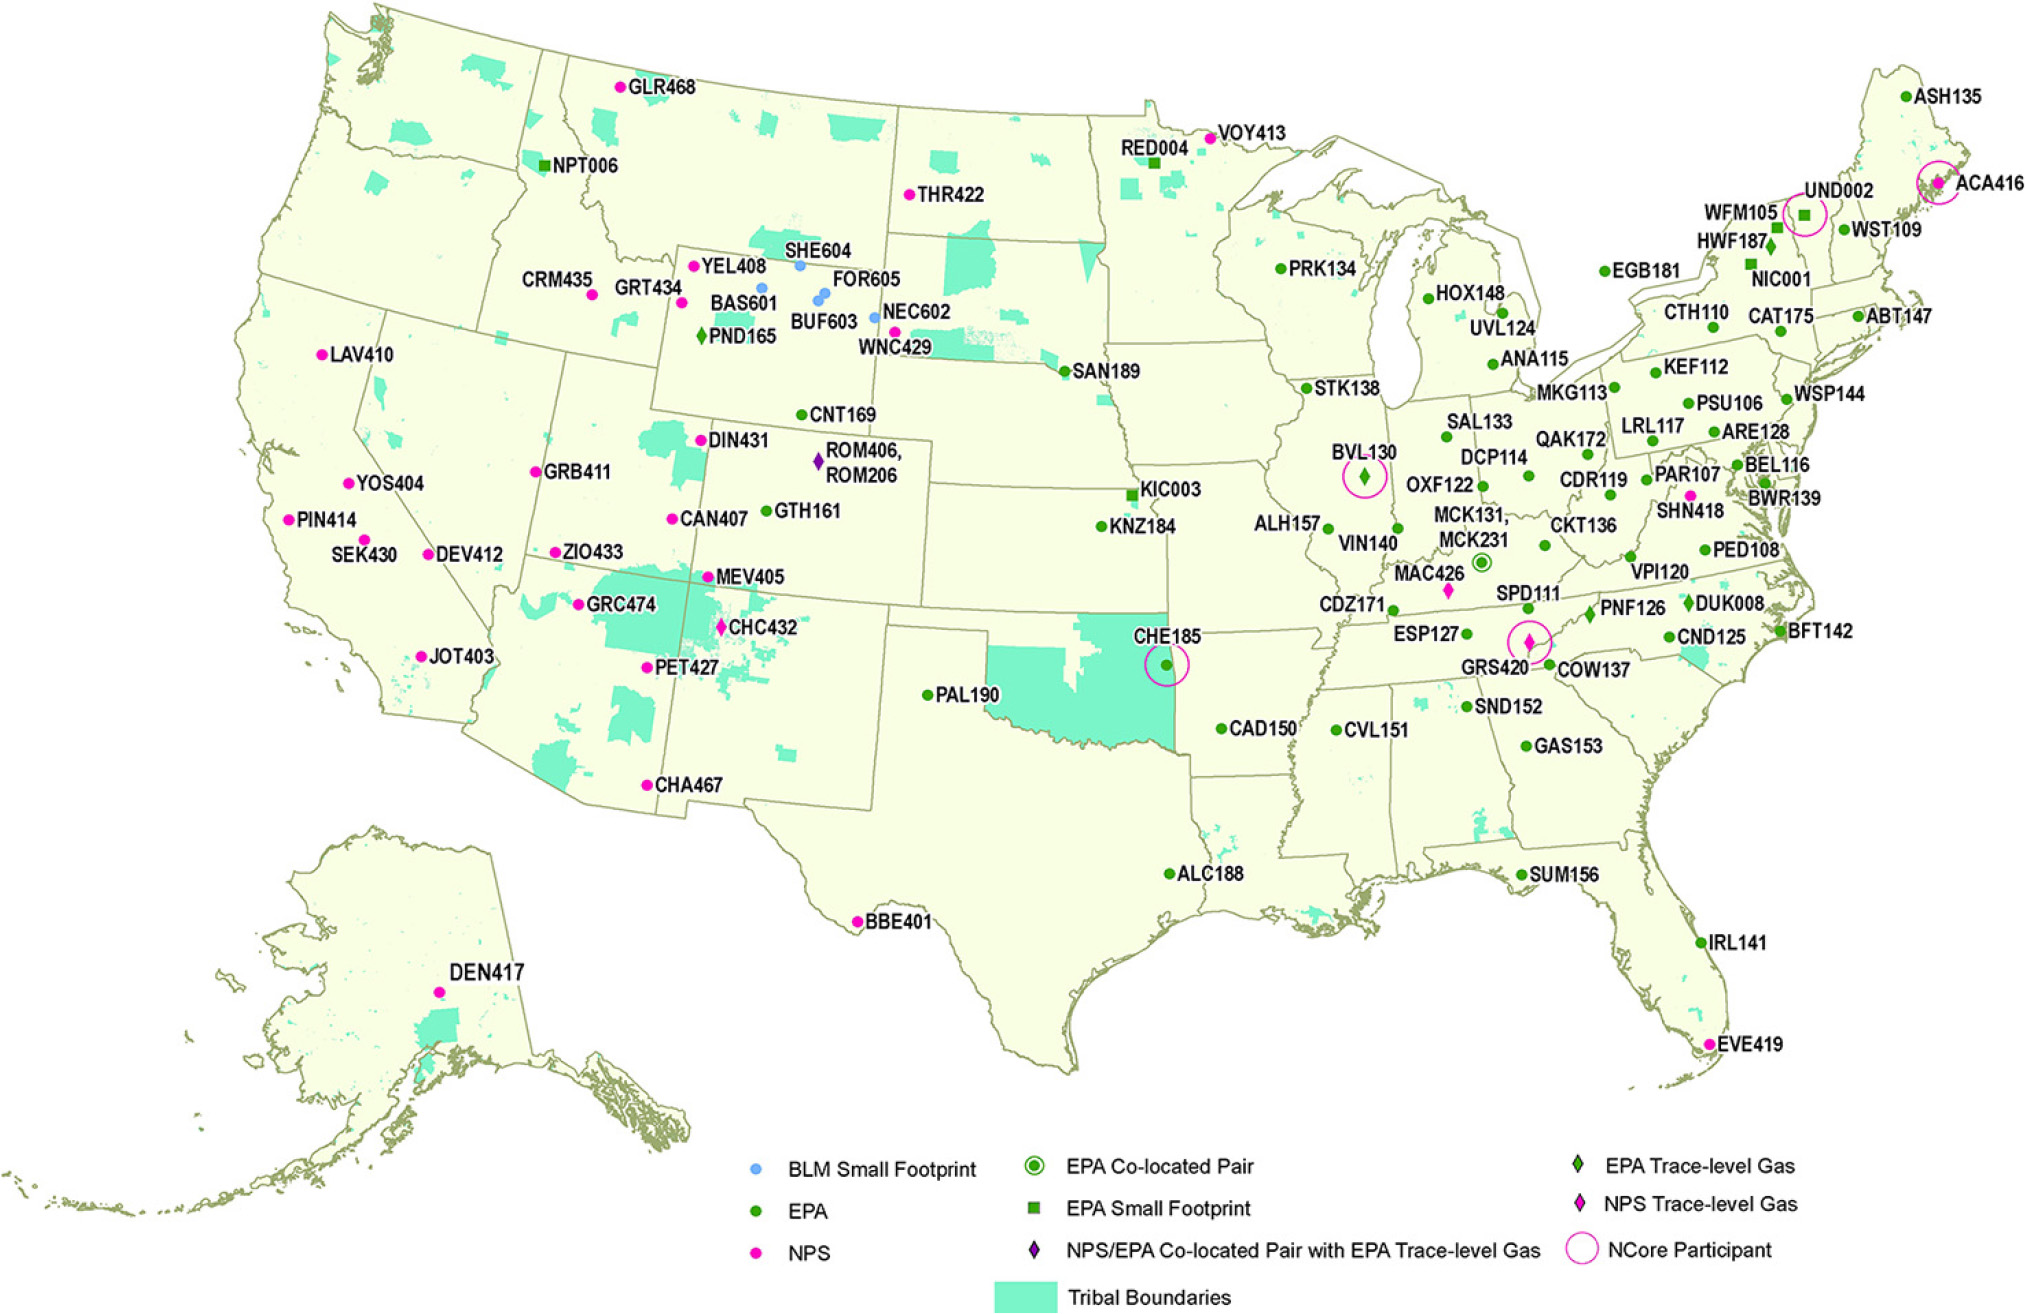
The Clean Air Status and Trends Network (CASTNET) operated 98 monitoring stations throughout the contiguous United States, Alaska, and Canada in 2019. Ninety-three sites included filter pack systems to sample weekly concentrations of acidic gases and particulate matter (PM). Eighty-six sites included continuous ozone (O3) analyzers. The U.S. Environmental Protection Agency (EPA), the National Park Service (NPS), and the Bureau of Land Management-Wyoming State Office (BLM) are the primary sponsors of CASTNET. NPS began its participation in 1994 and operated 30 sites during 2019. The BLM operated five sites in Wyoming. Site locations can be viewed on the CASTNET website.
Many organizations, including Native American tribes, state and federal government agencies, and universities, contribute to CASTNET. These participants sponsor individual CASTNET sites and provide in-kind services that support the overall performance of the network. For example, these participants operate and repair site instruments, change weekly filter packs, and perform general site maintenance. Many also provide the land for the CASTNET site
Locations of Monitoring Sites
A map of CASTNET monitoring sites is given in Figure 1. In 2019, 98 monitoring sites were operated at 96 distinct locations. To estimate precision across the network, co-located sites were operated at Mackville, KY (MCK131/231) and Rocky Mountain National Park, CO (ROM406/206) during 2019. The ROM406/206 pair ensures consistency between EPA (ROM206) and NPS (ROM406). Of the two Rocky Mountain monitoring sites, ROM406 is specified as the regulatory monitoring site for O3.
Measurements Recorded at CASTNET Sites
During 2019, all but five CASTNET sites measured weekly ambient concentrations of acidic pollutants, base cations, and chloride (Cl - ) using a 3-stage filter pack with a controlled flow rate (Wood, 2019; https://epa.gov/castnet/documents-reports). Gaseous pollutant concentrations include nitric acid (HNO3) and sulfur dioxide (SO2). Particulate concentrations include nitrate (NO3-), ammonium (NH4+ ), sulfate (SO42- ), magnesium (Mg 2+ ), calcium (Ca 2+ ), potassium (K + ), sodium (Na + ), and Cl - . The filter pack is replaced each Tuesday and shipped to the analytical chemistry laboratory for analysis. Ambient temperature is measured at all sites in part to enable conversion of concentrations to local conditions.
Most CASTNET sites also include a temperature-controlled shelter and continuous O3 monitoring system. Ozone concentrations were measured at 86 of the 98 sites. The O3 inlet and filter pack are located atop a 10-meter tower. Some CASTNET sites also measure trace-level SO2, carbon monoxide, and nitric oxide/total reactive oxides of nitrogen (NO/NOy). One site measures NO/total nitrogen oxides (NOx). In 2019, meteorological parameters were measured at 5 EPA-, 30 NPS-, and 5 BLM-sponsored CASTNET sites. Measured meteorological parameters include 2-m temperature, wind speed and direction, standard deviation of the wind direction, solar radiation, relative humidity, precipitation, and surface wetness (at select sites).
Trends in fourth highest daily maximum 8-hour average (DM8A) O3 concentrations and annual sulfur and nitrogen levels are depicted in the following sections using box plots showing 1-year mean, median, and annual distributions of concentrations aggregated from 34 eastern reference sites for 1990 through 2019 and for 16 western reference sites for 1996 through 2019. The reference sites were selected for their longterm data records and consistent performance. All data used to create the figures and maps in this report are available on the CASTNET website.
Related Air Quality Networks
CASTNET monitors air quality and deposition in cooperation with other national and international networks. EPA uses data from CASTNET and the other long-term national networks to assess the effectiveness of emission control programs and to characterize rural air quality nationwide. These networks include the National Atmospheric Deposition Program (NADP) and its affiliated networks:
- National Trends Network (NTN)
- Ammonia Monitoring Network (AMoN)
- Mercury Deposition Network (MDN)
- Atmospheric Mercury Network (AMNet)
Other cooperating networks include:
- Canadian Air and Precipitation Monitoring Network (CAPMoN)
- EPA’s National Core Monitoring (NCore)
- BLM’s Wyoming Air Resources Monitoring System (WARMS)
- Interagency Monitoring of Protected Visual Environments (IMPROVE)
Quality Assurance Program
The CASTNET quality assurance (QA) program was established to ensure that all reported data are of known and documented quality in order to meet CASTNET objectives. The QA program also ensures intranetwork consistency and comparability and the delivery of data that are reproducible and comparable with data from other monitoring networks. The 2019 QA program elements are documented in the CASTNET Quality Assurance Project Plan (QAPP; Wood, 2019). The QAPP includes standards and policies for all components of project operation, from site selection through final data reporting, with appendices that provide standard operating procedures for CASTNET operations. QA program metrics are available in quarterly and annual QA reports posted on the EPA CASTNET website.
Network Safety and Natural Disaster Preparedness
The CASTNET 2018 Annual Report (Wood, 2020) discussed network operational challenges associated with instrument and equipment wear and extreme weather. Safety is another major element of network operation. CASTNET is operated to ensure the safety of project participants. All Wood and subcontractor personnel must comply with the requirements of the CASTNET Health and Safety Plan (Wood, 2019), which addresses the health and safety hazards of each project task.
Guidance for the operation of CASTNET monitoring sites during natural disasters was developed in response to the threat and damage caused by hurricanes during 2018. Natural disasters are meteorological or geological events that pose potentially catastrophic risk to CASTNET monitoring. They include earthquakes and severe weather events associated with hurricanes, tropical storms, tornadoes, floods, and wildfires.
Guidance for CASTNET monitoring sites under threat of natural disasters includes five main categories:
- Prevention – Preparing for potential disasters such as developing evacuation plans and environmental planning and design standards
- Preparedness – Planning and organizing for emergency activities including evaluating potential actions, training, providing appropriate equipment, and taking corrective action
- Response – Coordinating the response to the disaster requires managing resources and personnel
- Recovery – Restoring critical services (e.g., power, internet, telephone) and making infrastructure repairs are key to resuming normal site operations
- Mitigation – Assessing the potential for natural disasters and making structural and non-structural changes limits the impact of future disasters
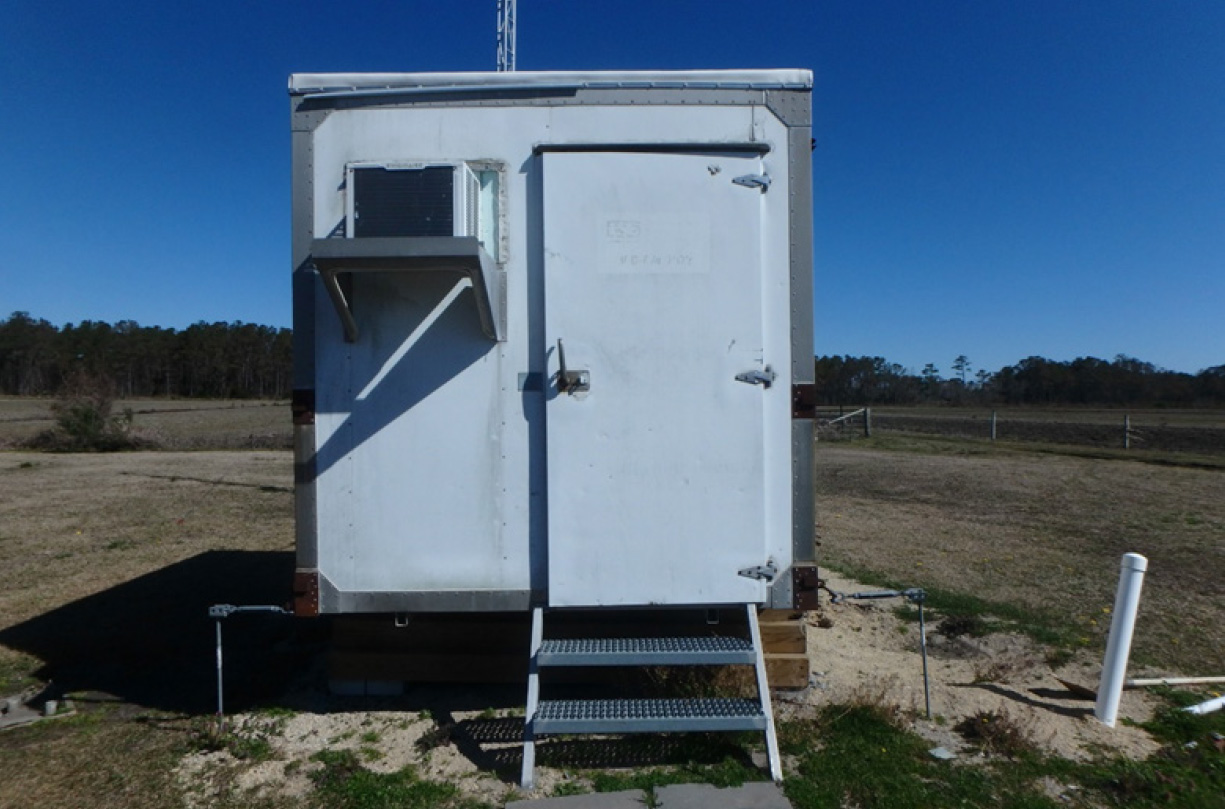
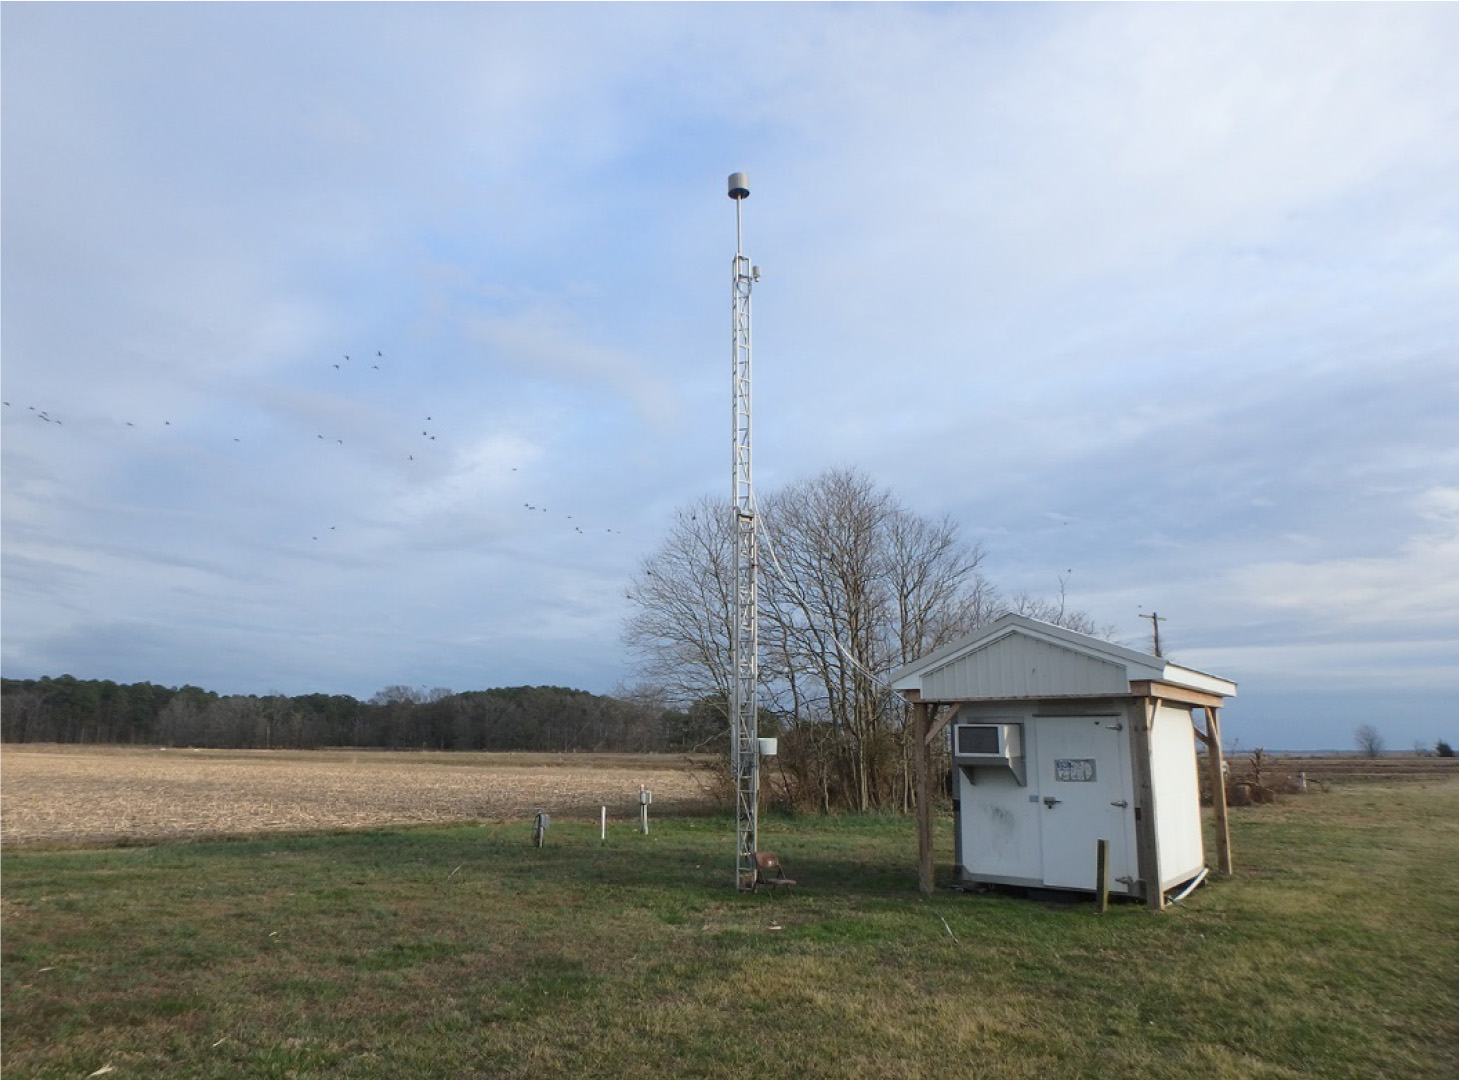
The effectiveness of the natural disaster guidance will vary depending upon the type and severity of the event. For example, advance warning for an approaching storm may allow for emergency preparations ahead of any danger, but advance warning is not feasible for an earthquake. Action/recovery plans will be event-dependent. Figure 2 shows an elevated shelter at BFT142, NC, a mitigation measure taken after flooding from Hurricane Florence in 2018.
Ozone Concentrations
CASTNET O3 data collection is subject to rigorous QA/quality control procedures specified by the CASTNET QA Program. Hourly average concentrations were measured at 86 CASTNET sites in 2019. One site, Duke Forest, NC (DUK008), did not meet siting criteria and was non-regulatory. Data from the other 85 sites were delivered routinely to the EPA Air Quality System (AQS) database (epa.gov/aqs). With the exception of data from two co-located sites that were designated as National Ambient Air Quality Standards (NAAQS)- excluded and used for QA purposes, only, data from these sites were used to calculate the three-year average of the fourth highest DM8A O3 concentrations if three years of Title 40 Code of Federal Regulations Part 58-compliant data were available (Figure 3). CASTNET measurements provided data to support comparison with the O3 NAAQS and to assess long-term trends and geographic patterns in regional O3 .
The primary O3 NAAQS is designed to protect public health. The secondary standard is designed to protect public welfare and the environment. On October 1, 2015, the EPA promulgated a revision to the O3 NAAQS, lowering the level of both the primary and secondary standards to 0.070 parts per million (ppm;). On December 23, 2020, EPA decided to retain the 2015 O3 NAAQS without changes to the form or level. To attain the 2015 standard, the 3-year average of the fourth highest DM8A O3 concentrations measured at each monitor within a specified area must not exceed 0.070 ppm or 70 parts per billion (ppb) in practice. For this report, the 2015 standard and related calculations were used. The design values for each standard can be downloaded from the EPA Air Quality Design Values website.
The EPA and other federal, tribal, state, and local agencies measure hourly O3 concentrations through national and local monitoring programs. Measurements potentially affected by exceptional events, i.e., unusual or natural events that can affect air quality but are not reasonably controllable, were not removed when calculating the fourth highest daily maximum values for this report.
Three-year averages of the fourth highest DM8A O3 concentrations for 2017 through 2019 are presented in Figure 3. Ozone concentrations were not included on the map if the 3-year average was not available because of incomplete data; these sites are shown as dots with no value. Table 1 lists sites with 2017–2019 O3 design values greater than 70 ppb, the 2015 O3 NAAQS.
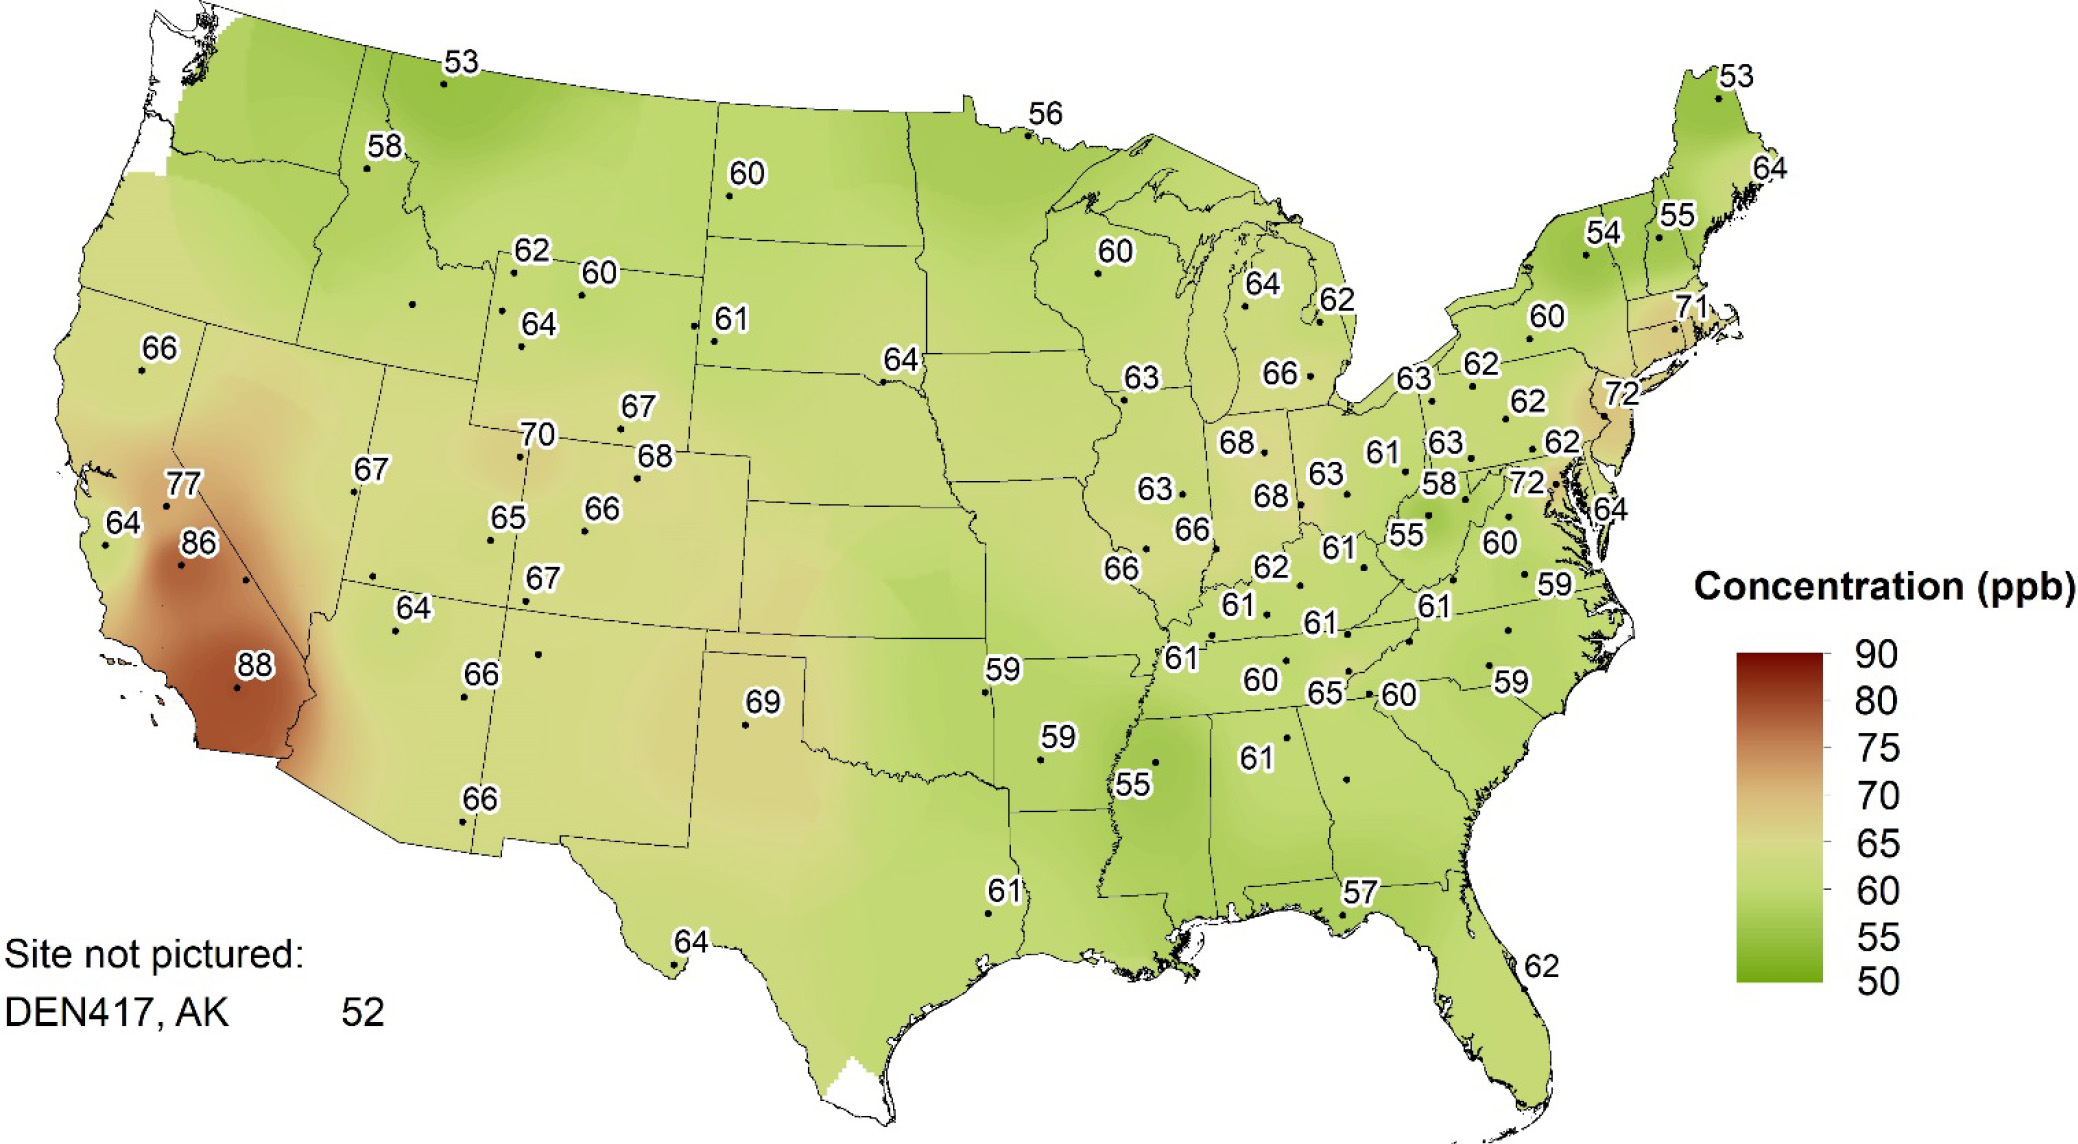
Table 1 2017–2019 O3 Design Values Greater than 70 ppb
| Site ID | State | Sponsor | 3-year Average |
|---|---|---|---|
| JOT403 | California | NPS | 88 |
| SEK430 | California | NPS | 86 |
| YOS404 | California | NPS | 77 |
| BEL116 | Maryland | EPA | 72 |
| WSP144 | New Jersey | EPA | 72 |
| ABT147 | Connecticut | EPA | 71 |
Figure 4 shows 2019 fourth highest DM8A O3 concentrations that met percent completeness criteria.
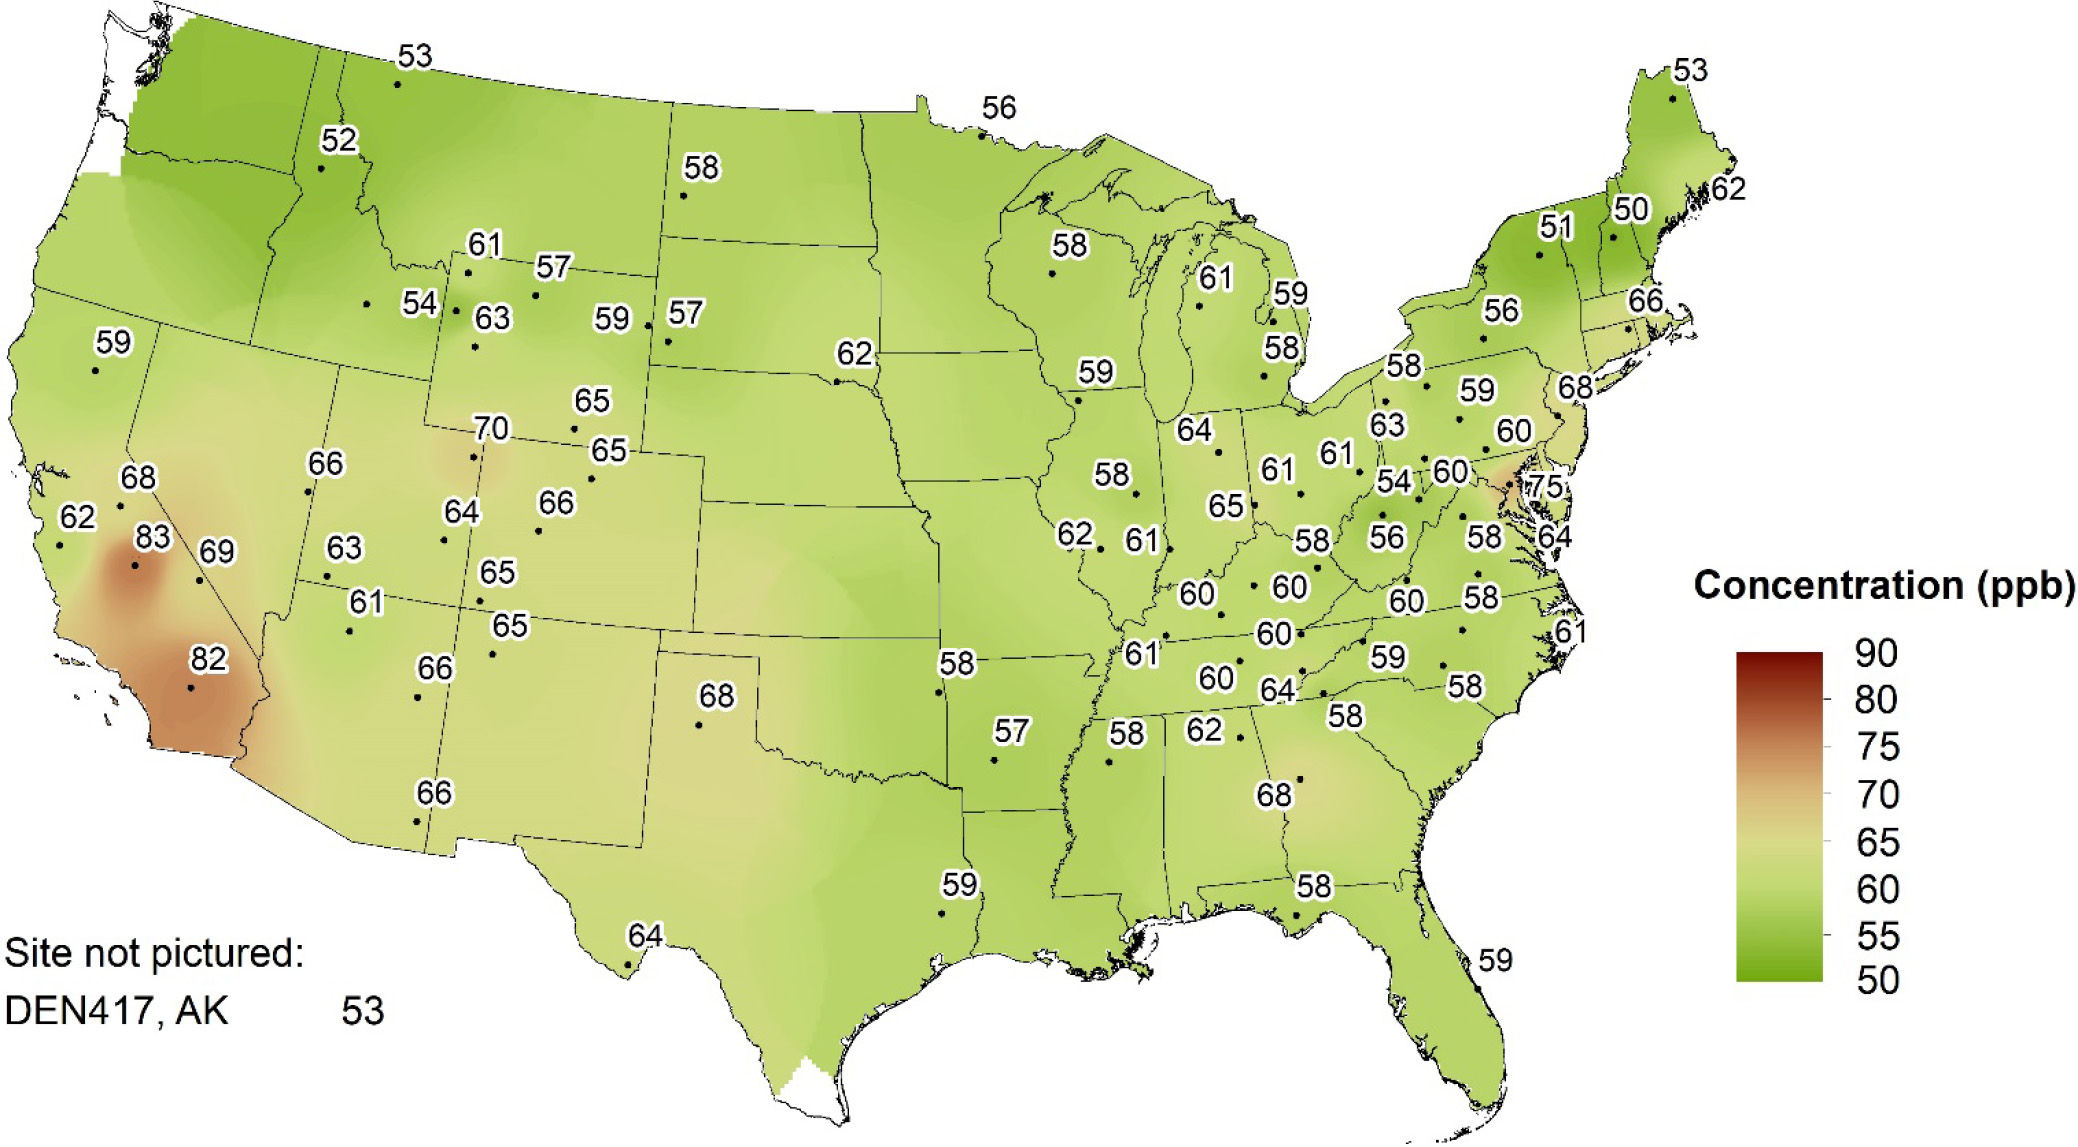
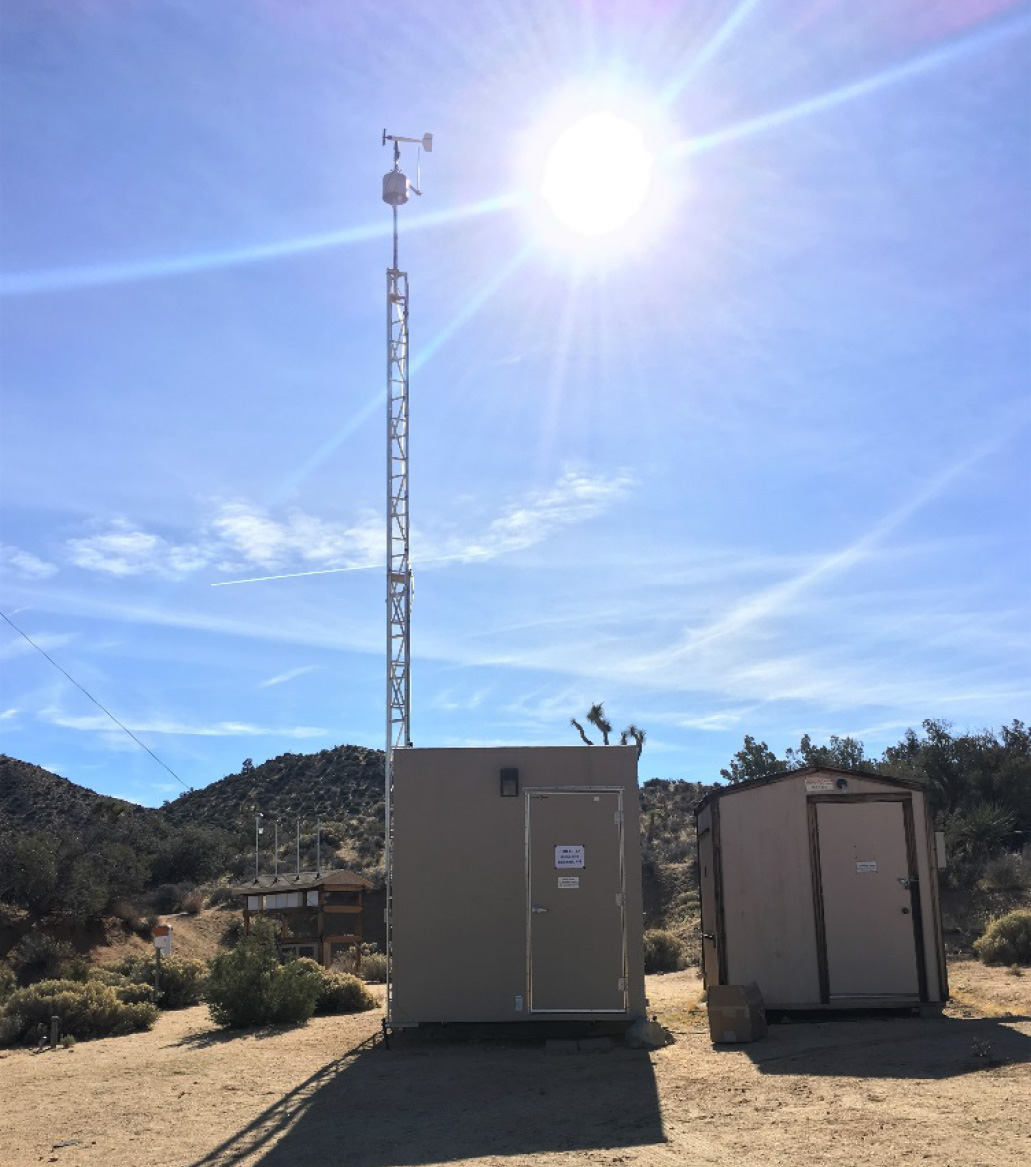
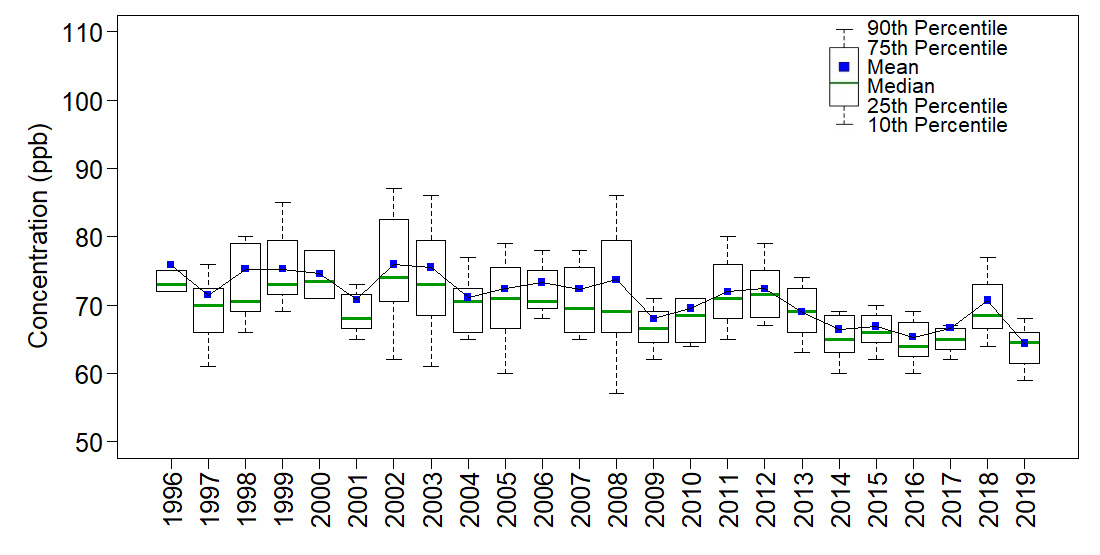
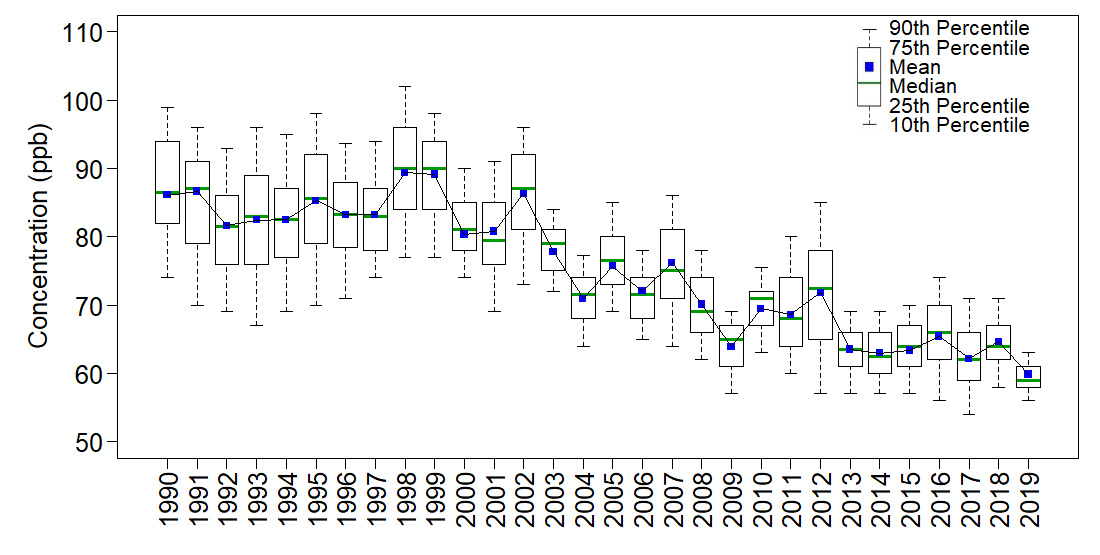
Figure 5 provides box plots depicting trends in 1-year mean, median, and annual distributions of fourth highest DM8A O3 concentrations from the 34 CASTNET eastern reference sites and the 16 western reference sites .
Figure 5 Trends in Fourth Highest DM8A O3 Concentrations
Nitrogen Atmospheric Concentrations
Annual mean concentrations of total NO3- (HNO3 + NO3-), NH4+ , and ammonia (NH3) for 2019 are presented in three maps. Trends in annual mean concentrations of total NO3- and NH4+ over the 30-year period, 1990 through 2019, were calculated from the eastern reference sites and for the 24-year period, 1996 through 2019, from the western reference sites. Trends in NH3 were estimated from AMoN data from 2008 through 2019.
Trace-level gas analyzers measured NOy at six EPA-sponsored and two NPS-sponsored CASTNET sites during 2019. These are presented at the end of this section.
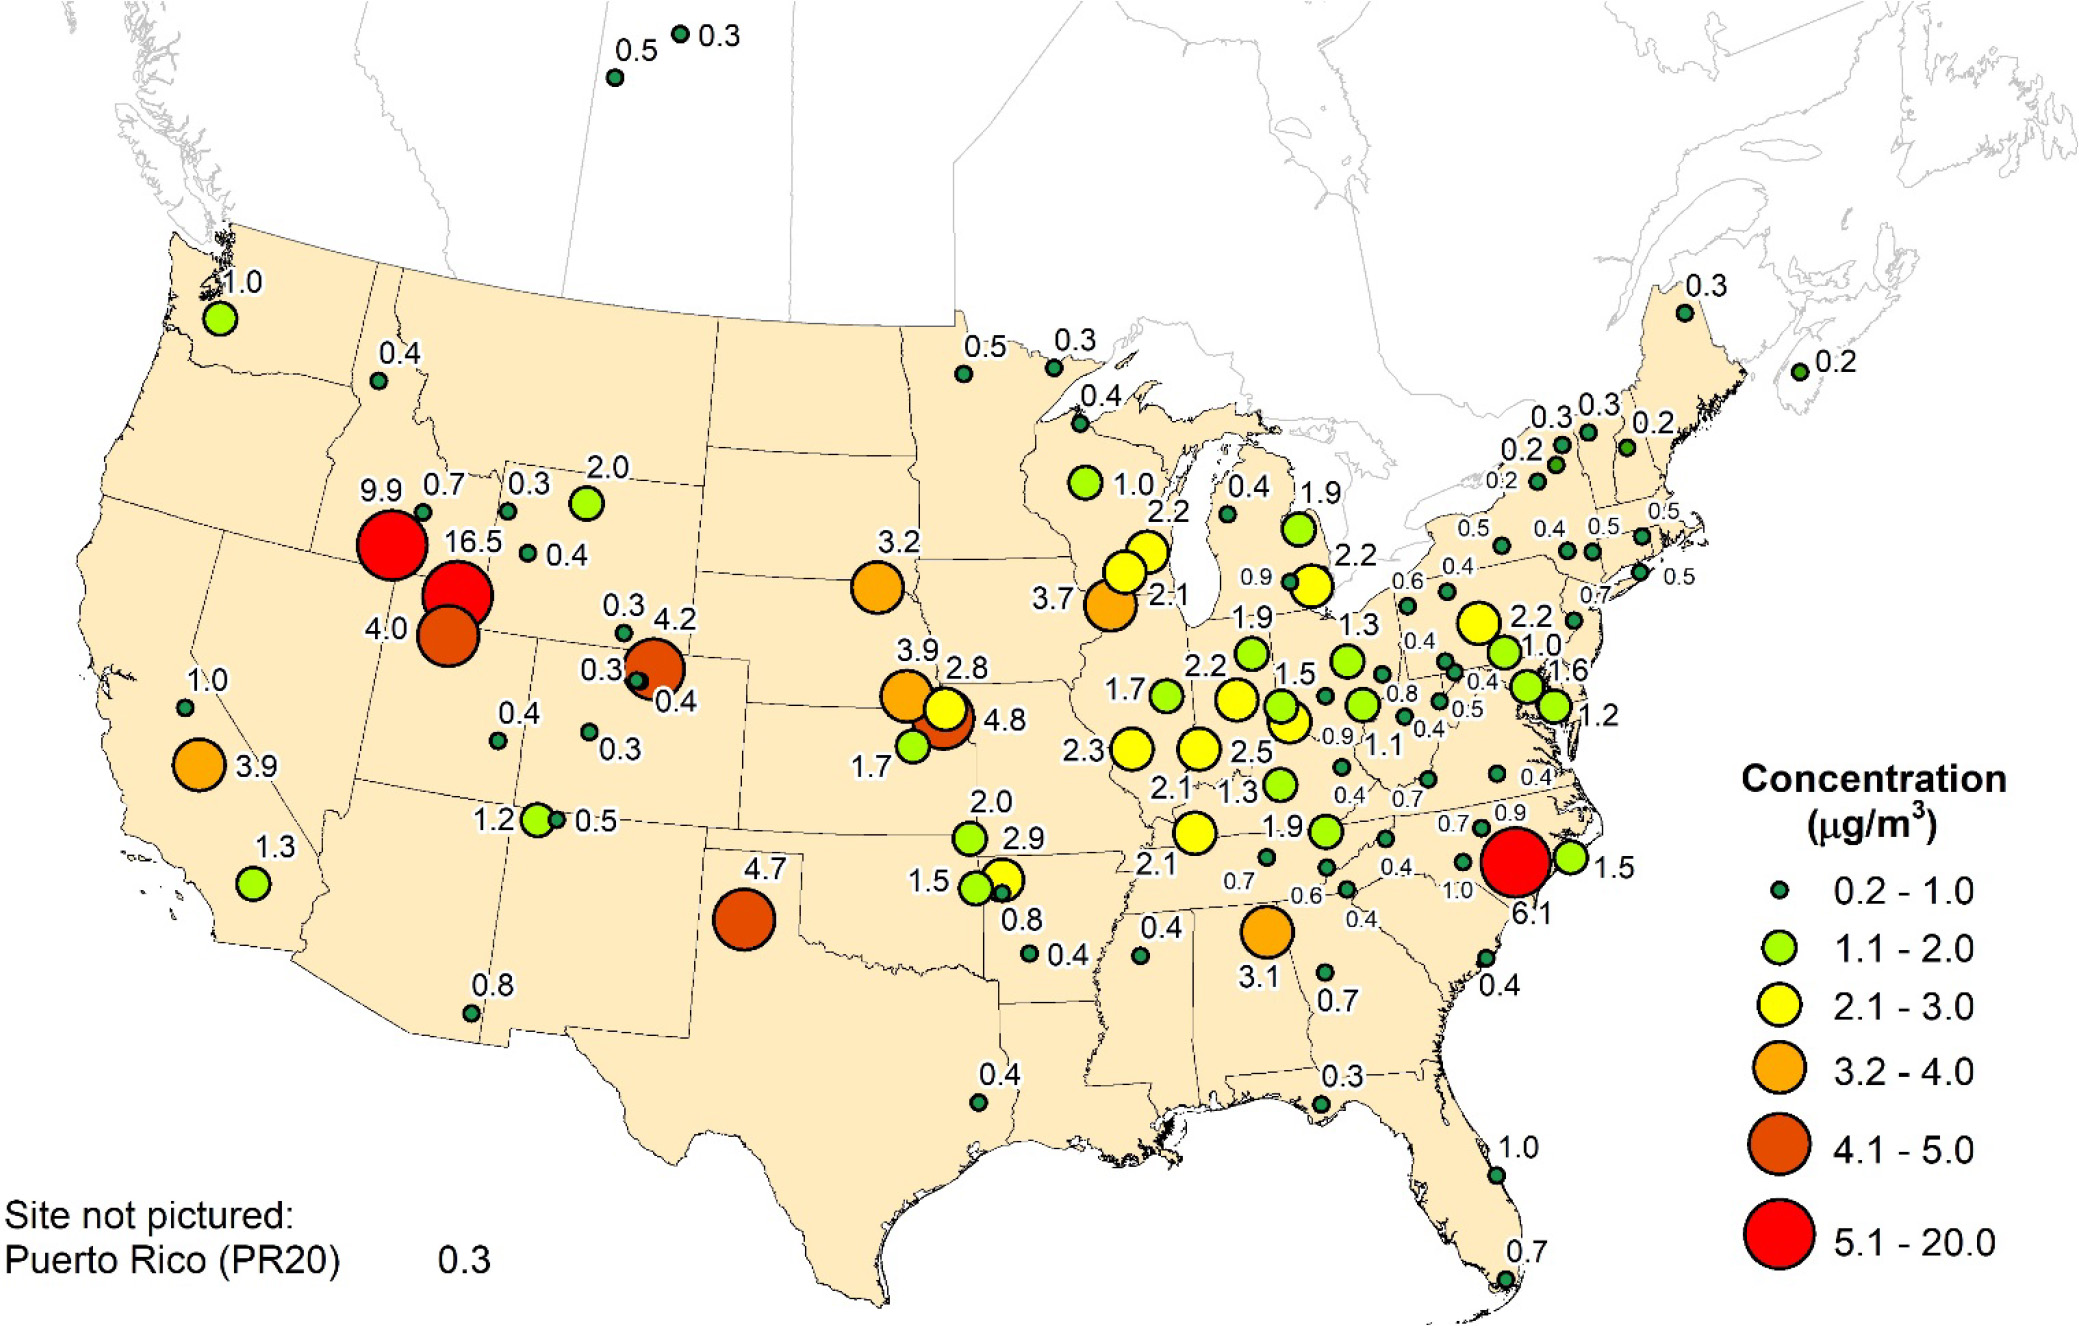
Total Nitrate Concentrations
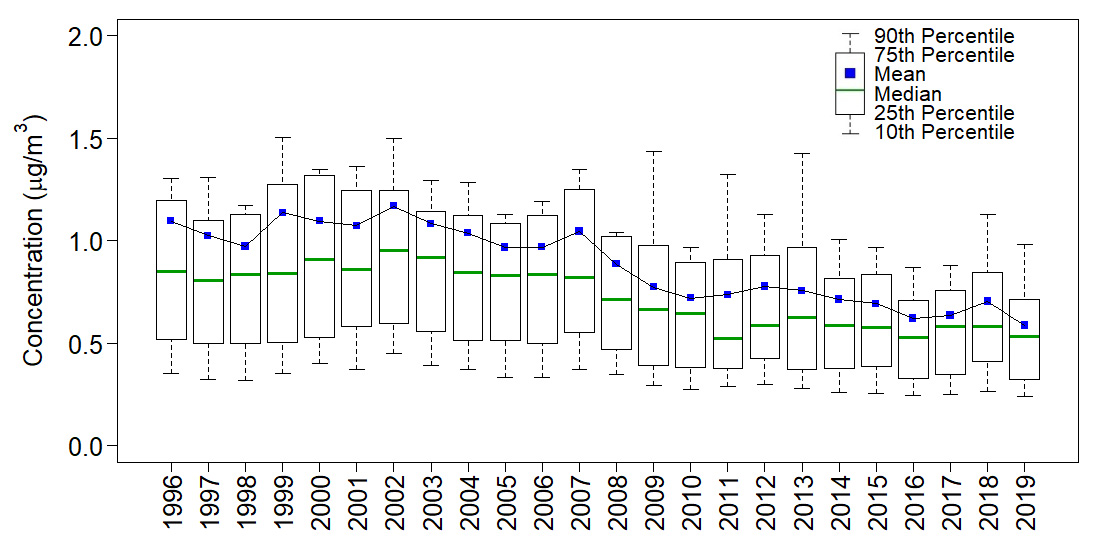
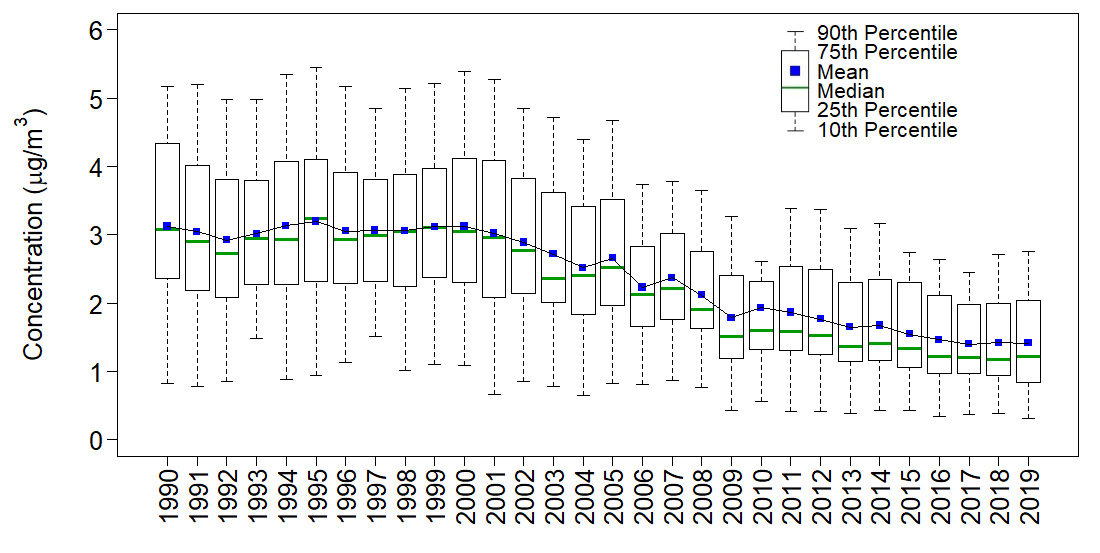
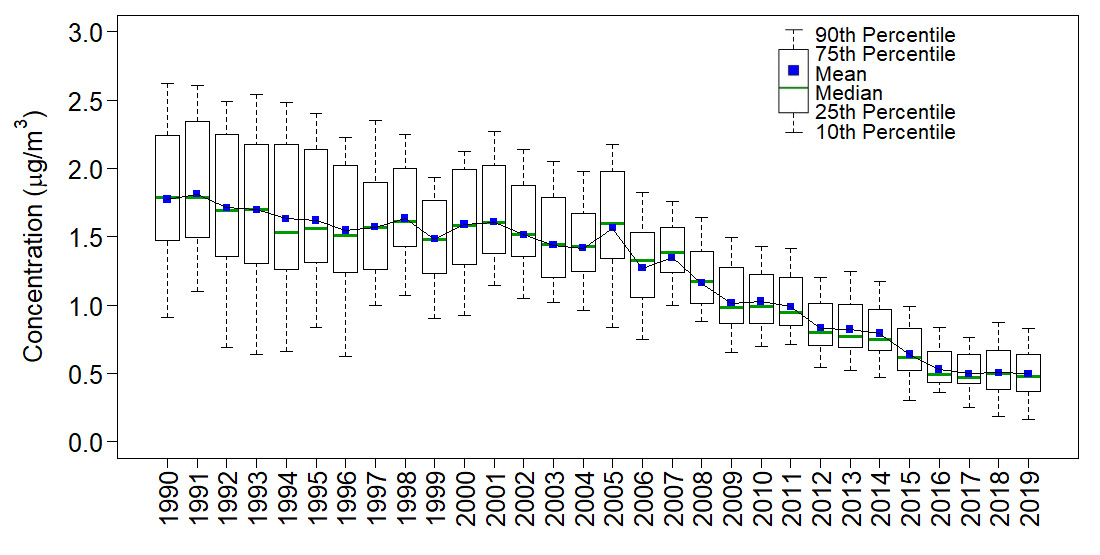
Mean total NO3- concentrations measured in 2019 are presented in the map in Figure 6. To illustrate trends, Figure 7 provides box plots of total NO3- levels for the eastern and western reference sites through 2019.
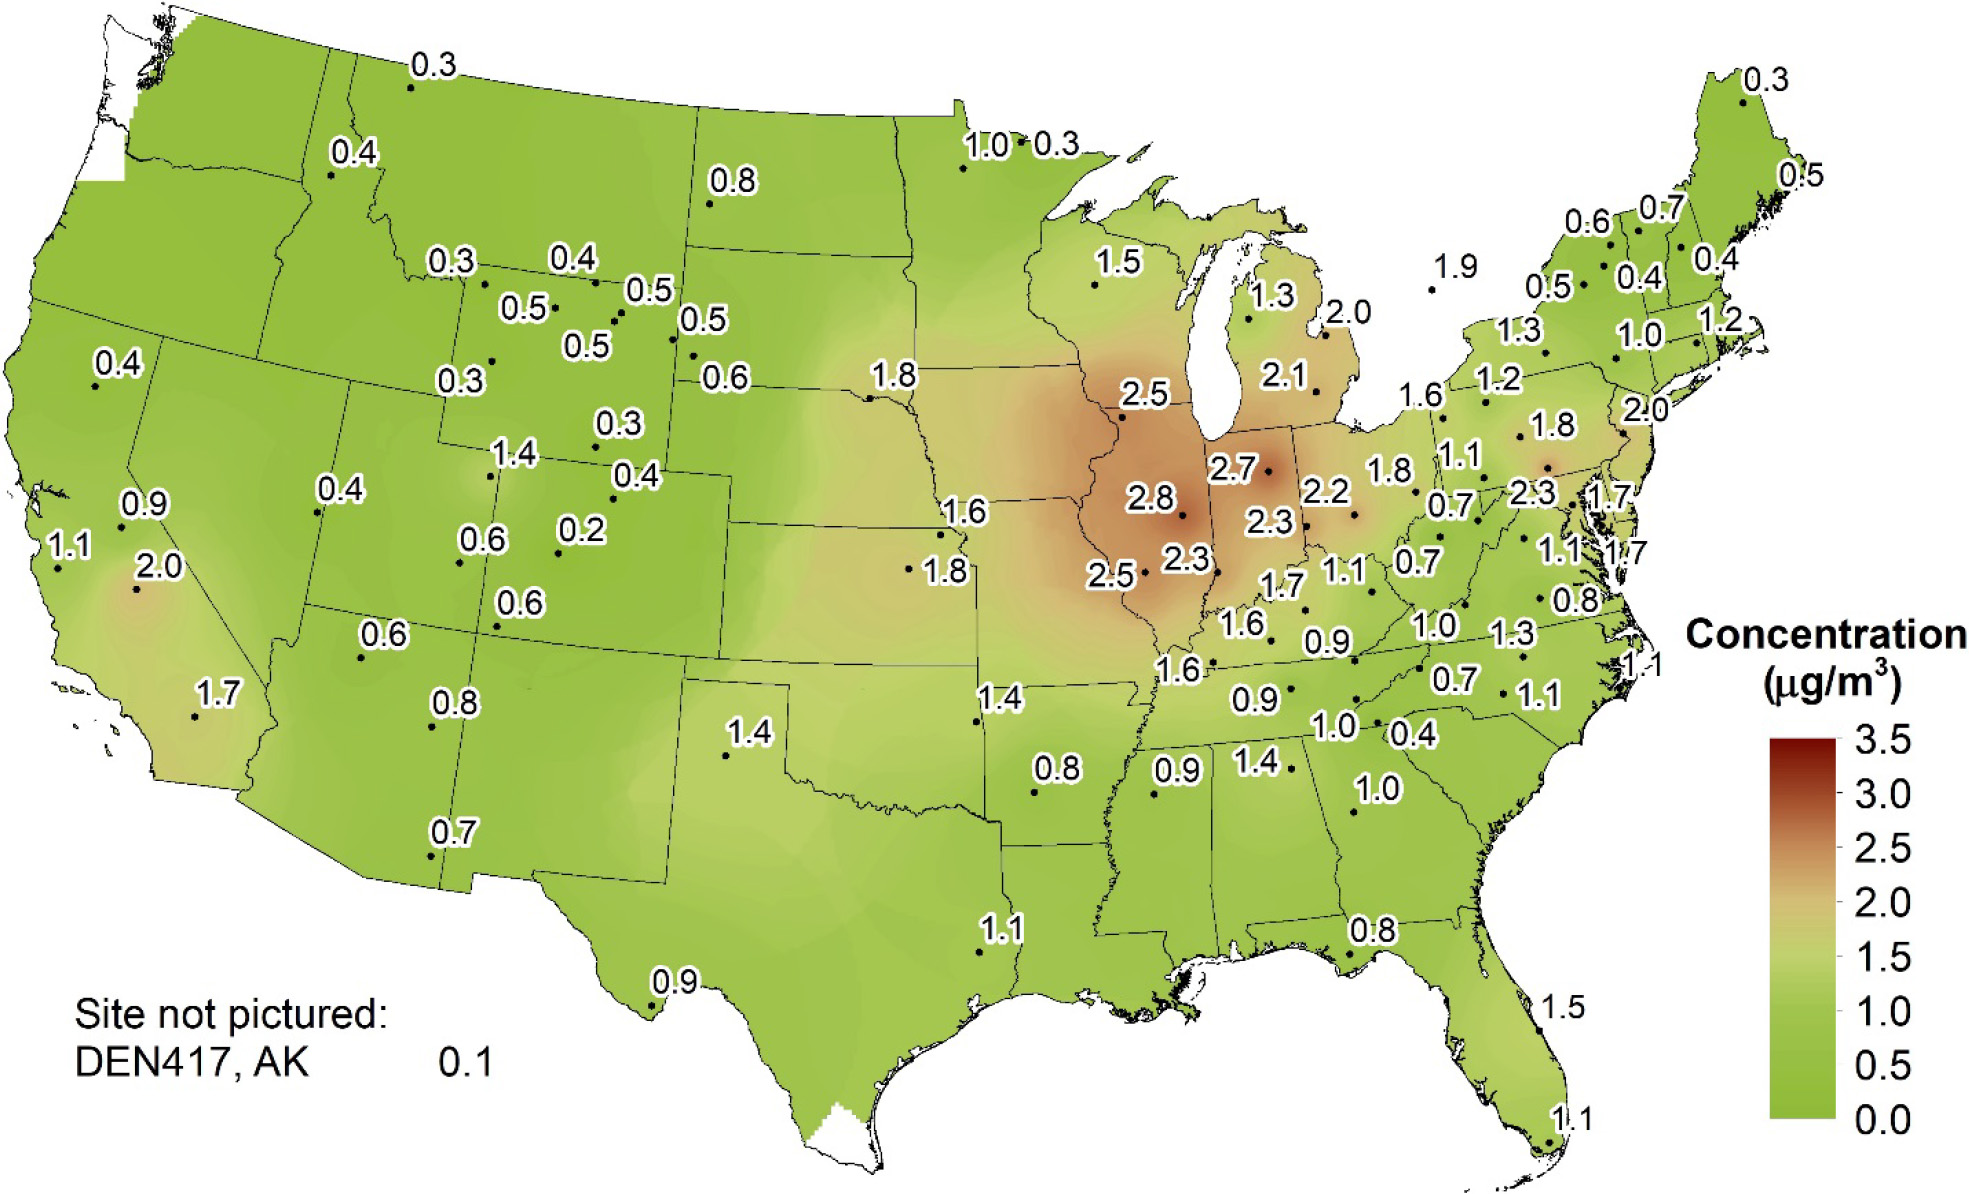
Figure 7 Trends in Annual Mean Total NO3- Concentrations
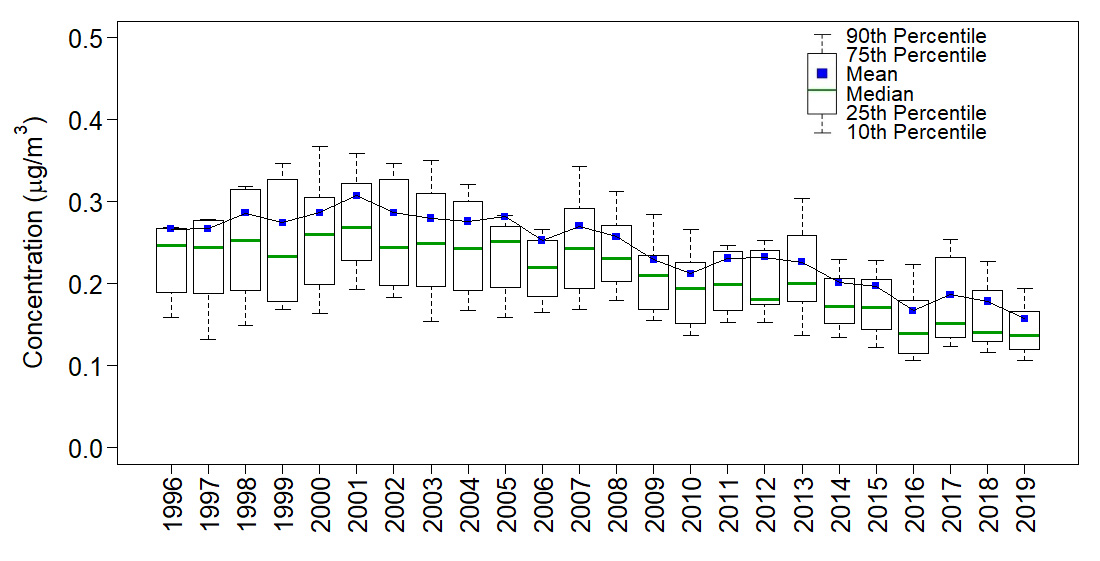
Particulate Ammonium Concentrations
A map of 2019 mean particulate NH4+ concentrations is provided in Figure 8. Figure 9 shows box plots of NH4+ concentrations.
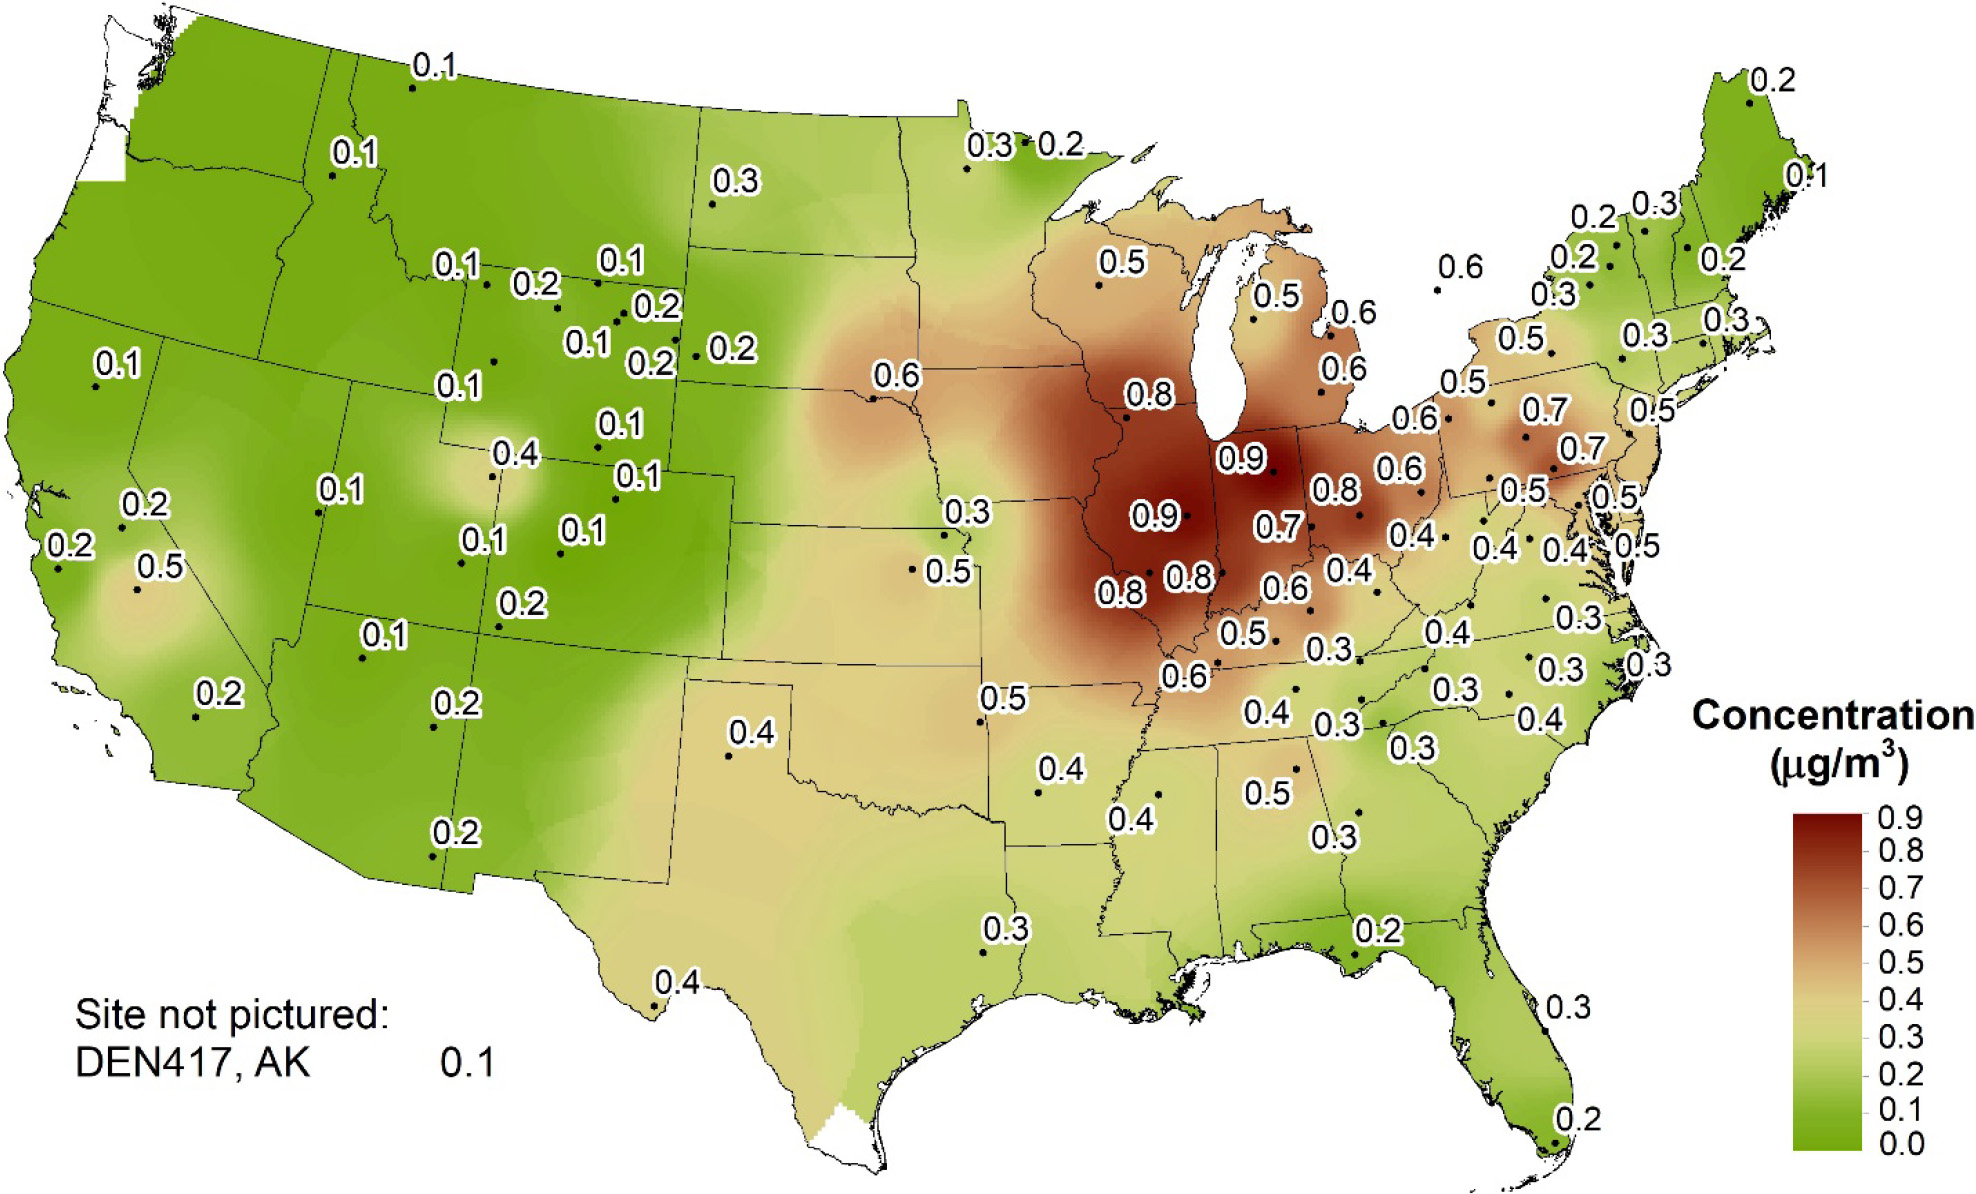
Figure 9 Trends in Annual Mean NH4+ Concentrations
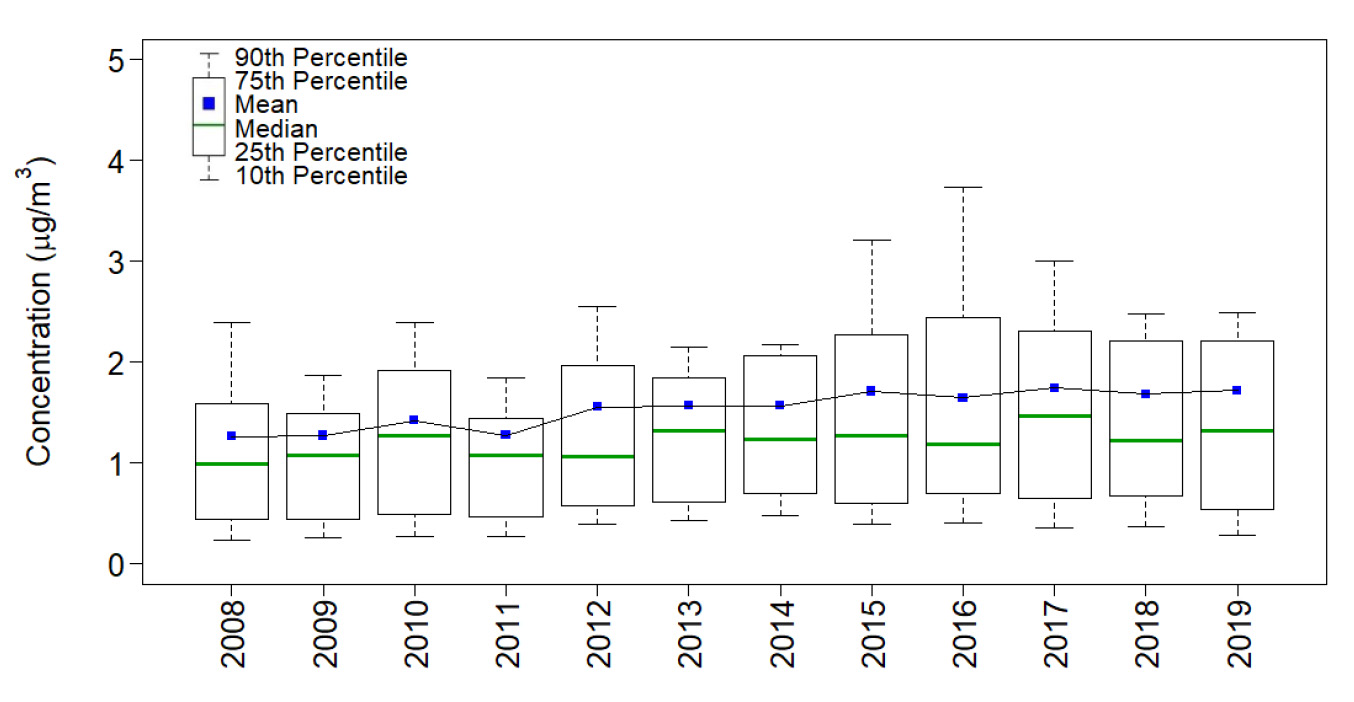
Ammonia Concentrations
Average annual NH3 concentrations for 2019 for AMoN sites that met completeness requirements are mapped in Figure 10. Trends are shown in Figure 11.
Continuous Trace-level NOy and Filter Pack Total Nitrate Concentrations
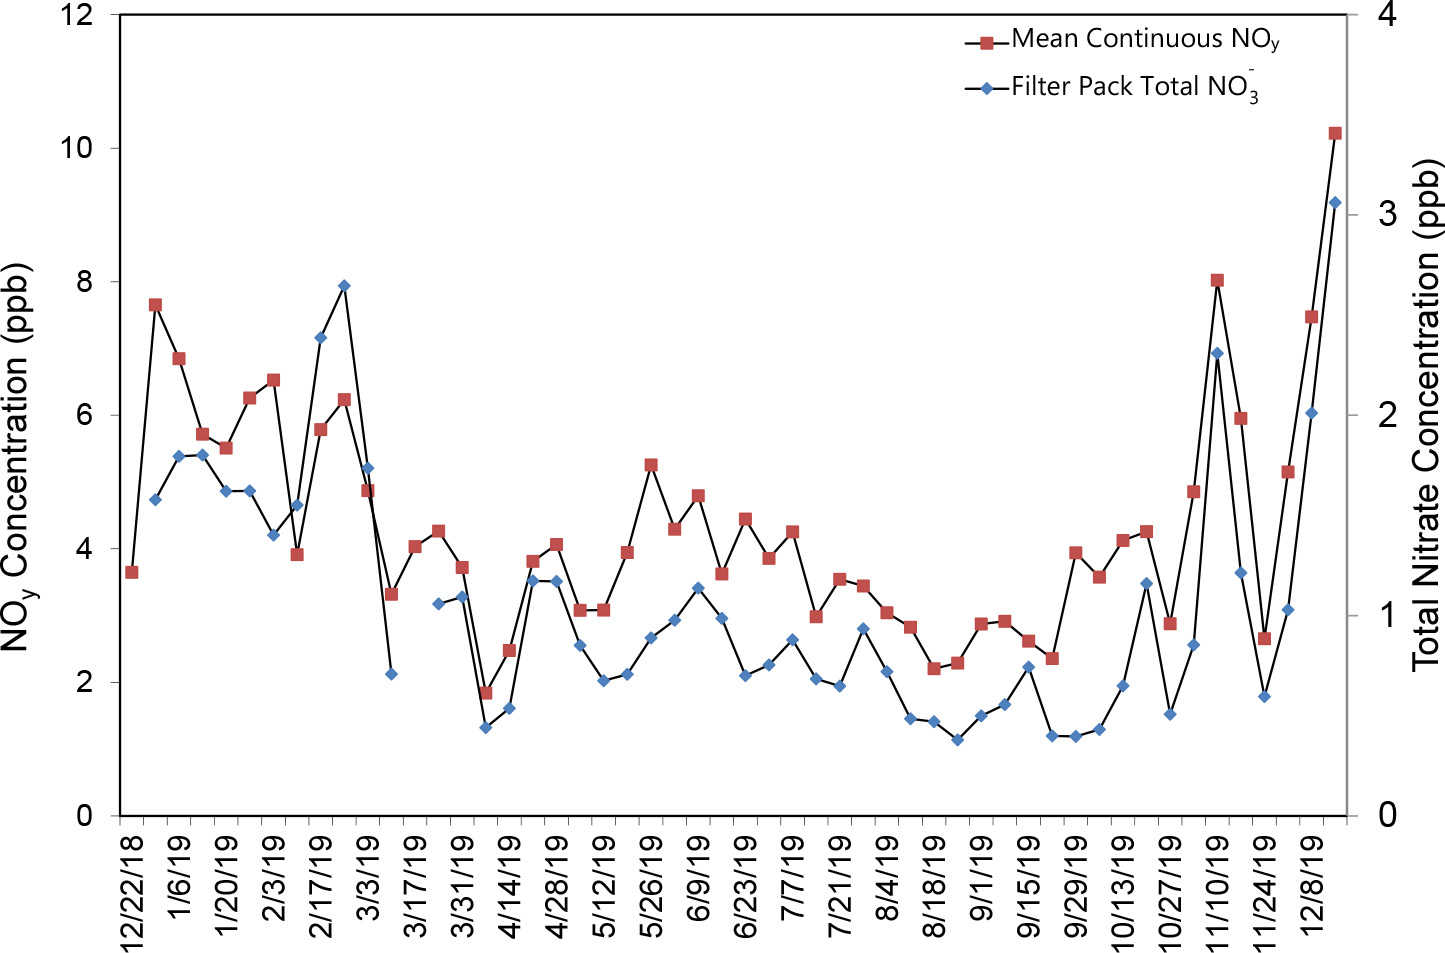
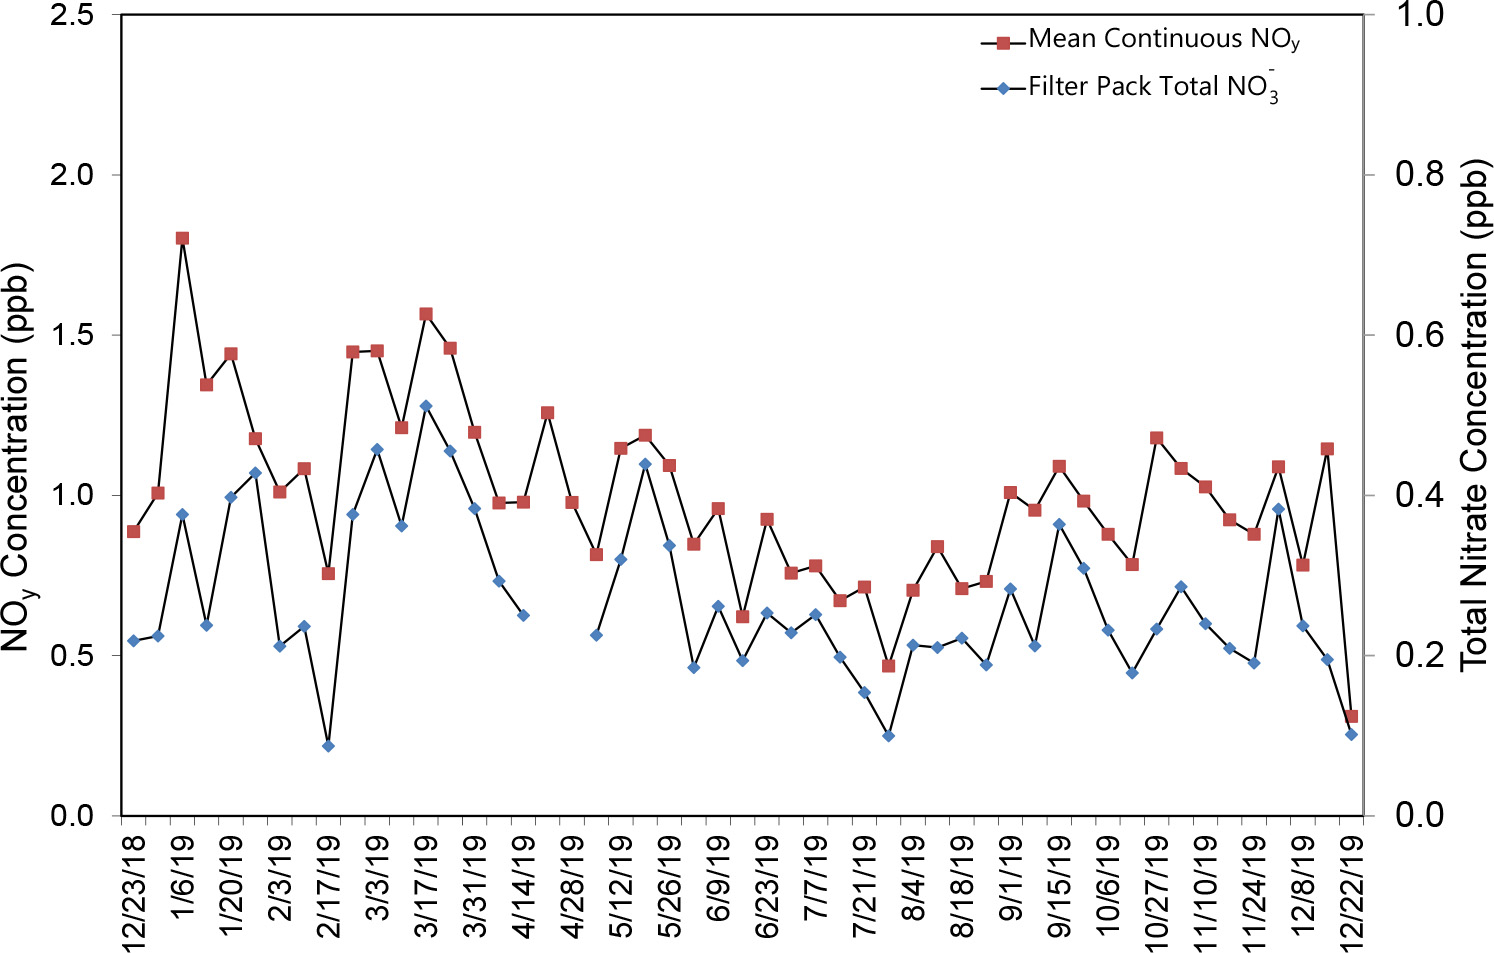
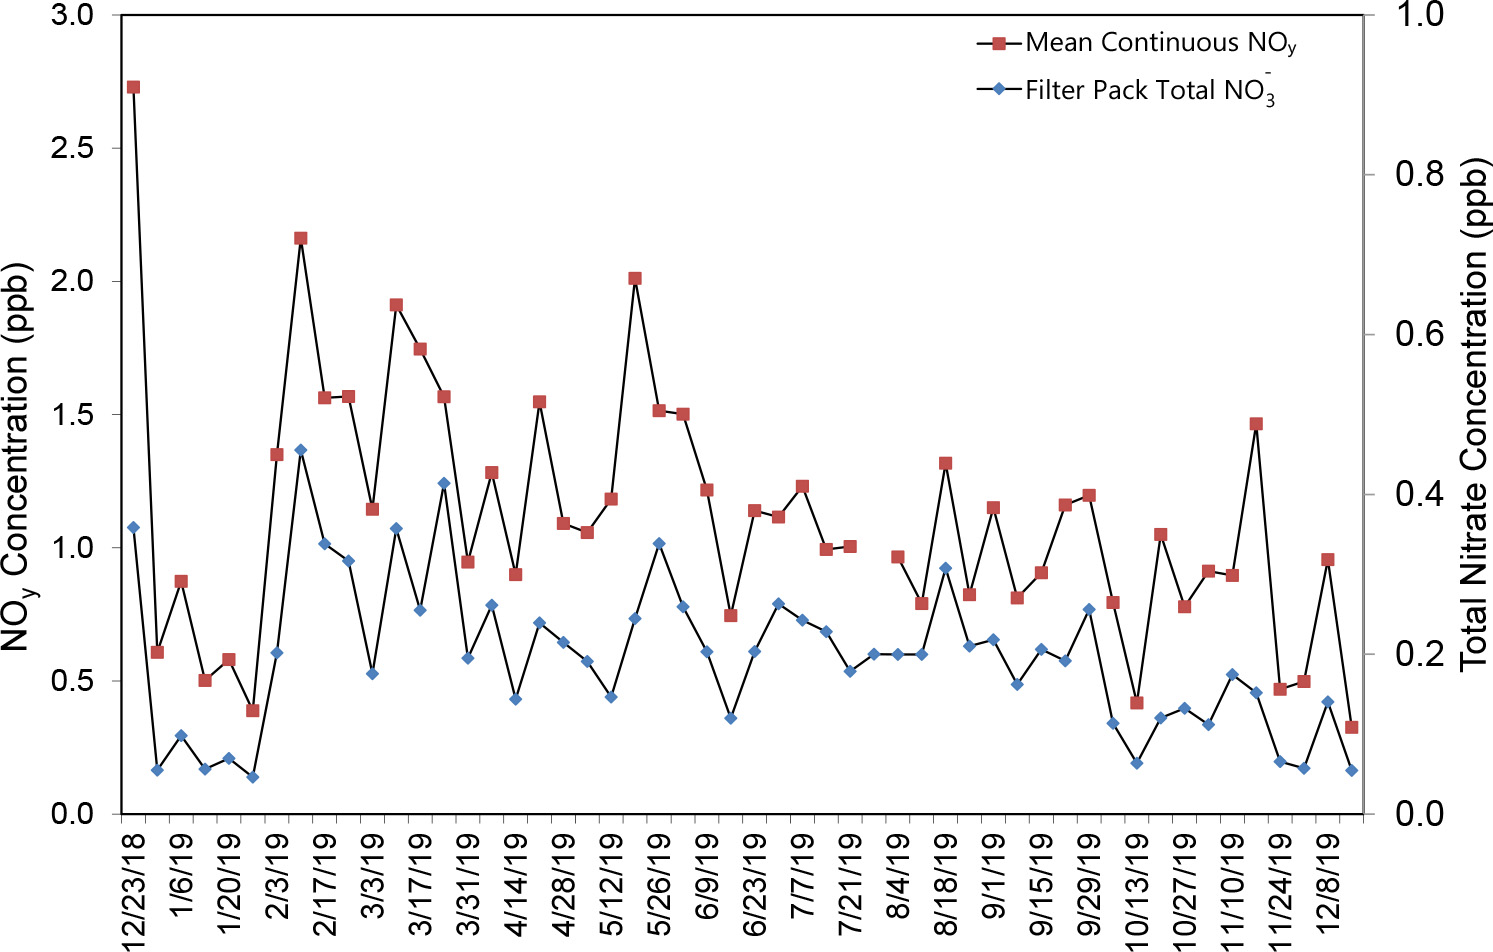
Nitric acid and particulate NO3- are measured on CASTNET filter packs, and the sum is reported as total NO3-. NOy is defined as NOx (NO + nitrogen dioxide) plus NOz (HNO3, nitrous acid, peroxyacetyl nitrate, peroxyproyl nitrate, other organic nitrates, and nitrite). It consists of reactive gases that are considered precursors of O3 and fine particulate matter (PM2.5). Because HNO3 and particulate NO3- are measured as components of NOy, NOy concentrations should always be higher than total NO3- levels (i.e., the ratio of NOy to total NO3- should always be greater than 1.0). A comparison of weekly mean continuous NOy concentrations with filter pack total NO3- levels at BVL130, IL; PNF126, NC; and ROM206, CO for 2019 was used to evaluate the 2019 measurements (Figures 12 through 14). The scales for NOy and total NO3- levels are different in the three figures. The NOy concentrations were consistently higher than the total NO3- levels, as expected. The results are similar for the eight sites operating continuous NOy analyzers. The weekly total NO3- concentrations, the average weekly NOy levels, and their ratios are listed in Table 2. These were calculated as the average of all valid weekly filter pack concentrations, the average of mean NOy values matching the run time of the weekly filter packs, and the average of the ratios calculated for each week.
Figure 12 Comparison of BVL130, IL Weekly Mean Continuous Trace-level NOy and Filter Pack Total NO3- Concentrations
 Download Figure
Figure 13 Comparison of PNF126, NC Weekly Mean Continuous Trace-level NOy and Filter Pack Total NO3- Concentrations
 Download Figure
Figure 14 Comparison of ROM206, CO Weekly Mean Continuous Trace-level NOy and Filter Pack Total NO3- Concentrations
 Download Figure
Table 2 Summary of Total NO3- and NOy Measurements for 2019
| Site Location | Elevation (m) | Total NO (ppb) | NOy (ppb) | Ratio |
|---|---|---|---|---|
| DUK008, NC | 164* | 0.52 | 2.77 | 5.56 |
| BVL130, IL | 213 | 1.07 | 4.32 | 4.55 |
| MAC426, KY | 243 | 0.60 | 2.39 | 4.30 |
| HWF187, NY | 497 | 0.16 | 1.13 | 8.64 |
| GRS420, TN | 793 | 0.39 | 1.45 | 3.42 |
| PNF126, NC | 1216 | 0.27 | 1.00 | 3.93 |
| PND165, WY | 2386 | 0.13 | 0.62 | 5.04 |
| ROM206, CO | 2742 | 0.19 | 1.11 | 6.19 |
Note: *Enhanced NOy monitor located at the top of the 30-m tower
Improving Characterization of Reduced Nitrogen at IMPROVE and CSN Monitoring Sites
Introduction
Over the past two decades, the chemical composition of the atmosphere has changed markedly from one dominated by oxidized secondary particles including NO3-, SO42- , carbonaceous aerosols, and their associated precursor gases (NOx, SOx, volatile organic compounds, and semivolatile organic compounds) to an atmospheric mixture that includes a significant amount of reduced inorganic nitrogen (NHx = NH4+ + NH3; Li et al., 2016; Du et al., 2014).
Total reduced inorganic nitrogen measurements are not routinely performed in the United States, and currently no regulatory requirements exist to measure NHx. However, scientific and policy interest in the increasing trend in NHx concentrations in many regions of the United States has grown. NHx can lead to atmospheric PM2.5 formation and visibility impairment and, once deposited, can cause eutrophication, loss of species biodiversity, and algal blooms. The Southeastern United States Reduced Nitrogen Study (Rogers et al., 2021) was sponsored by EPA and designed to measure reduced nitrogen and to assess measurement methods for implementation in long-term monitoring networks, specifically the IMPROVE and Chemical Speciation (CSN) networks. IMPROVE provides routine measurements of speciated particulate matter that support regional haze rules and PM NAAQS attainment designations. CSN provides data to support emission control strategies, health effects research, and model evaluation.
The goal of the study was to determine if phosphorous acid (H3PO3)-coated filters could be deployed at existing sites using standard network equipment to measure reduced nitrogen concentrations in hot, humid environments. Incorporating an NHx measurement into the CSN and IMPROVE networks would leverage the existing networks’ infrastructure, reduce costs, and provide national coverage. The addition of NHx also offers the potential of providing NHx and NH4+ estimates at sites co-located with AMoN. Because of cost and logistical issues, the use of speciation samplers for 24-hour NHx samples, collected every 3 days, would be a cost-effective way to measure spatial and temporal variability of NHx and reduce its uncertainties. When co-located with AMoN, monthly, seasonal, and annual averages of particulate NH4+ can be generated. Chen et al. (2014) performed a similar study in the western and midwestern United States using only the IMPROVE sampler. In that study, the acid-impregnated filter data compared well with measurements from the URG annular denuder filter pack system (ADFPS).
Ammonia is the precursor emission while particulate NH4+ is a controllable pollutant under the PM NAAQS. Measurements of NHx would provide a metric for evaluating emission inventories, evaluating chemical transport models, and providing input into nitrogen deposition estimates. The importance of understanding trends and the spatial variability of reduced nitrogen is already recognized. Particulate NH4+ concentrations are measured at more than 150 CSN sites and more than 90 CASTNET sites, and NH3 concentrations are measured at more than 100 sites as part of AMoN. Data from approximately 60 colocated CASTNET and AMoN sites can be combined to provide measured NHx concentrations, but these are integrated over 1 and 2 weeks, respectively. Additionally, the CSN measurements are known to underestimate NH4+ concentrations (Yu et al., 2006). In short, CASTNET weekly integrated samples and AMoN two-week samples are most suitable for seasonal and annual characterizations in rural areas while CSN and some IMPROVE sites could potentially measure NHx concentrations in urban environments.
Locations of Monitoring Sites
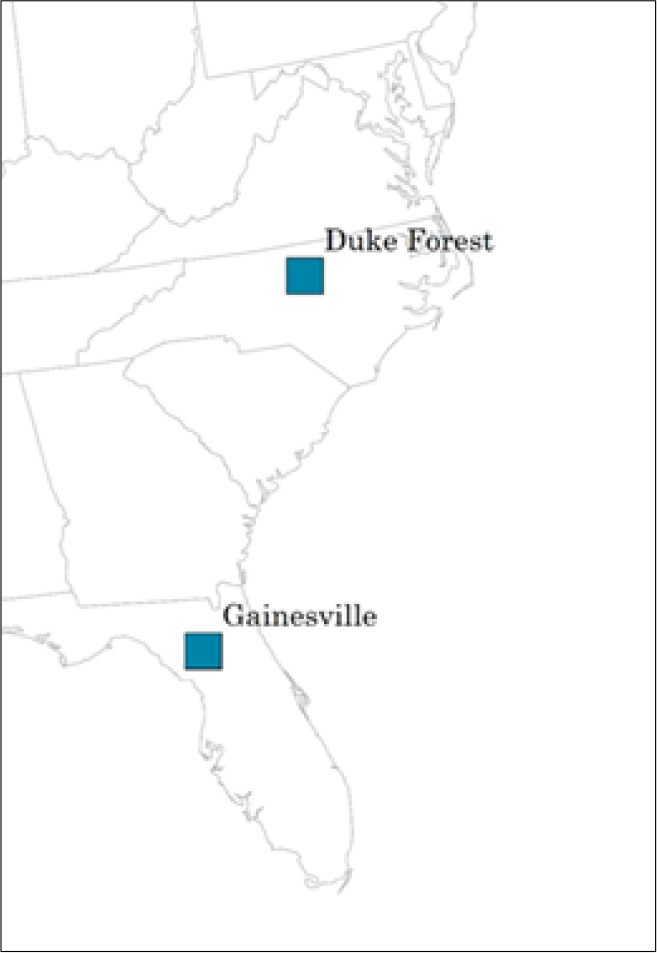
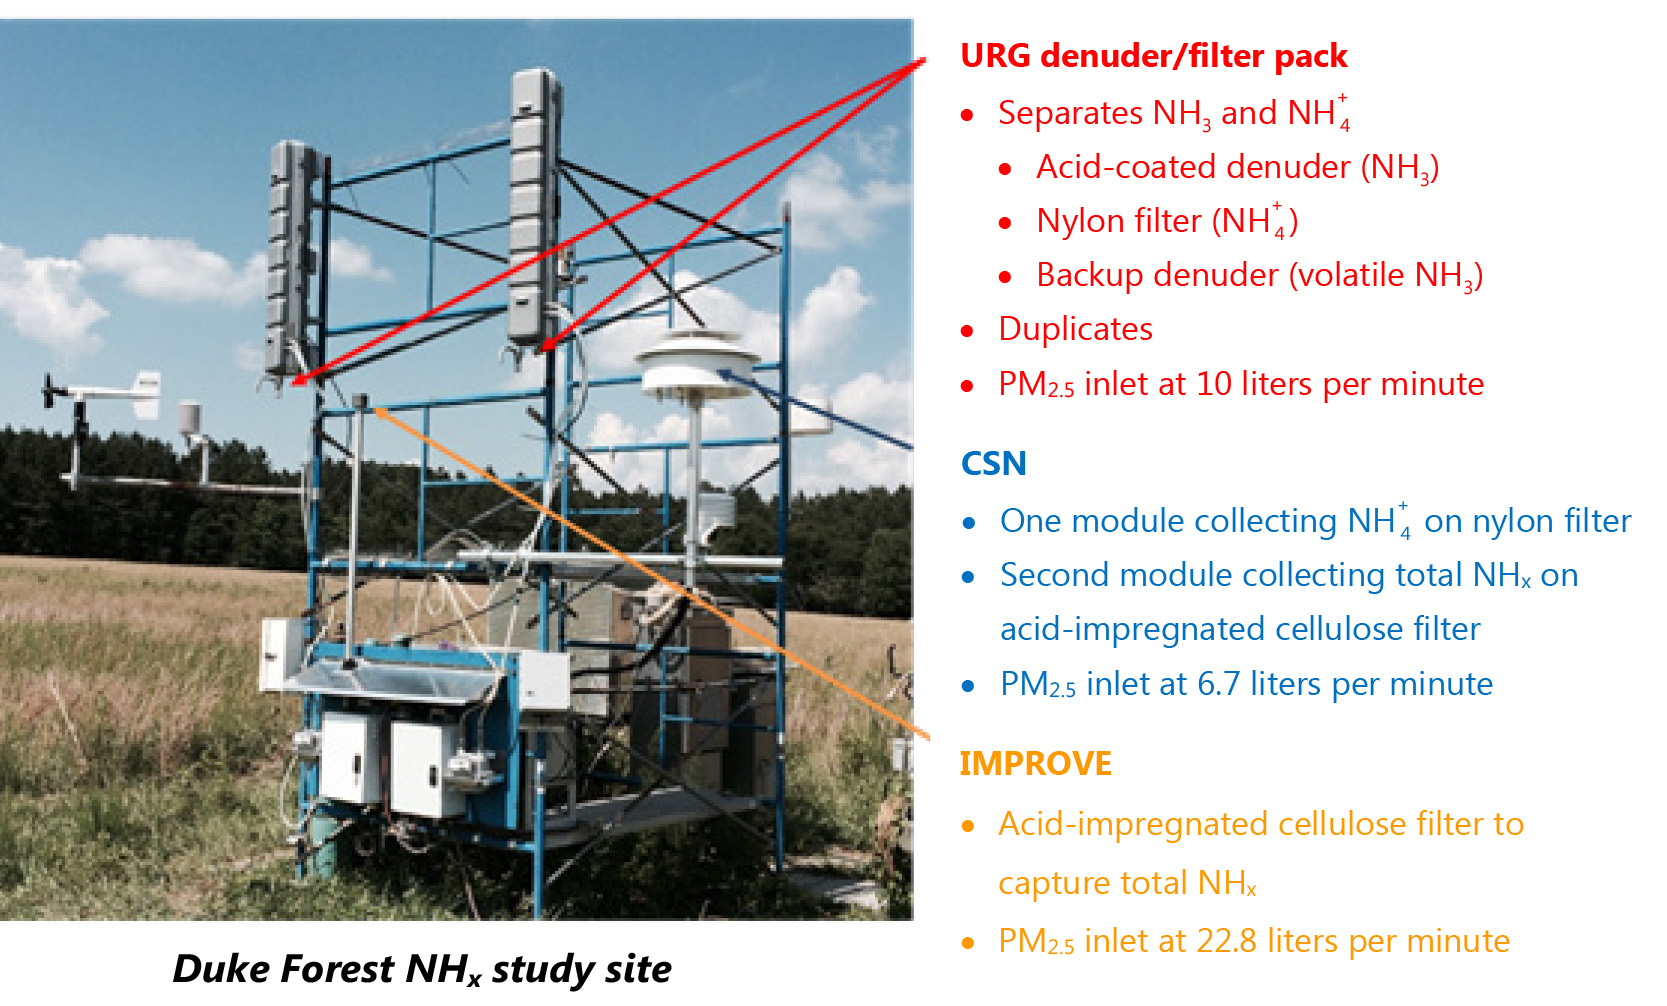
Acid-impregnated filters were deployed in both CSN and IMPROVE samplers in North Carolina (Duke Forest) and Florida (CASTNET shelter in Gainesville) during the summer of 2017 (Figure 15). In this study, a spare module [37 millimeter (mm) filter diameter for IMPROVE and 47 mm filter diameter for CSN] was fitted with a H3PO3-impregnated cellulose filter to collect and sustain (no volatile losses) both particulate NH4+ and NH3. A URG ADFPS was used as a reference method. The ADFPS included an NH3 denuder, followed by a nylon filter to collect particles, and a backup denuder to capture any NH3 volatilized from the nylon filter. The sum of NH3 from both denuders and NH4+ from the nylon filter constituted a reference NHx sample. Figure 16 shows the sampling equipment at Duke Forest.
Results
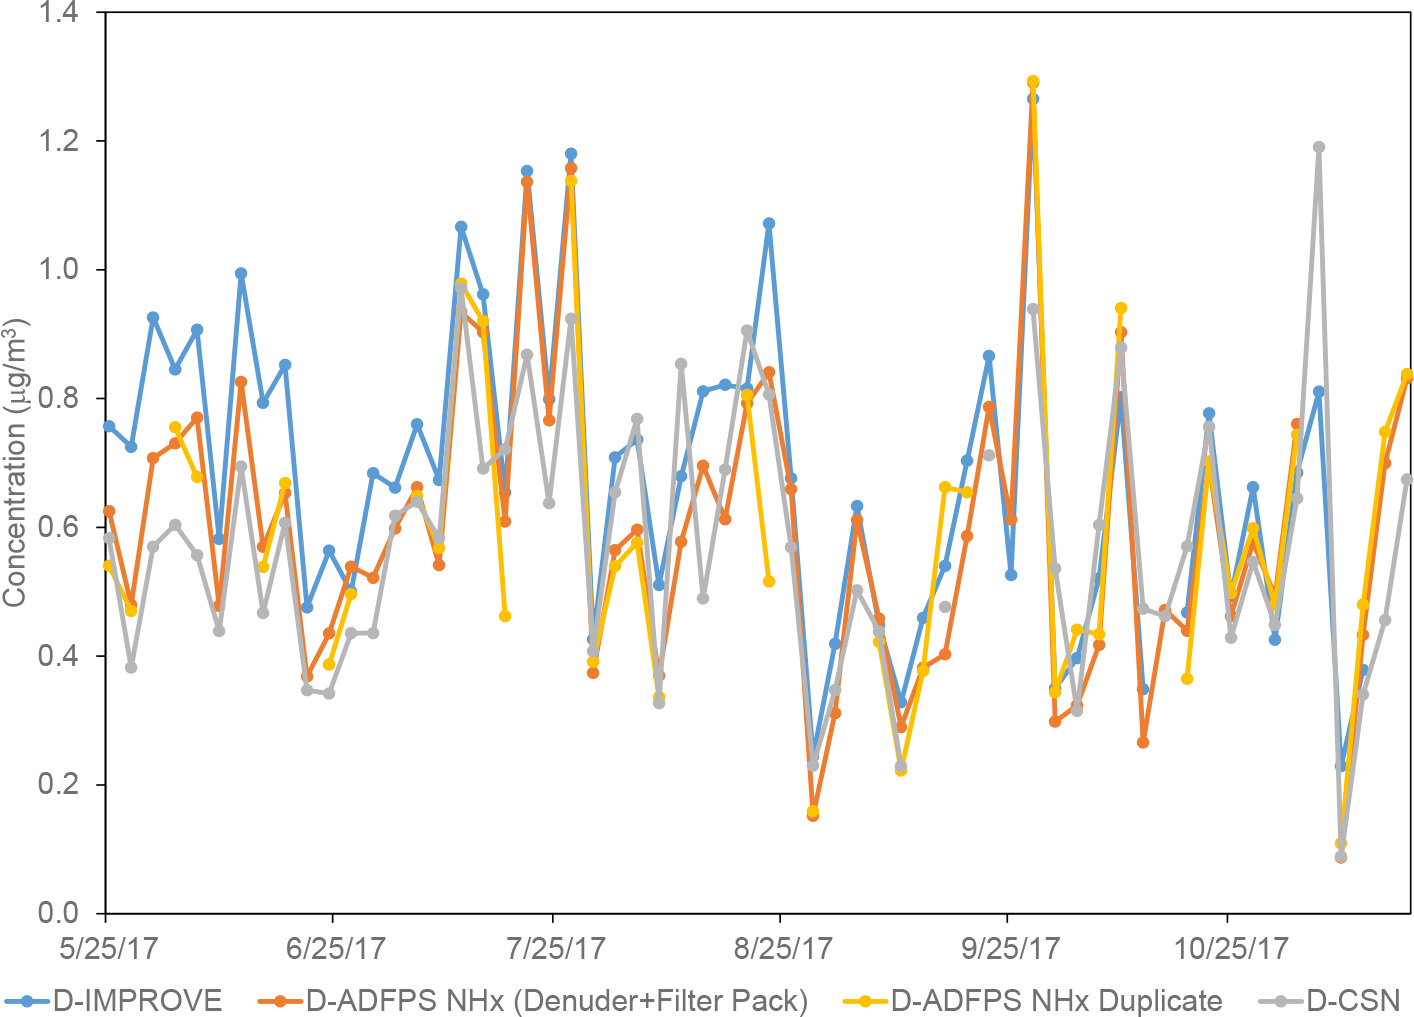
Ambient concentrations of NHx from the Duke Forest site from each of the sampling systems are shown in Figure 17. The ADFPS NHx value was reported as the nylon NH4+ concentration plus the NH3 collected on the primary denuder and the volatilized NH4+ collected on the backup acid-coated denuder.
Figure 17 Comparison of NHx Concentrations Measured by IMPROVE, CSN, and ADFPS Methods at Duke Forest, NC
 Download Figure
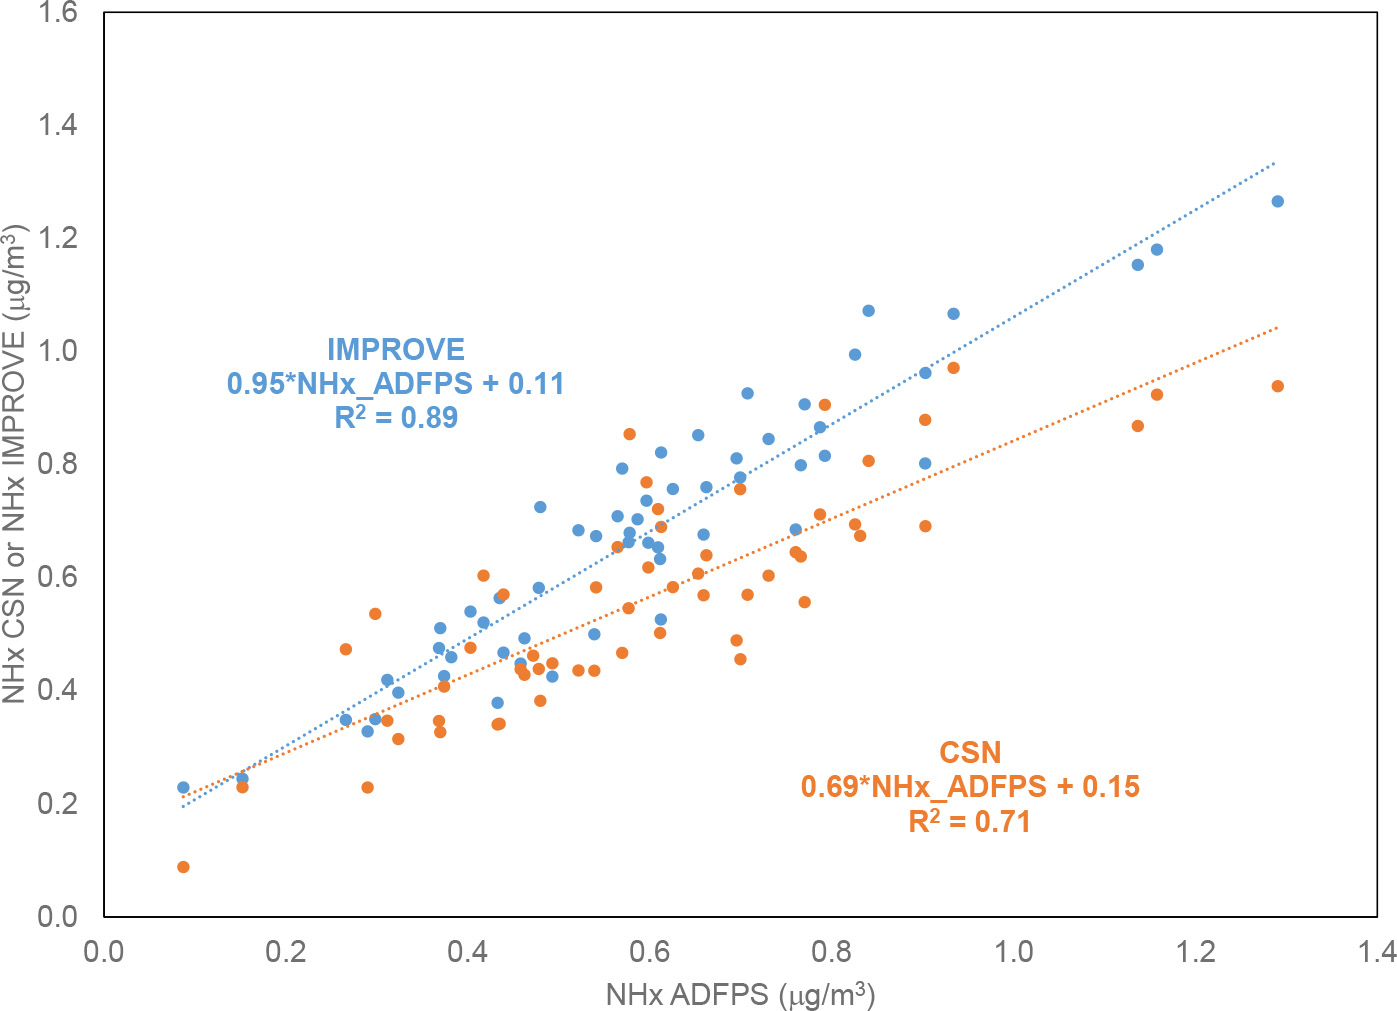
The linear relationships between the ADFPS and the CSN SuperSASS sampler and the IMPROVE sampler from Duke Forest are shown in Figure 18. There was good agreement between the ADFPS and IMPROVE systems with a slope of 0.95 and R2 equal to 0.89. These results were similar to results presented in the western United States in the NHx pilot network (Chen et al., 2014). Agreement between the ADFPS and the CSN system was fair with a slope of 0.69 and an R2 equal to 0.71. The CSN was biased low as compared to the ADFPS. There seemed to be less NHx retained on the acid-impregnated filter in the CSN system at higher concentrations.
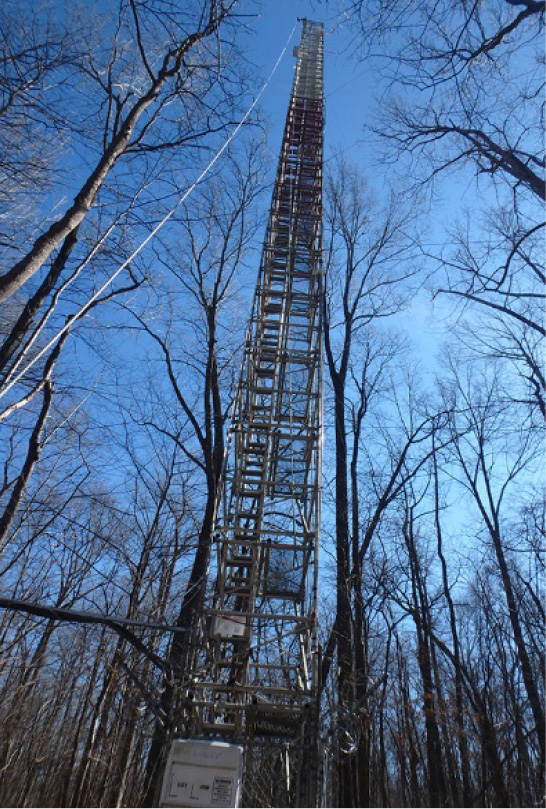
Figure 18 Linear Relationship between the ADFPS versus CSN NHx Results and ADFPS versus IMPROVE NHx Results at Duke Forest
 Download Figure
Equipment issues at the Gainesville site made it difficult to draw conclusions, but the available samples seemed to indicate that the high humidity interfered with the acid-impregnated filter’s ability to capture NH3.
Overall, the acid-impregnated filters performed well to capture NHx in the CSN/Super SASS and IMPROVE PM sampler, particularly at the Duke Forest site. The median NHx concentrations from the ADFPS, CSN, and IMPROVE from Duke Forest were reasonably close (0.59, 0.57, and 0.68 µg/m 3, respectively). The performance of the acid-impregnated filters at the Gainesville site was poor with the filters significantly underestimating the NHx concentrations. Additional testing may be performed to evaluate the filter capture efficiency in a controlled environment and to further evaluate the effects of meteorological conditions on the results.
Improving Total Nitrogen Deposition Budget
Total Reactive Nitrogen
Accurate and complete deposition budgets of nutrients and acidity are fundamental requirements for the development of critical loads and protection of human welfare. While much progress has been made in developing deposition budgets for the United States over the past several years, improvement in the completeness, accuracy, and spatial representativeness of total reactive nitrogen (Nr) deposition budgets remains limited by key data and knowledge gaps.
Total nitrogen deposition refers to the transfer of nitrogen pollutants from the atmosphere to the earth’s surface via wet and dry processes. Air pollutants containing nitrogen are emitted from a variety of sources. In general, those coming from vehicles, power plants, and other industries are oxidized (NOx), while those coming from agriculture, including animal production and crop fertilization, are reduced (NHx). The deposition of these pollutants in excess of critical loads (ecosystem thresholds) causes changes in terrestrial and aquatic biodiversity, soil and lake acidification and eutrophication, drinking water contamination, and reduces the resilience of ecosystems to climate variability and other stressors.
The deposition of Nr is monitored by several different networks, including NADP/NTN, which measures NO3- and NH4+ in wet deposition; AMoN, which measures ambient NH3; and standard CASTNET measurements. The NADP Total Deposition (TDep) Science Committee uses these measurements, along with regional model simulations, to estimate total Nr deposition. (See the subsequent section, “Atmospheric Deposition,” for TDep deposition estimates.) These estimates are then compared to critical loads to inform resource management and policy decisions and track trends, determine spatial patterns, assess ecosystem health, and determine sources of air pollution.
Total Nr deposition:
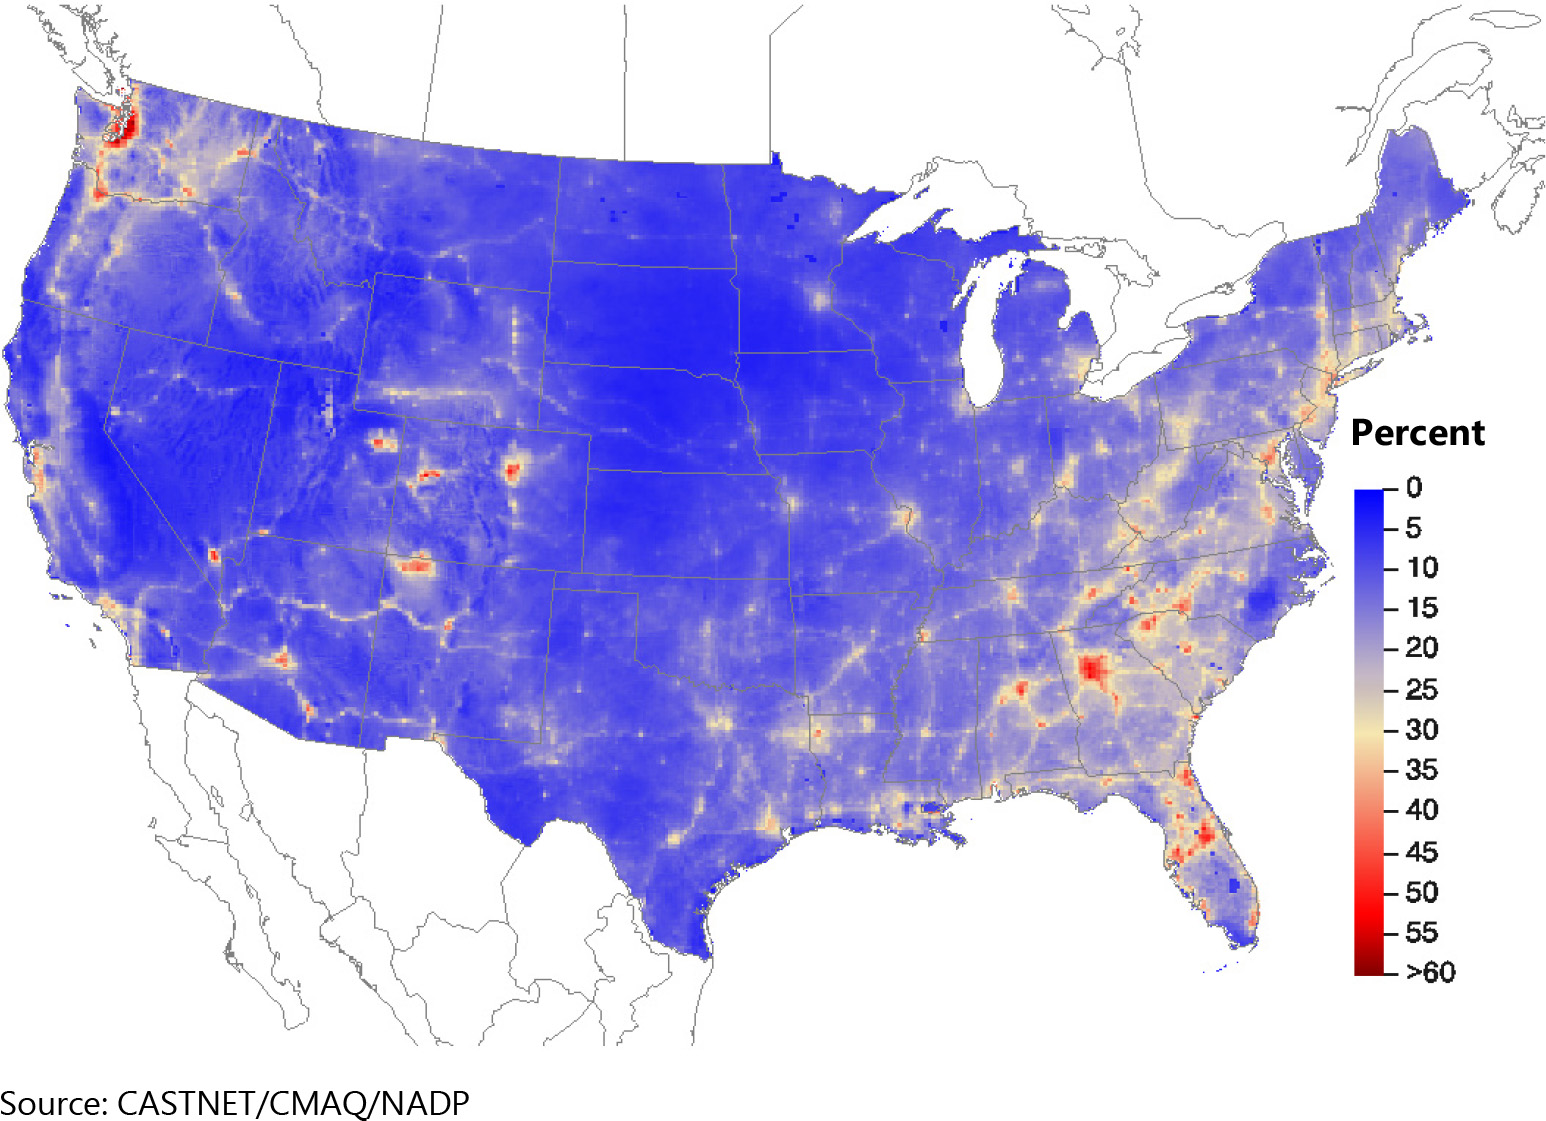
55% is dry across the United States (Figure 26)
90% is dry over broad areas of the Southwest and other arid regions (Figure 26)
50% is reduced N (NHx; Figure 28)
The mission of the NADP’s TDep Science Committee is to improve estimates of atmospheric deposition by advancing the science of measuring and modeling atmospheric wet, dry, and total deposition of species, such as sulfur, nitrogen, and mercury, by providing a forum for the exchange of information on current and emerging issues within a broad multi-organization context including atmospheric scientists, ecosystem scientists, resource managers, and policy makers. CASTNET is critical for providing measurement data to support the continuing development of TDep maps and to support the ongoing research to reduce uncertainties in estimates of atmospheric deposition
Addressing Key Knowledge Gaps and Research Needs
The white paper, “Science Needs for Continued Development of Total Nitrogen Deposition Budgets in the United States,” summarized the work of the TDEP Science Committee and identified knowledge gaps in atmospheric nitrogen deposition. The white paper resulted in nine peer-reviewed journal articles and four magazine articles..
Key knowledge gaps in Nr deposition are of interest to a broad group of stakeholders, including many federal (EPA, USGS, NPS, USFS, FWS, BLM, NOAA, NSF, and NASA), tribal, and state agencies; academia; industry; and non-profit groups. These stakeholders share a wide variety of interconnected scientific and policy interests and have prioritized the three following research needs:
- Better characterization of patterns and trends in Nr deposition: a complete Nr budget with good geographical coverage and over long time periods is important so that critical loads can be accurately assessed and changes in atmospheric chemistry can be identified, such as the shift from a predominance of oxidized forms of Nr (NOy) to reduced forms (NH3 + NH4+ ). This can be accomplished by filling in key geographical gaps with satellite air pollutant measurements, additional monitoring sites (e.g., NTN and CASTNET in urban areas and AMoN in agricultural regions), expanding the capability to measure dry deposition, and measuring additional compounds not currently captured in the national networks that contribute significantly to total Nr deposition. Adaptation of NTN methods to include bulk water soluble organic Nr (ON) in wet deposition would be an important step as well as expanding nitrogen dioxide measurements, which are currently mostly located in urban areas.
- Quantification and reduction of uncertainty in deposition estimates used for critical loads applications: deposition estimates are made with measurements, models, or a combination of both. Lack of dry deposition measurements imposes a reliance on models, resulting in a much higher degree of uncertainty relative to wet deposition that is routinely measured. The uncertainty inherent in using complex models to estimate total deposition could be quantified by a comprehensive comparison of the deposition processes within them. Developing more modular codes and software architectures that allow for easier implementation and comparison of different parameterizations is needed. Such efforts could draw on modeling expertise within EPA, NPS, Environment and Climate Change Canada, and NOAA. The incorporation of NOAA and NASA satellite data within the hybrid TDep methodology could also help reduce uncertainty. However, the satellite data have to be coupled with modeled deposition velocity data to estimate deposition.
- Improvement of the understanding of the linkages between agricultural emissions and Nr deposition: with the shift in atmospheric chemistry from oxidized to more reduced forms of Nr, agriculture has become a more important source of N emissions. Better estimates of NH3 emissions from agricultural sources (animal production and crop fertilization) are needed for source apportionment and modeling of air quality, visibility, and Nr deposition. It is also important to understand the contribution of NH3 to atmospheric PM and the indirect effects of agriculture on land use change (i.e., biodiversity impacts of NHx deposition).
Sulfur Atmospheric Concentrations
Annual mean concentrations of SO2 and SO42- for 2019 are presented in this section. Trends in annual mean concentrations are also shown.
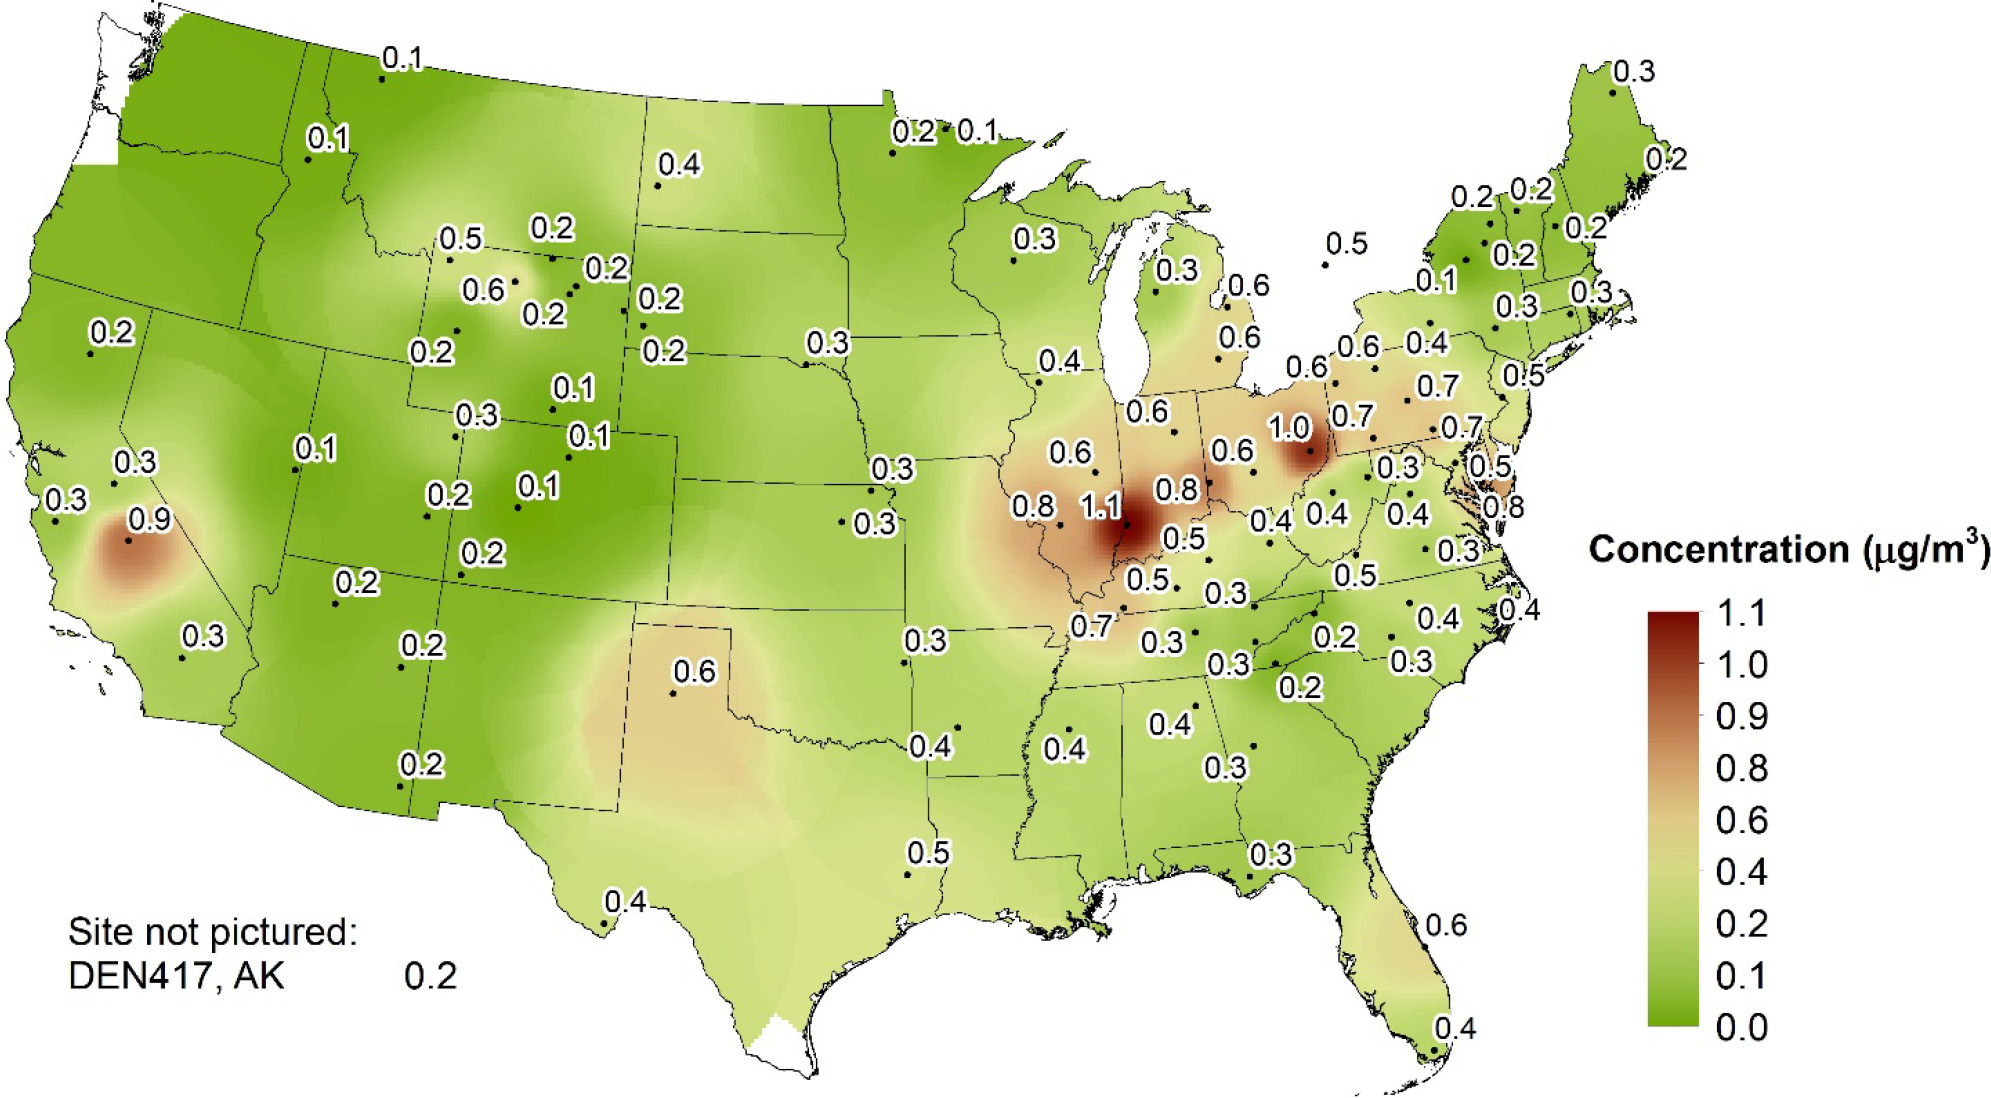
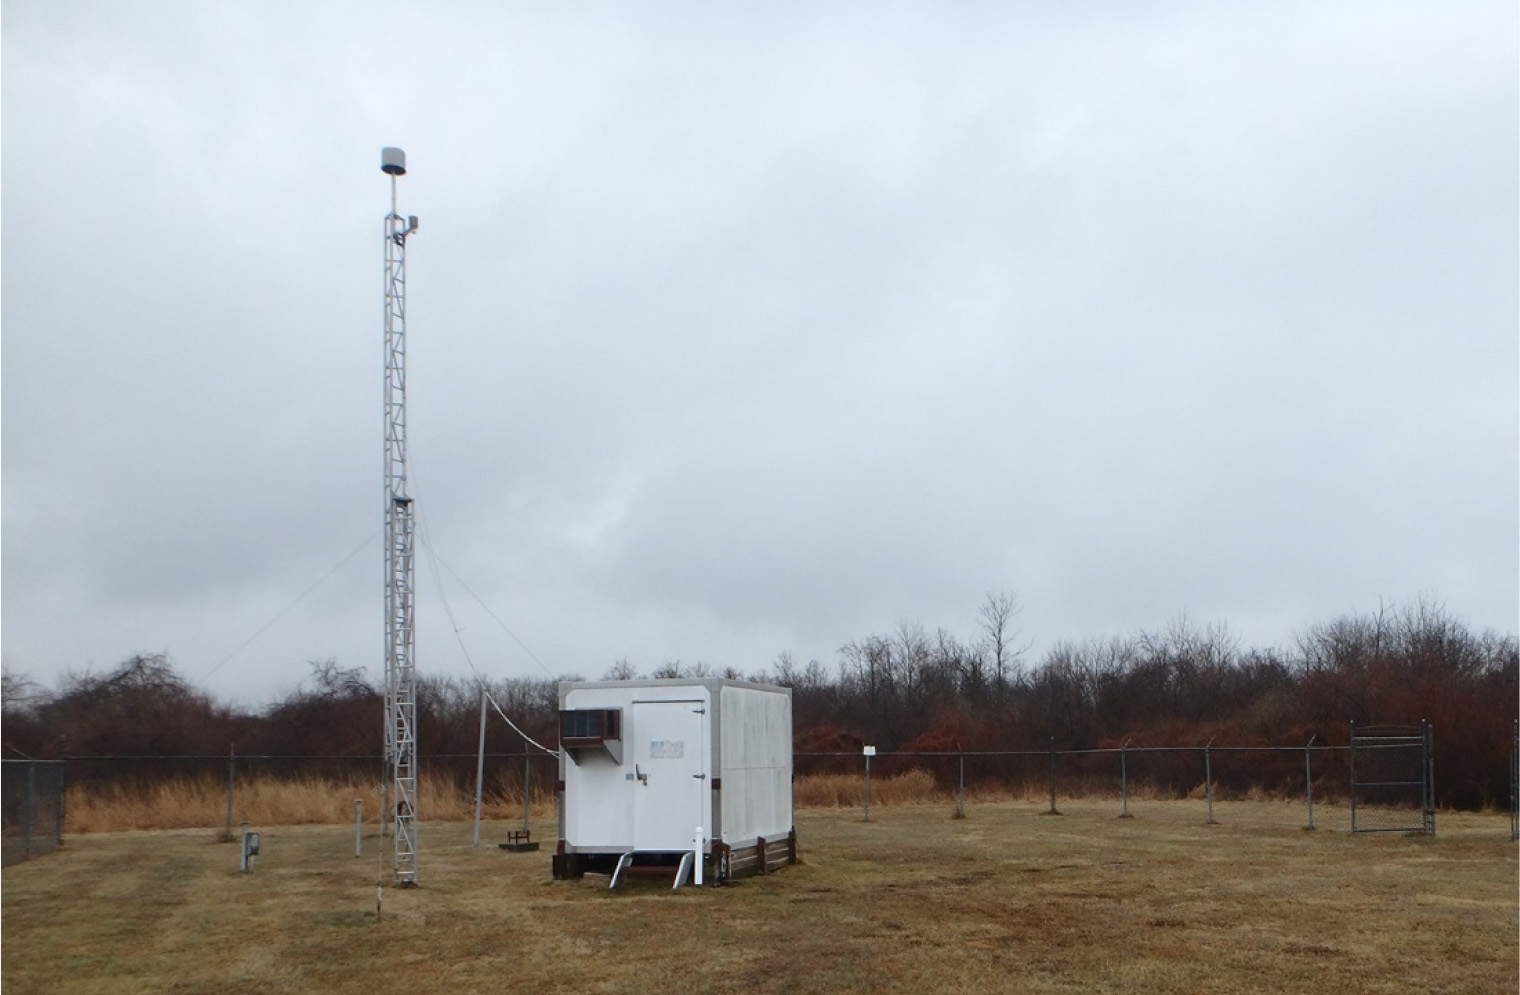
Figure 20 Trends in Annual Mean SO2 Concentrations
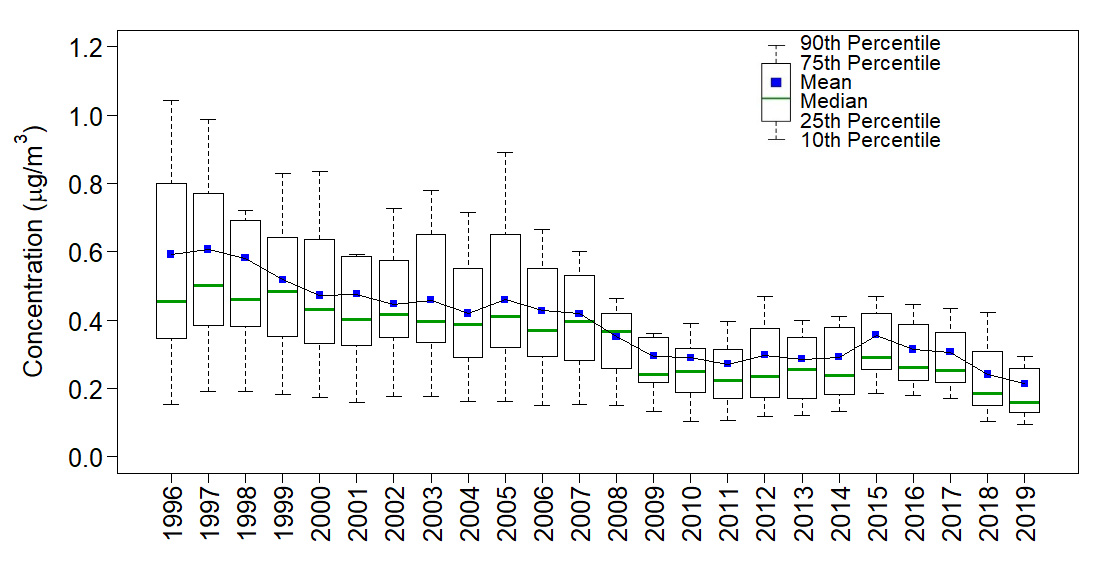
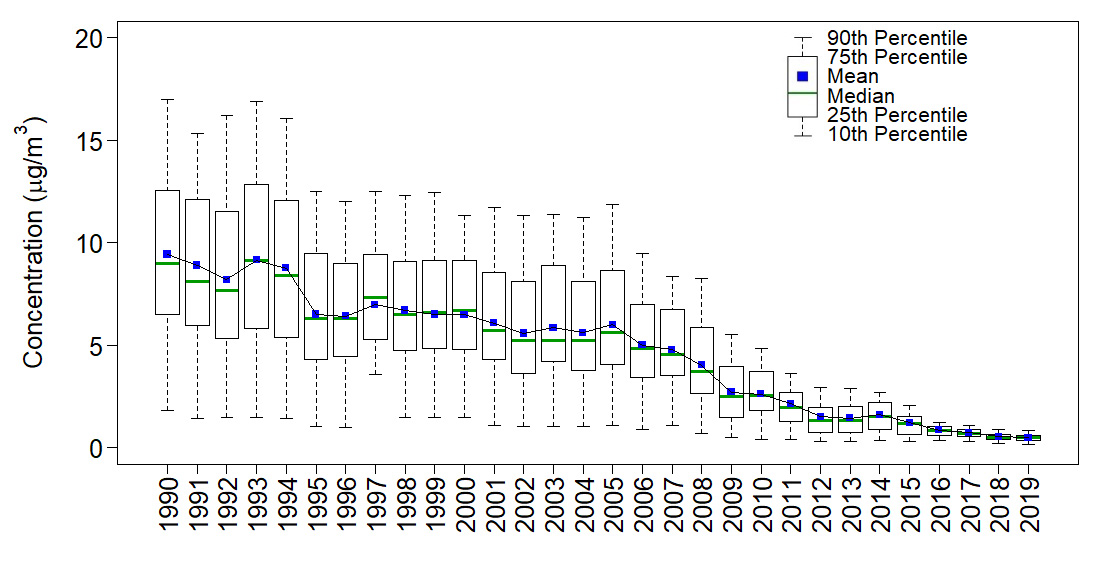
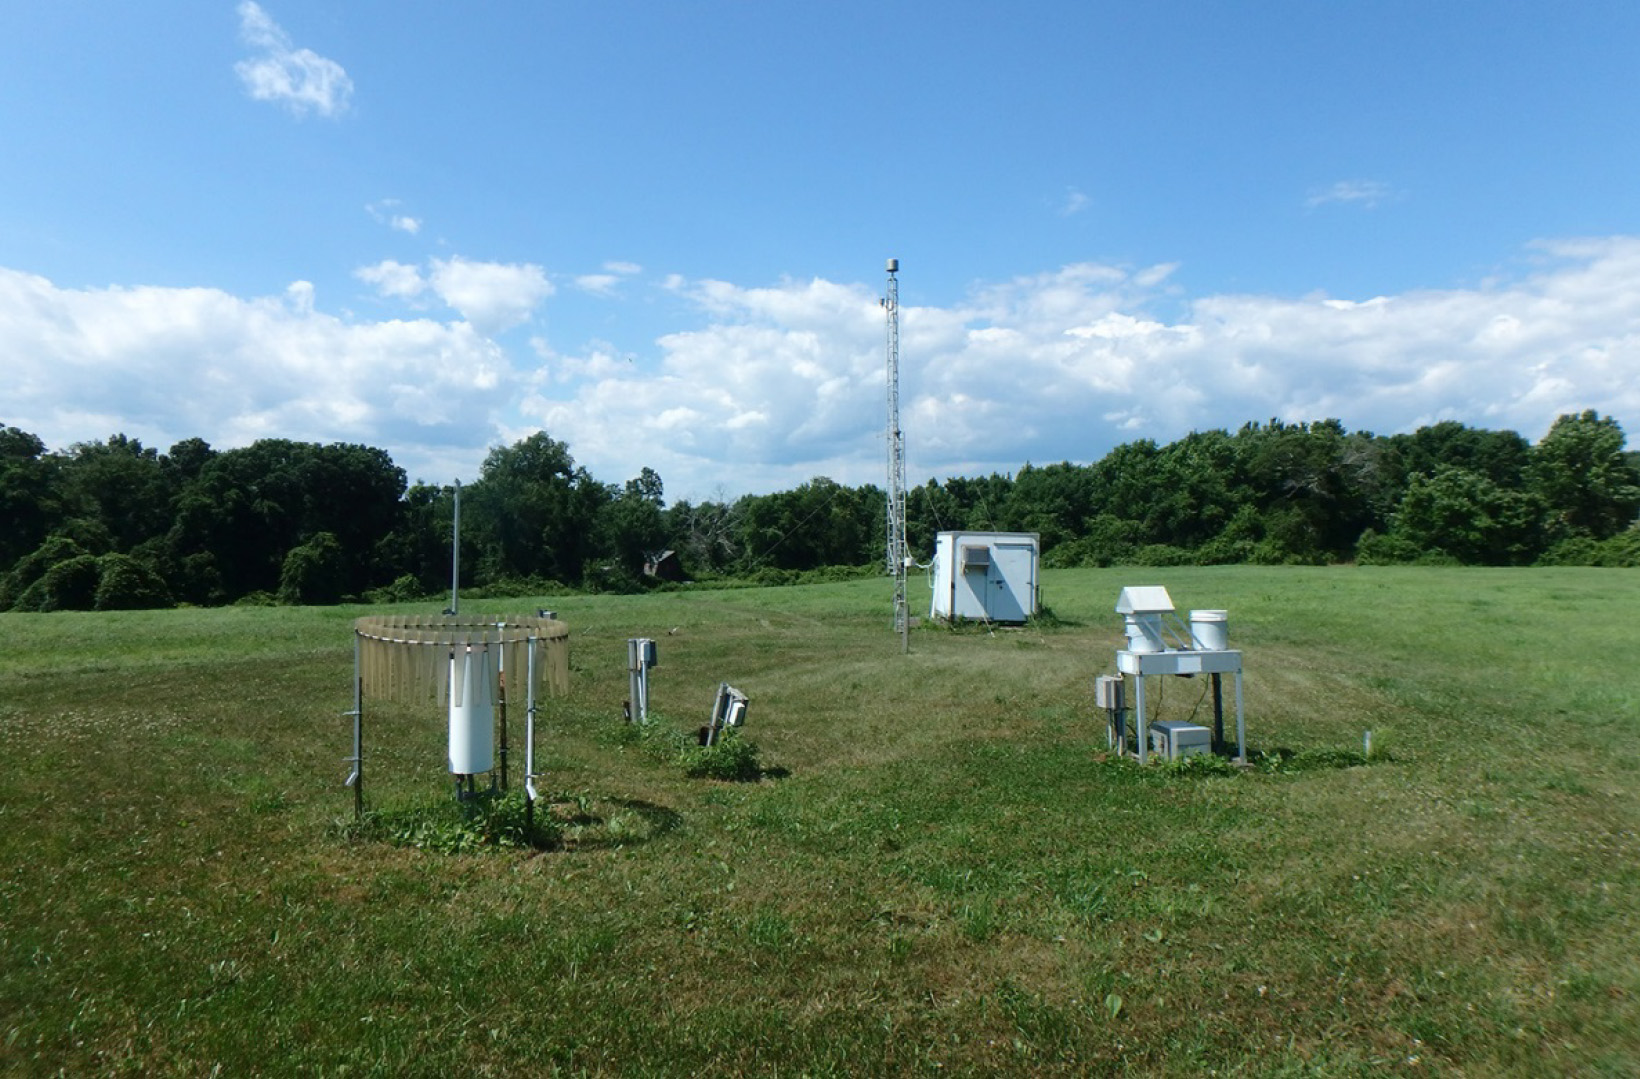
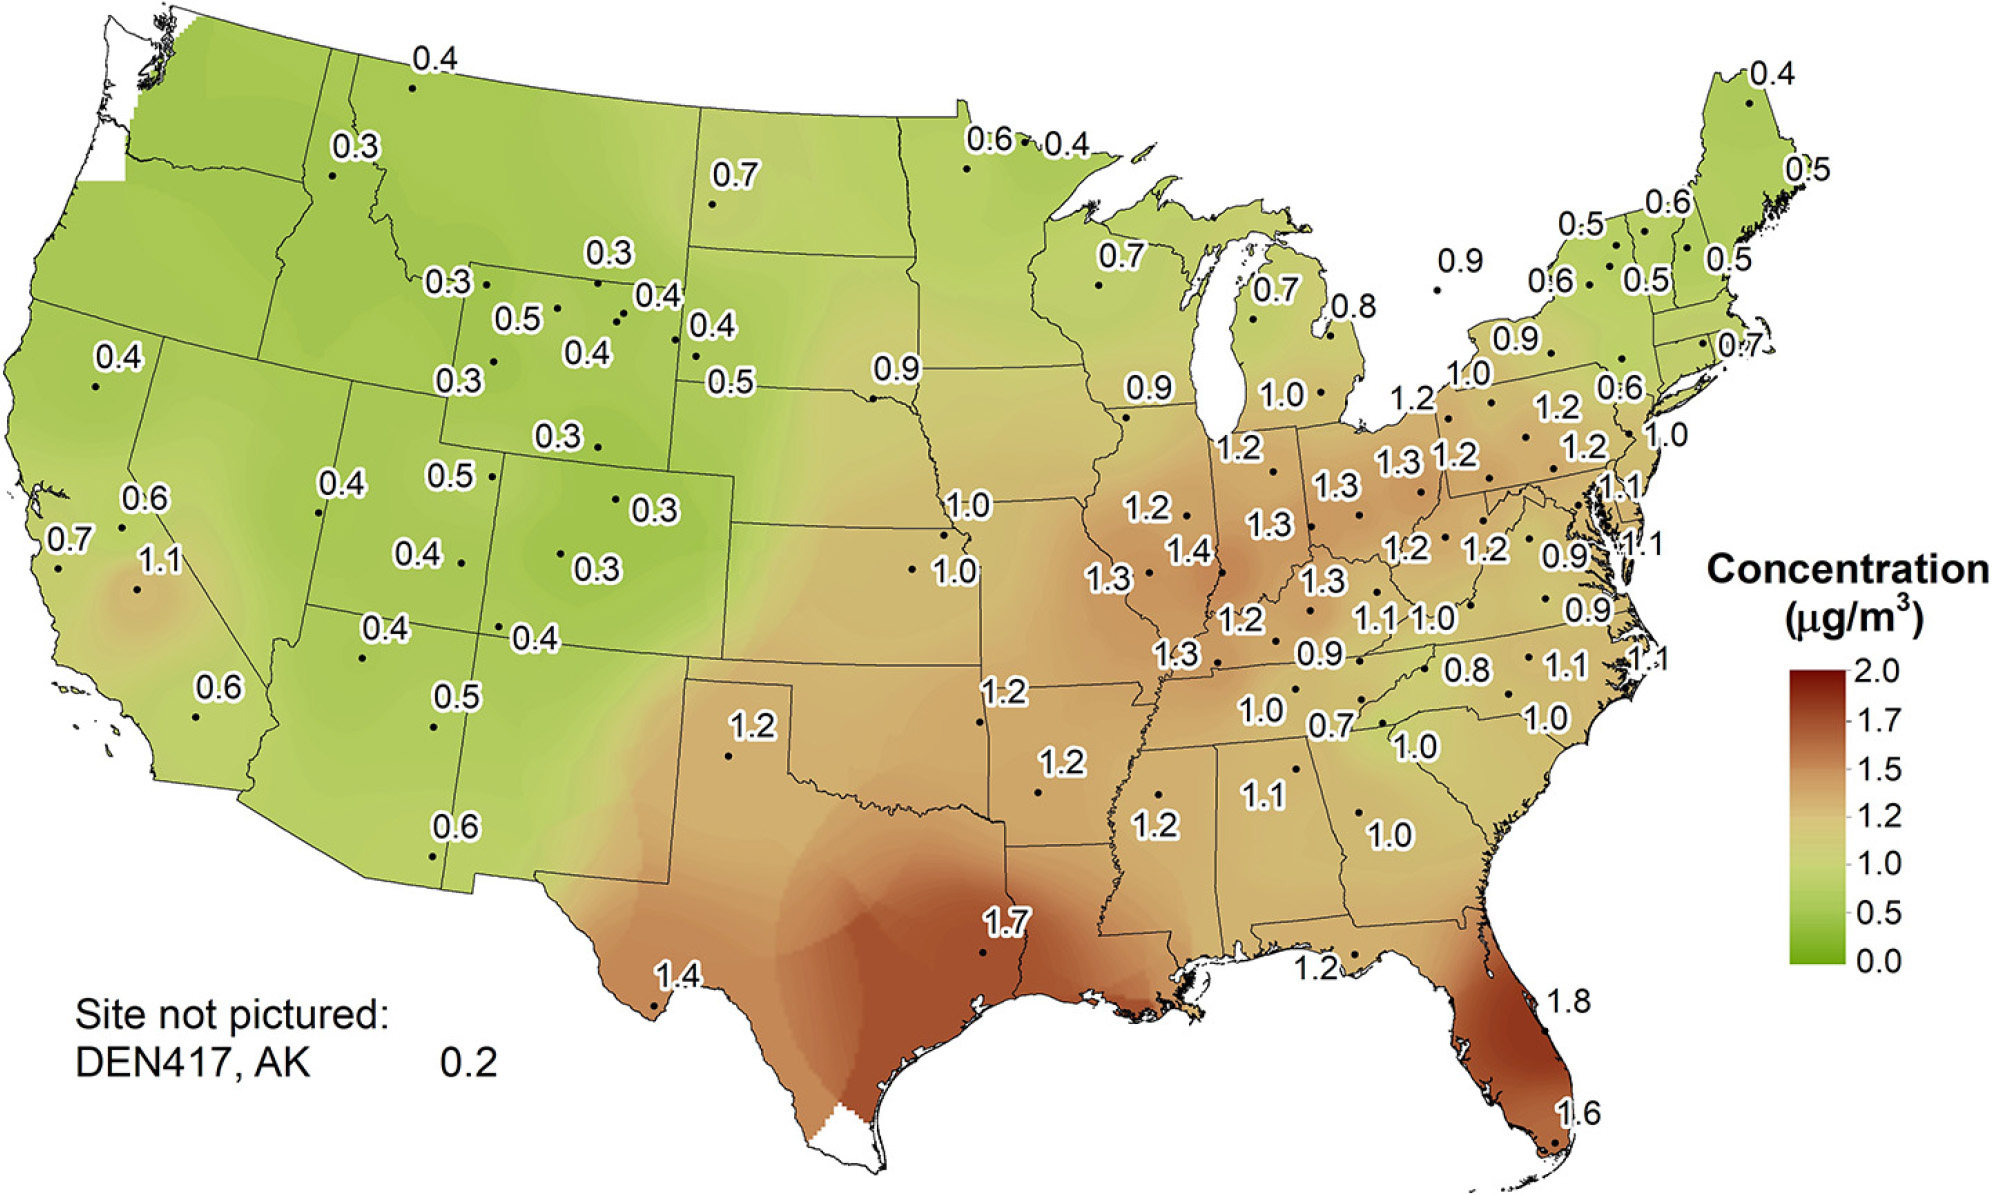
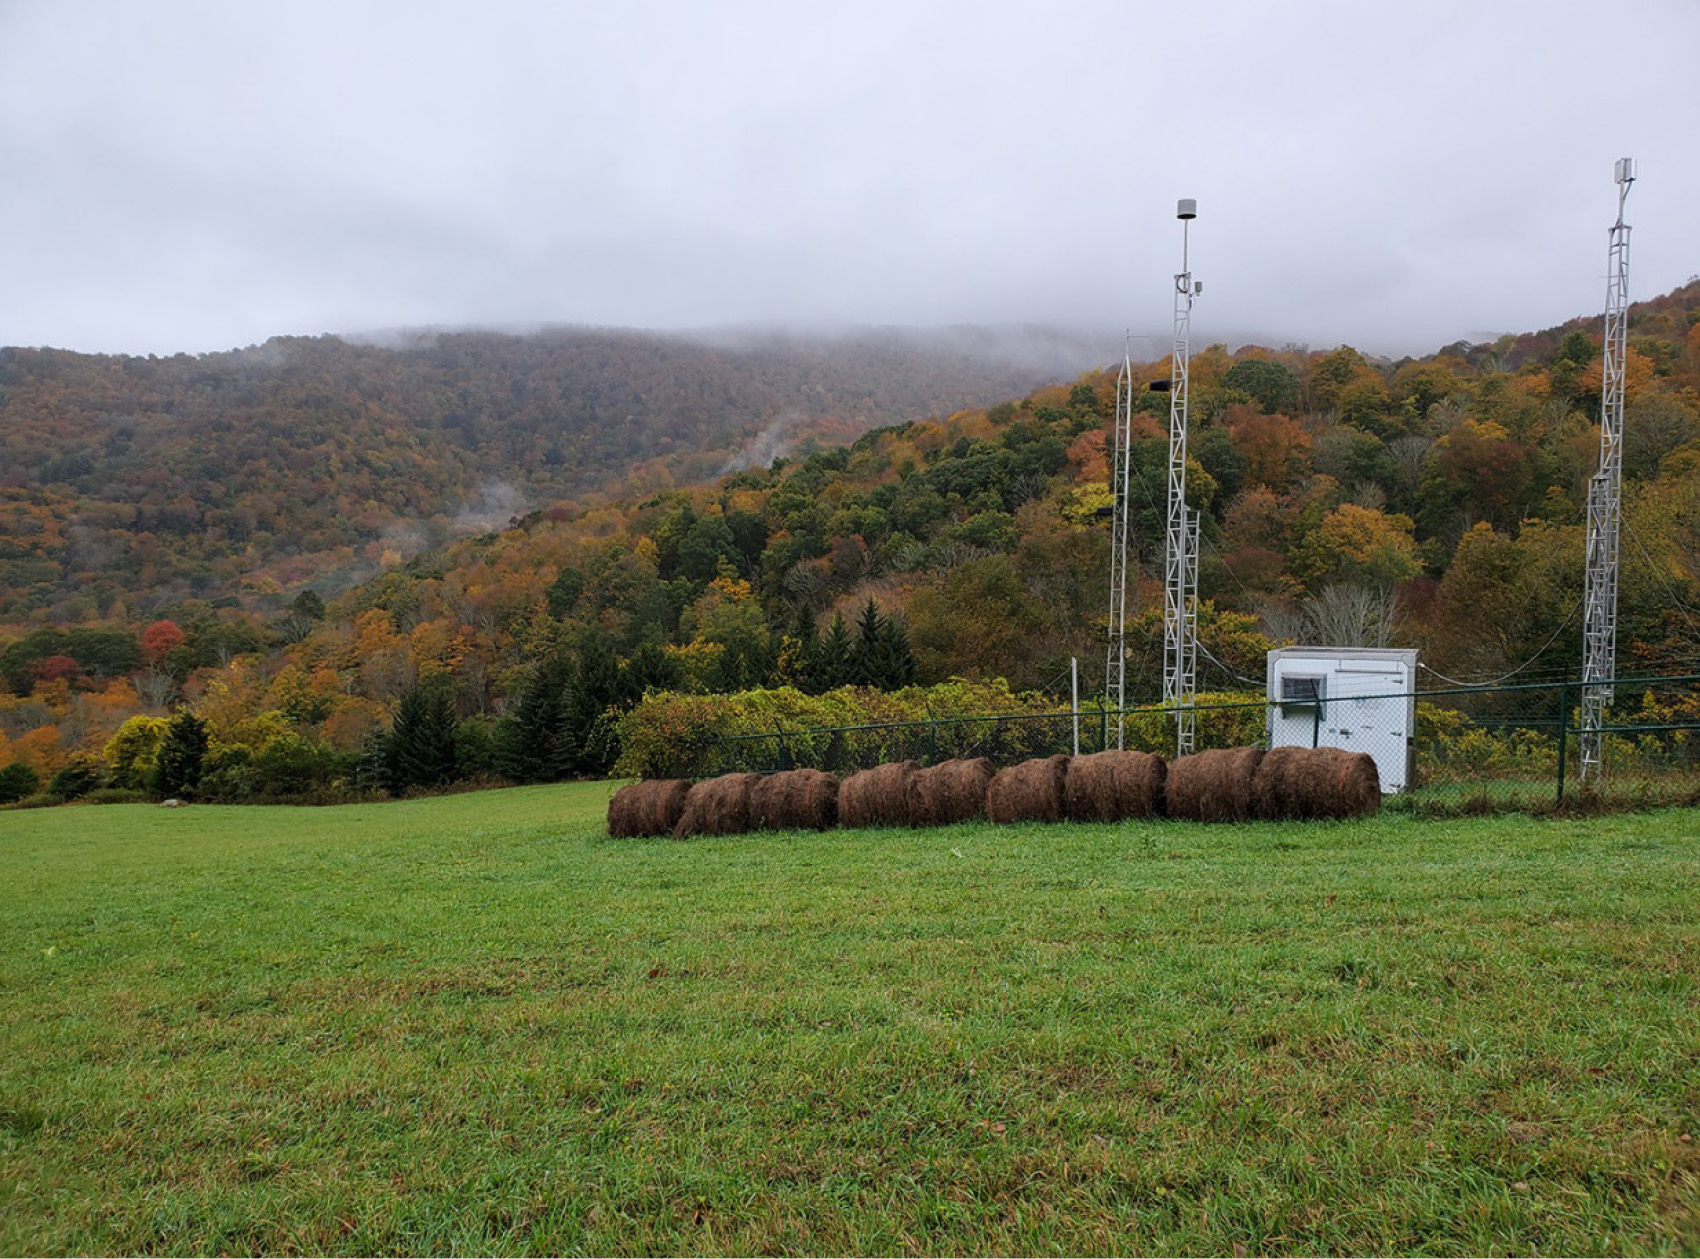
Figure 22 Trends in Annual Mean SO42- Concentrations
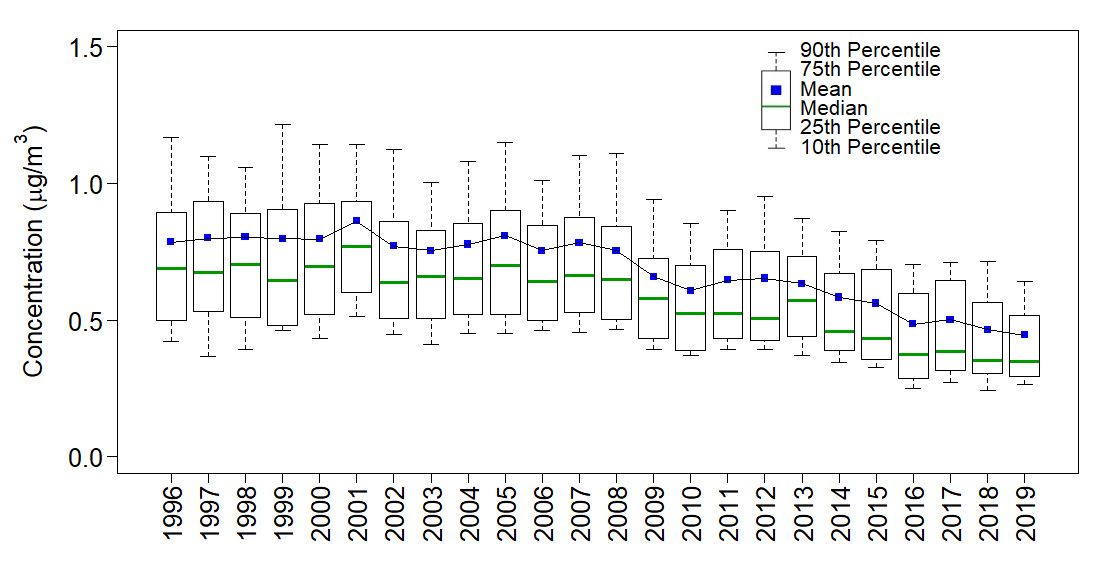
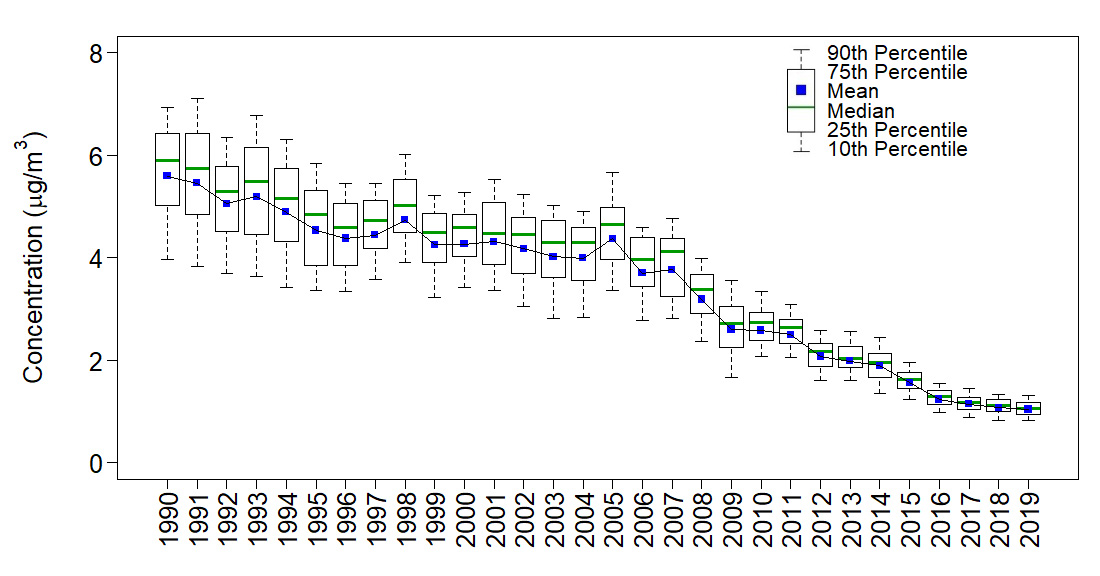
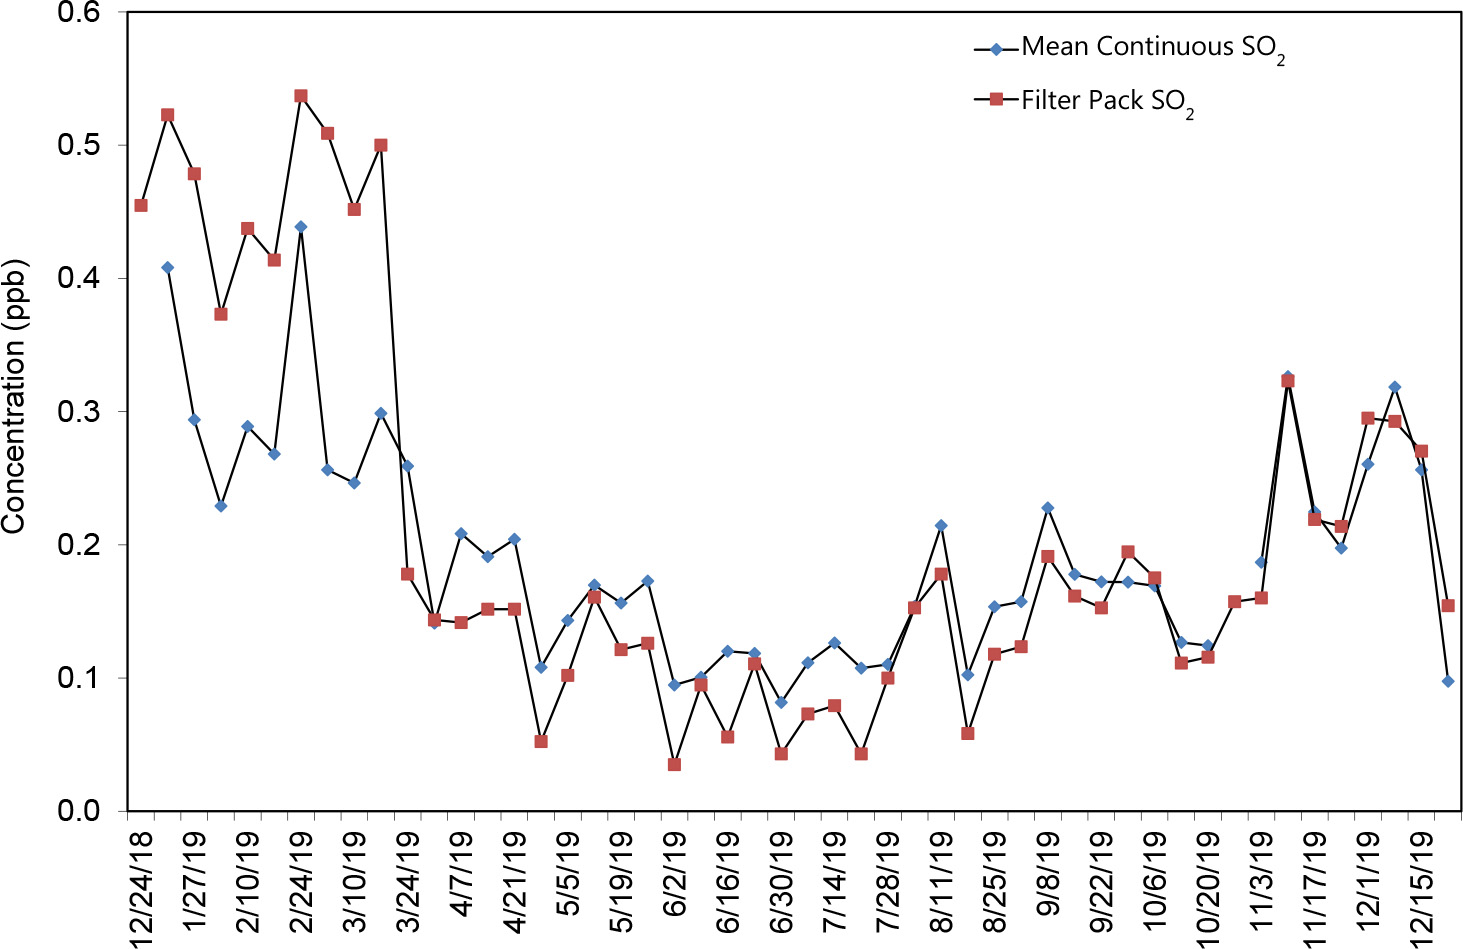
Figure 23 provides a diagram that compares weekly filter pack SO2 concentrations with continuous trace level gas data measured at Mammoth Cave National Park, KY (MAC426). The continuous analyzer provides a gross check of the filter pack measurements despite its occasional uncorrected baseline drift. The continuous analyzer data can also be used to produce diurnal profiles of hourly SO2 concentrations and detect the presence of SO2 plumes.
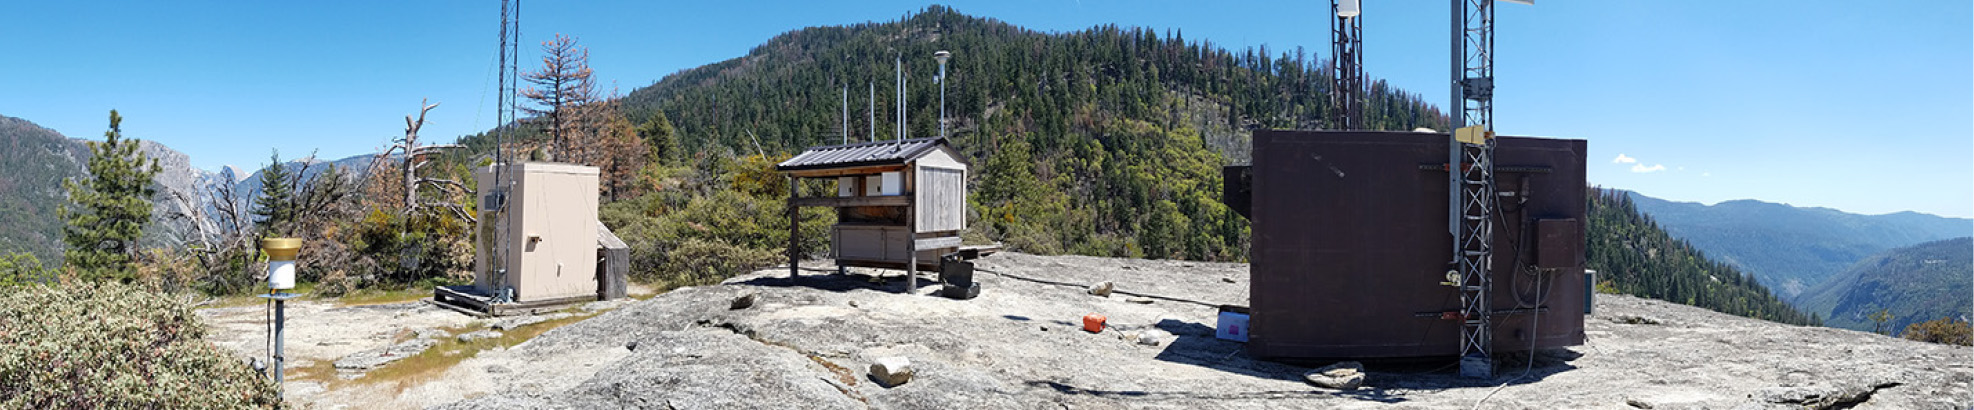
Figure 23 Comparison of MAC426 Weekly Mean Continuous and Filter Pack SO2 Concentrations
 Download Figure
Atmospheric Deposition
Gaseous and particulate nitrogen, sulfur, and other trace pollutants are deposited to the environment through dry and wet atmospheric processes. A primary goal of CASTNET is to estimate the dry deposition of pollutants from the atmosphere to sensitive ecosystems. The NADP TDep measurement-model fusion technique (Schwede and Lear, 2014) combines CASTNET monitoring data with output from the CMAQ modeling system (Byun and Schere, 2006) to estimate dry deposition. The TDep method uses measurement data from air quality monitoring sites when available and CMAQ output in areas where monitoring data are not available. CMAQ also provides modeled data for species that are not routinely measured. TDep and its recent updates are discussed on the TDep web page. See also the NADP Fact Sheet, “Hybrid Approach to Mapping Total Deposition.”
For wet deposition, the TDep method combines precipitation amounts measured at NADP/NTN sites with a Parameter-elevation Regressions on Independent Slopes Model (PRISM) surface of precipitation data to develop a continuous grid of precipitation data. PRISM uses terrain elevation, slope, and aspect and climatic measurements to estimate precipitation amounts. Pollutant concentrations in precipitation are measured by NADP/NTN, extrapolated into a grid using an inverse distance weighting algorithm, and then multiplied by the combined precipitation grid to generate estimates of wet deposition. For 2019, dry and wet deposition rates were added to obtain estimates of total deposition of nitrogen, sulfur, base cations, and Cl - , which are presented on the maps in this chapter as kilograms per hectare per year (kg ha -1 yr -1 ).
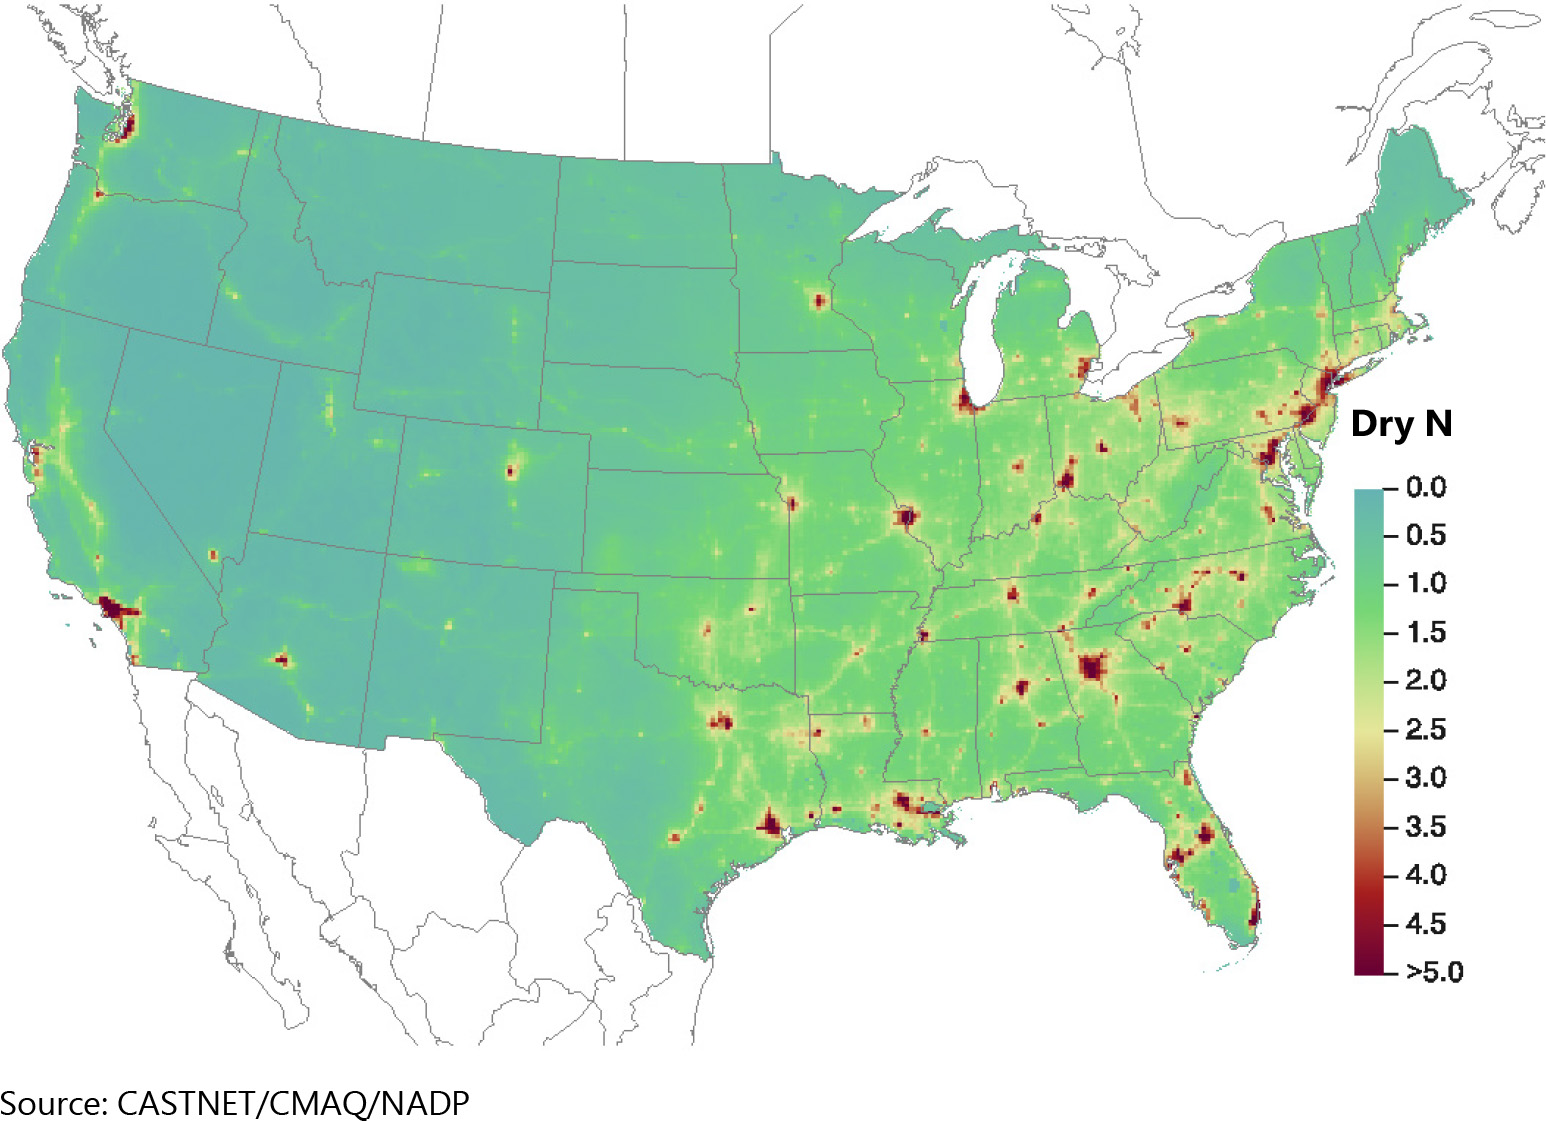
Nitrogen Deposition
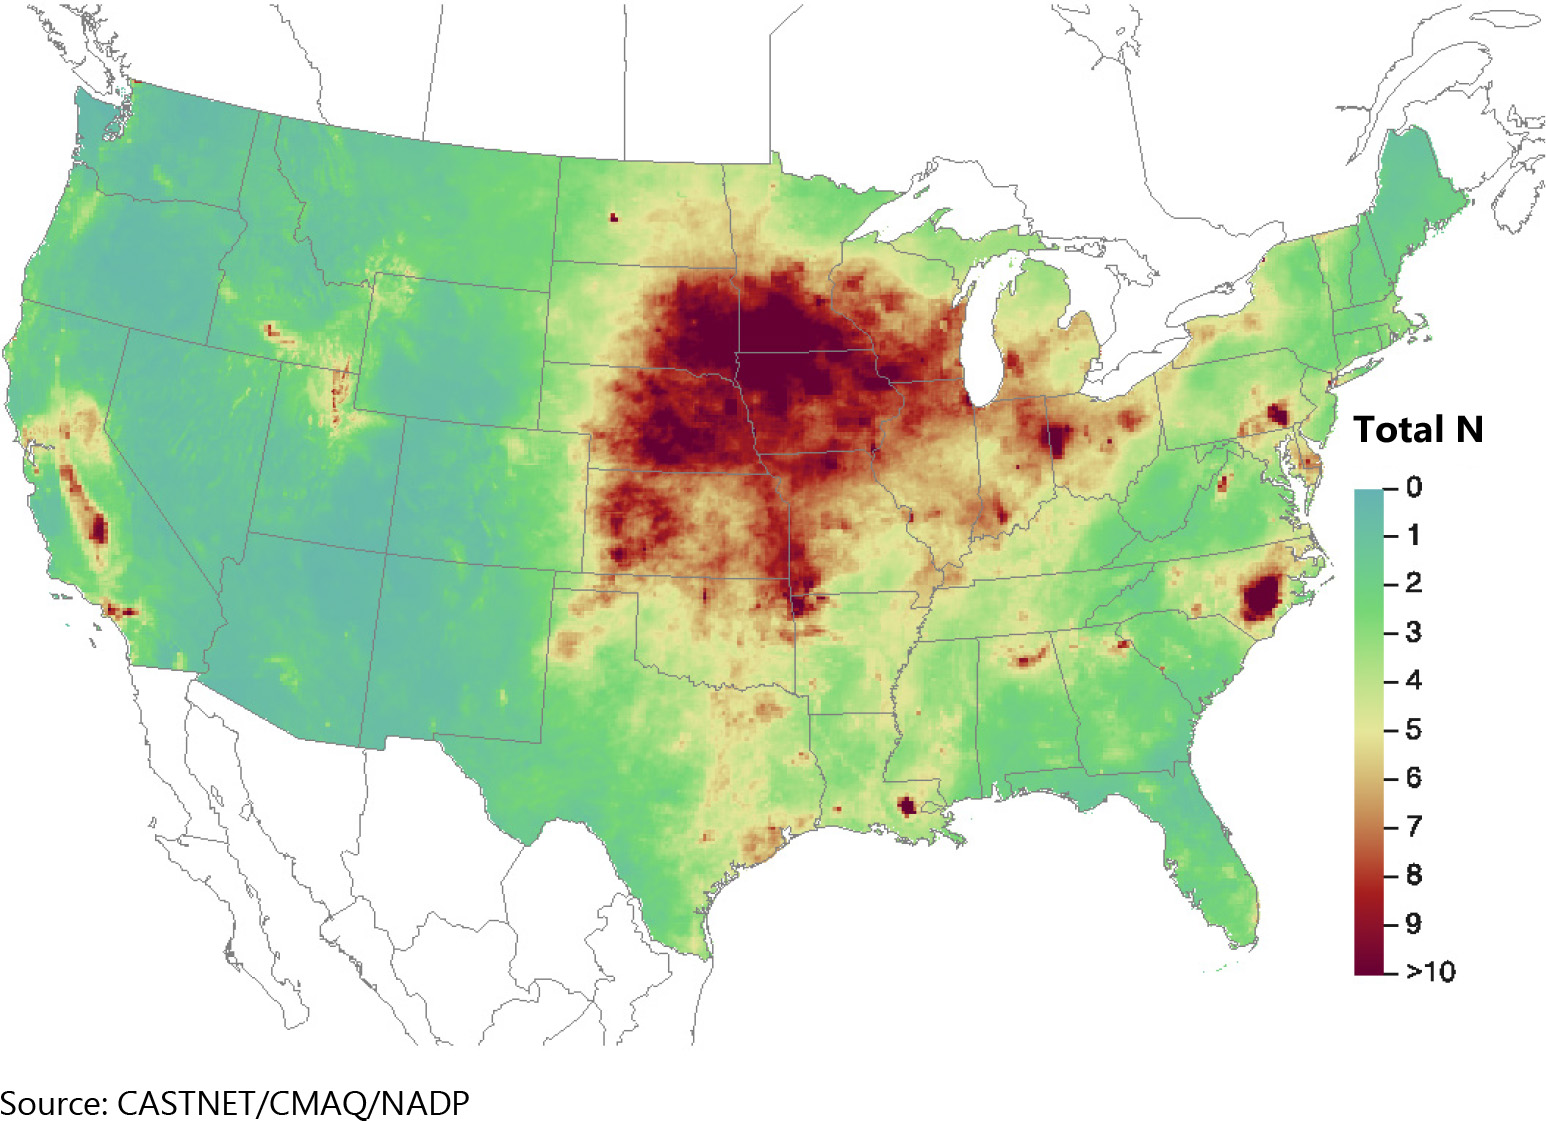
A map of the dry deposition fluxes of nitrogen (N) estimated for 2019 by the TDep method is shown in Figure 24. The magnitude of the deposition fluxes is illustrated by the shading in the figure legend. A map of total deposition of N estimated for 2019 is given in Figure 25. The percentage of total deposition of N due to dry deposition is shown in Figure 26. A map of TDep estimates of total deposition of reduced N species for 2019 is given in Figure 27. Figure 28 gives the percentage of total deposition of reduced N. Dry deposition of N species that are not routinely measured but are modeled by CMAQ and used by TDep is shown in the map in Figure 29, and its percentage of total deposition is shown in Figure 30. Estimates of annual gross dry deposition of NH3 as N for 2019 is shown in Figure 31, and the net dry deposition of NH3 as N is shown in Figure 32. The net dry deposition figure shows the direction of the flux (i.e., positive values for deposition and negative values for emissions).
Sulfur Deposition
Figure 33 shows a map of TDep estimates of total deposition rates of sulfur (S) for 2019. The magnitude of the deposition fluxes is illustrated by the shading in the figure legends. The percentage of total deposition of S due to dry deposition is shown in Figure 34.
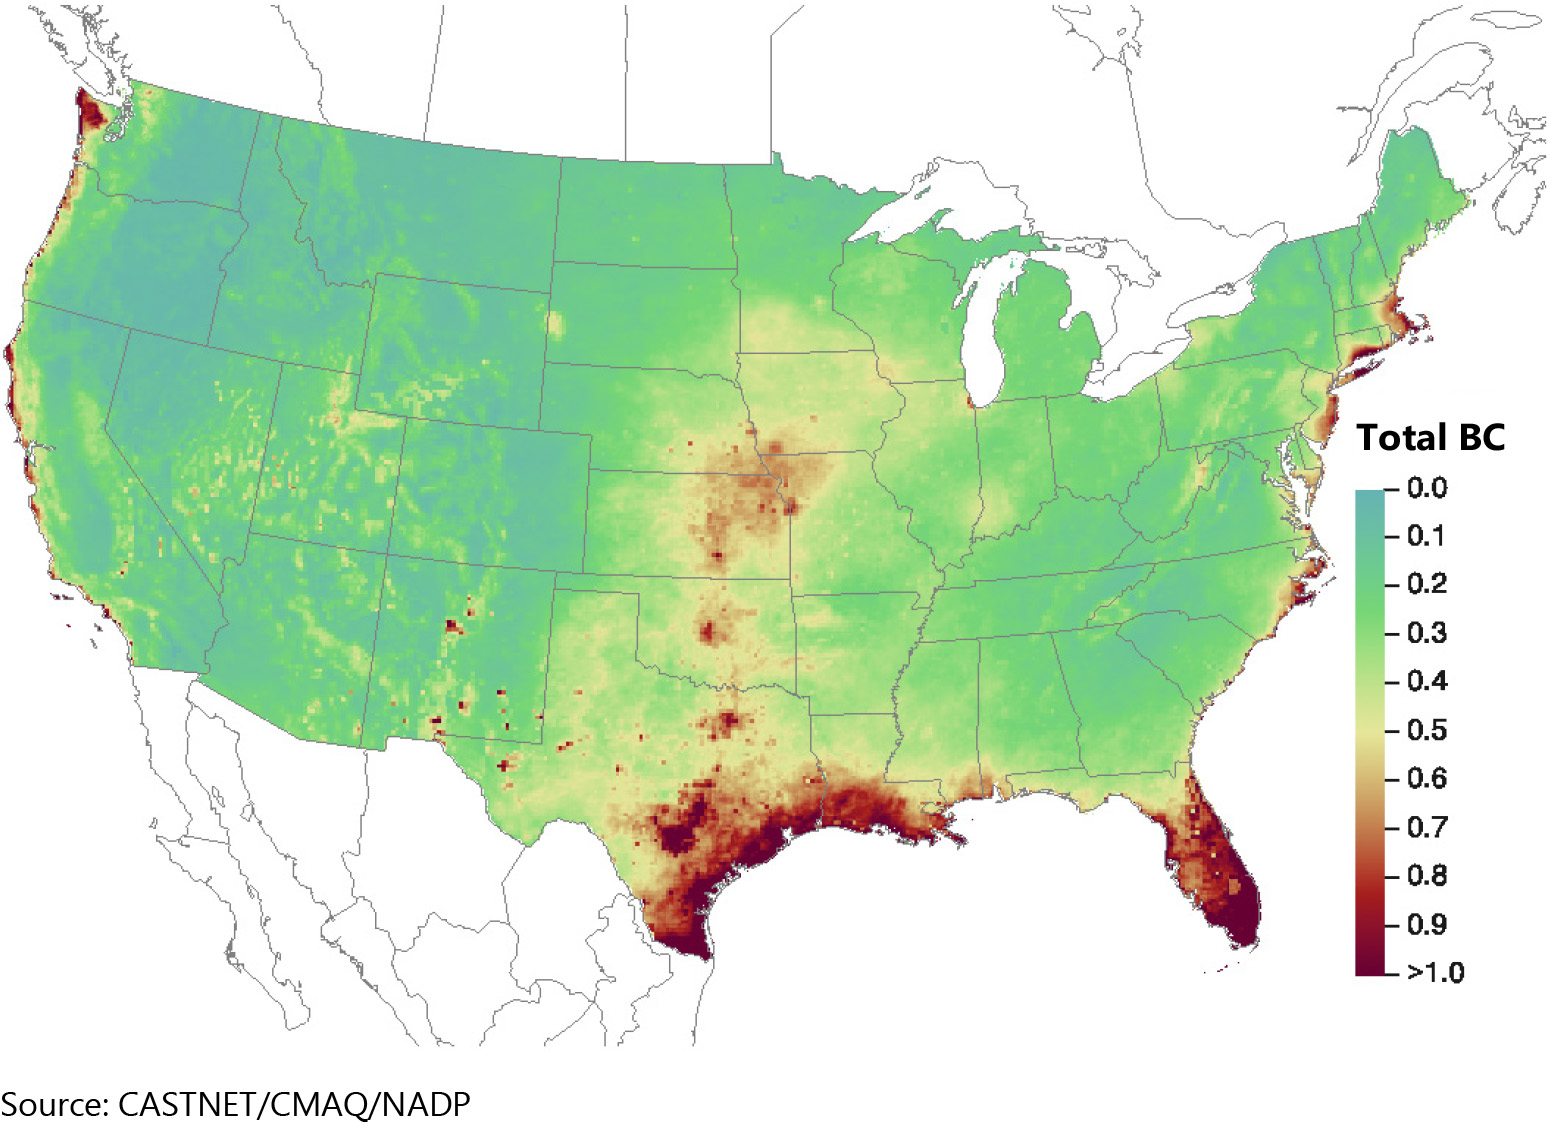
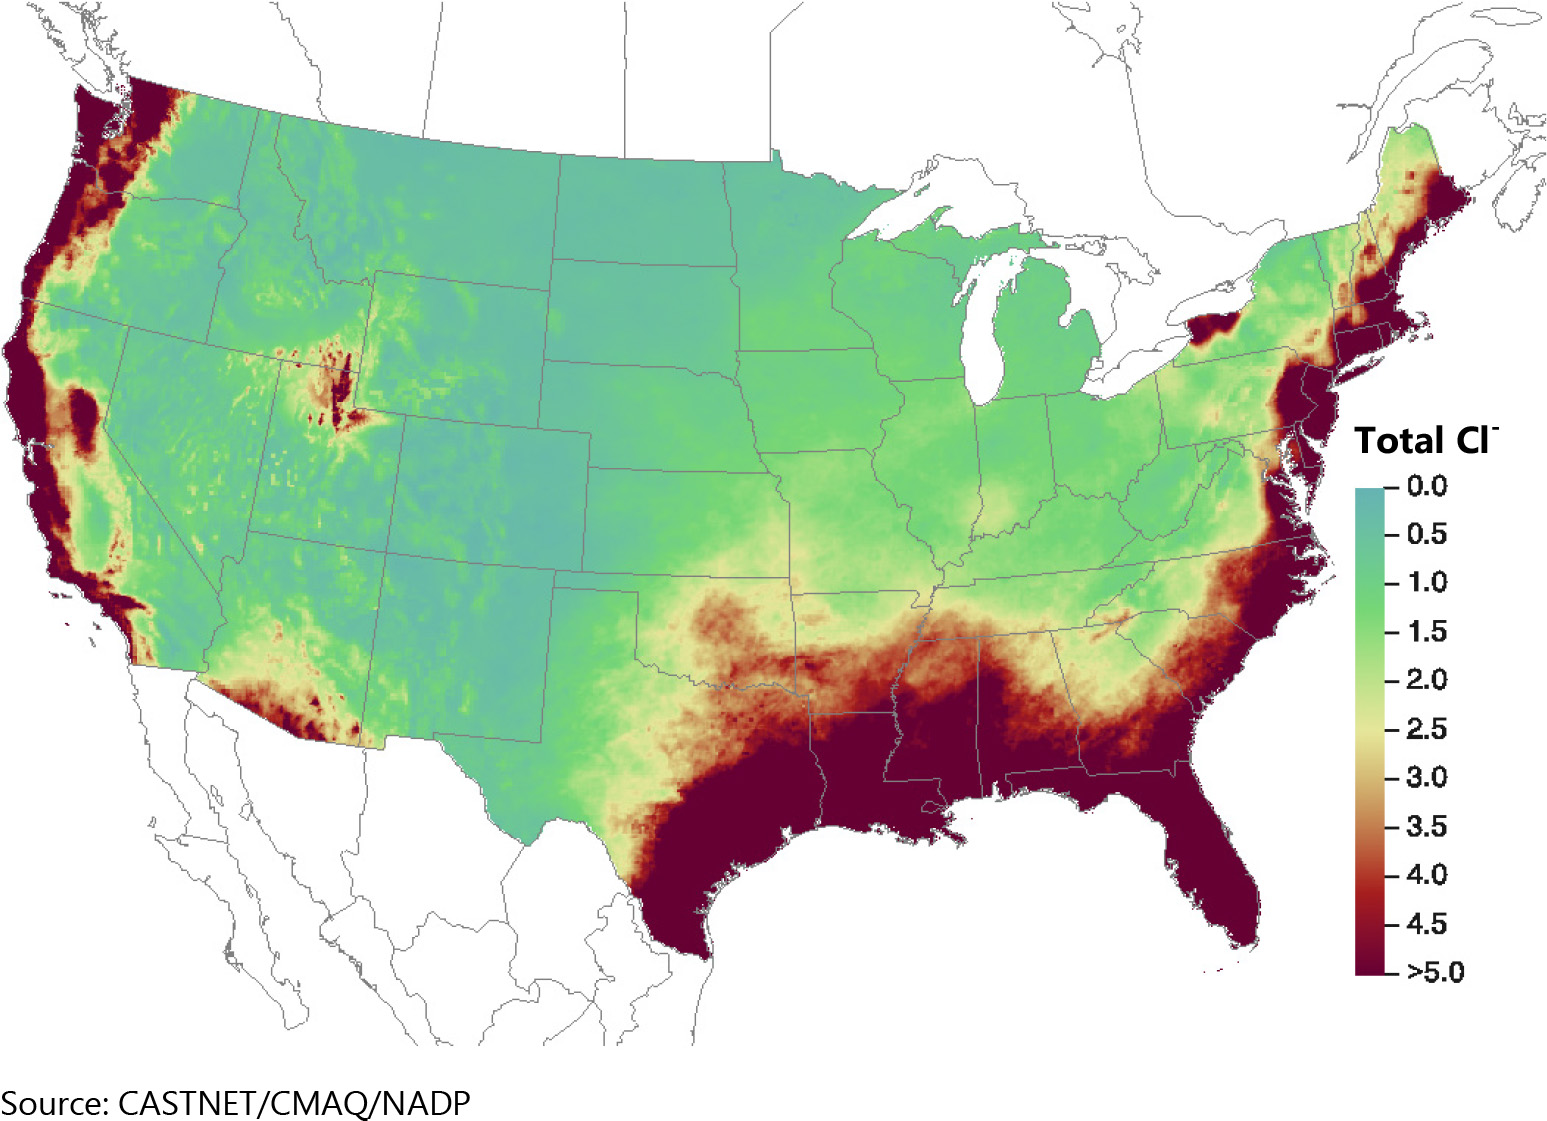
Deposition of Base Cations and Chloride
A map of 2019 estimated total deposition of base cations (Ca 2+ , K + , Mg 2+ , and Na + ) is given in Figure 35. Figure 36 provides 2019 estimated rates of deposition of total Cl - .
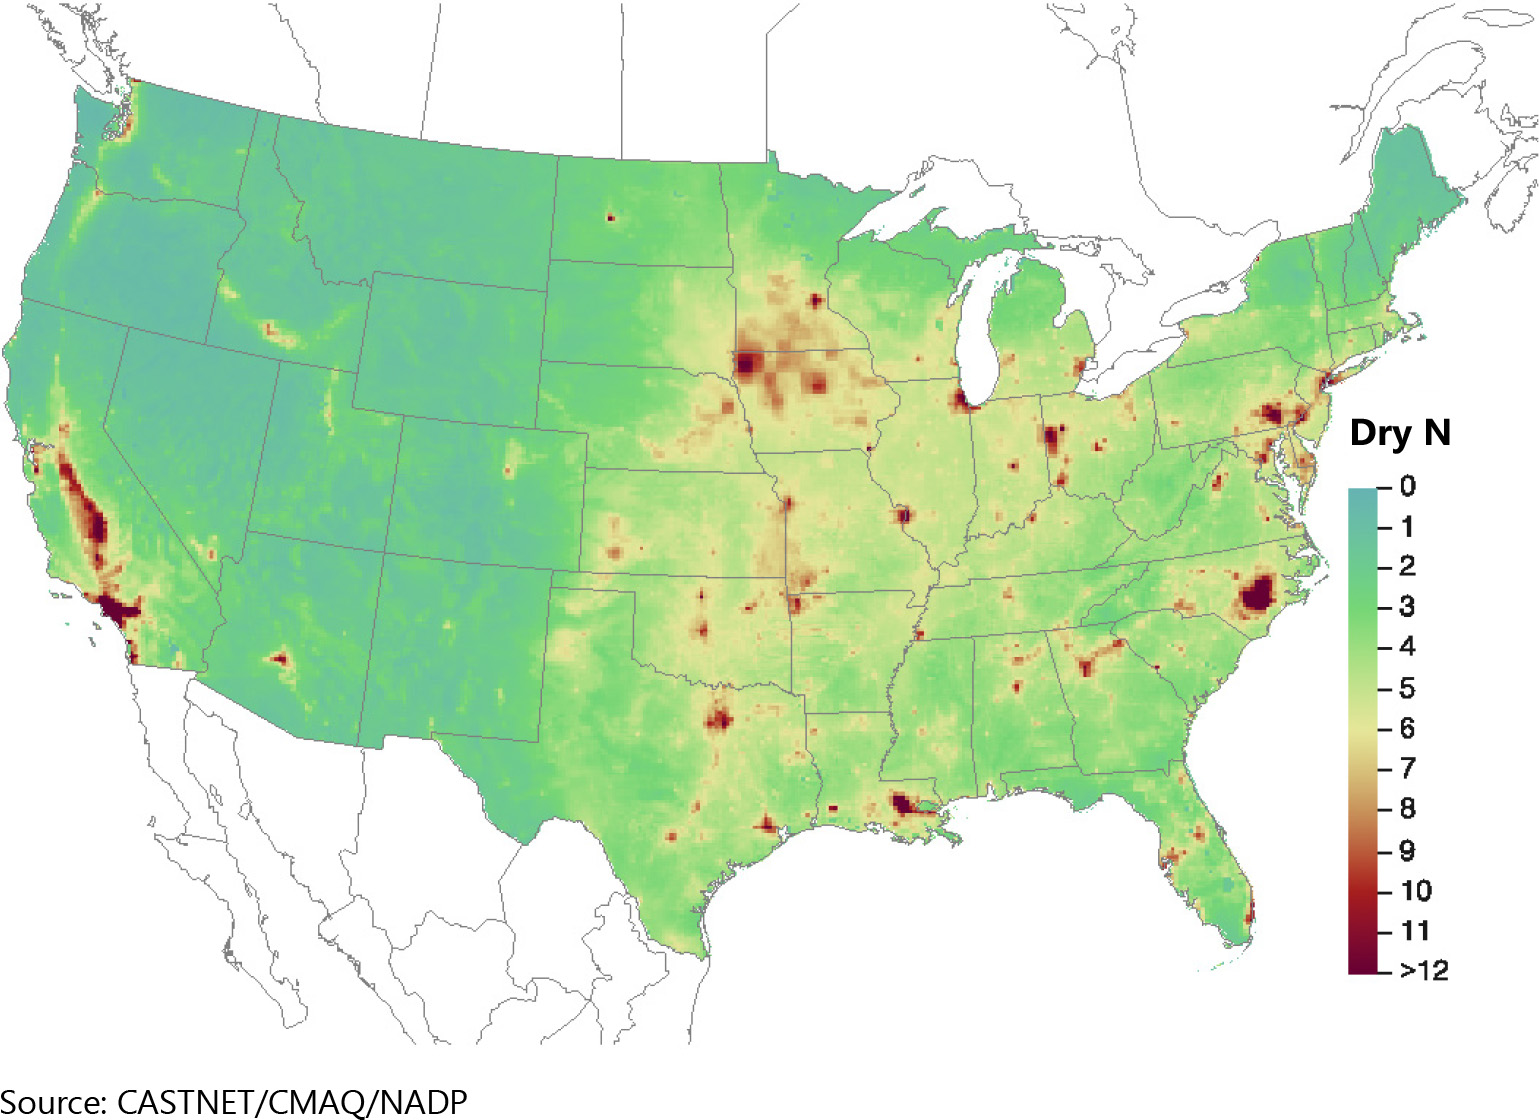
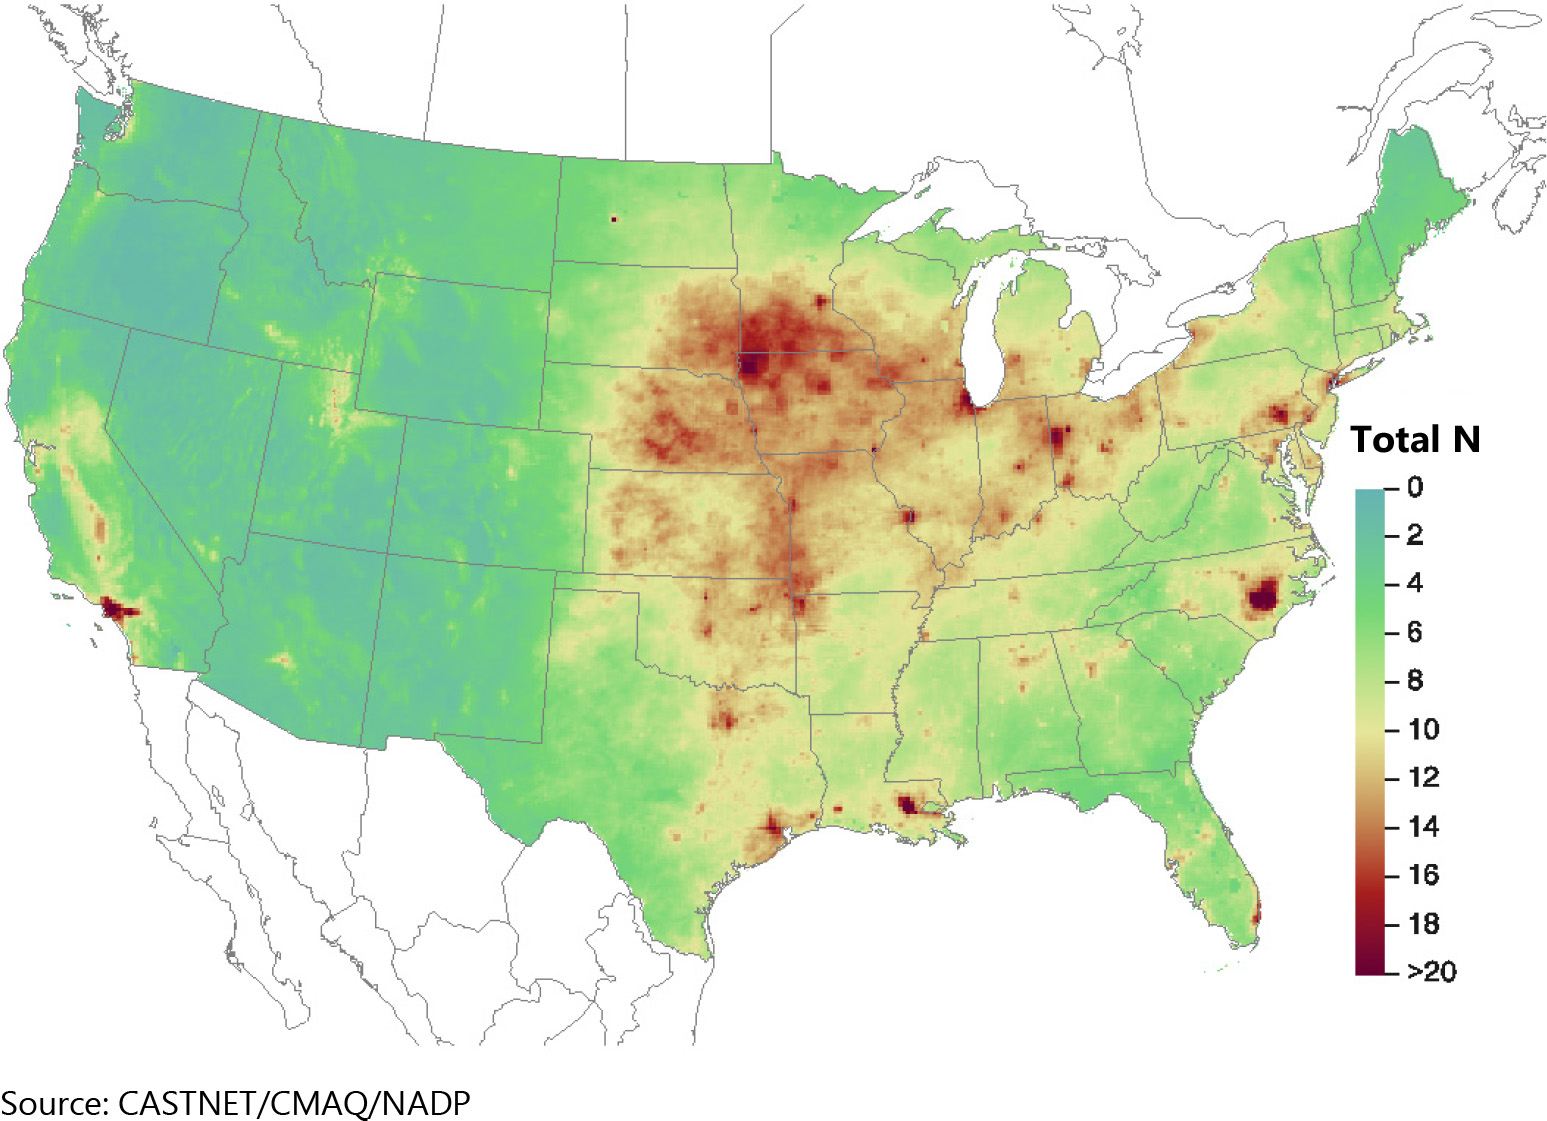
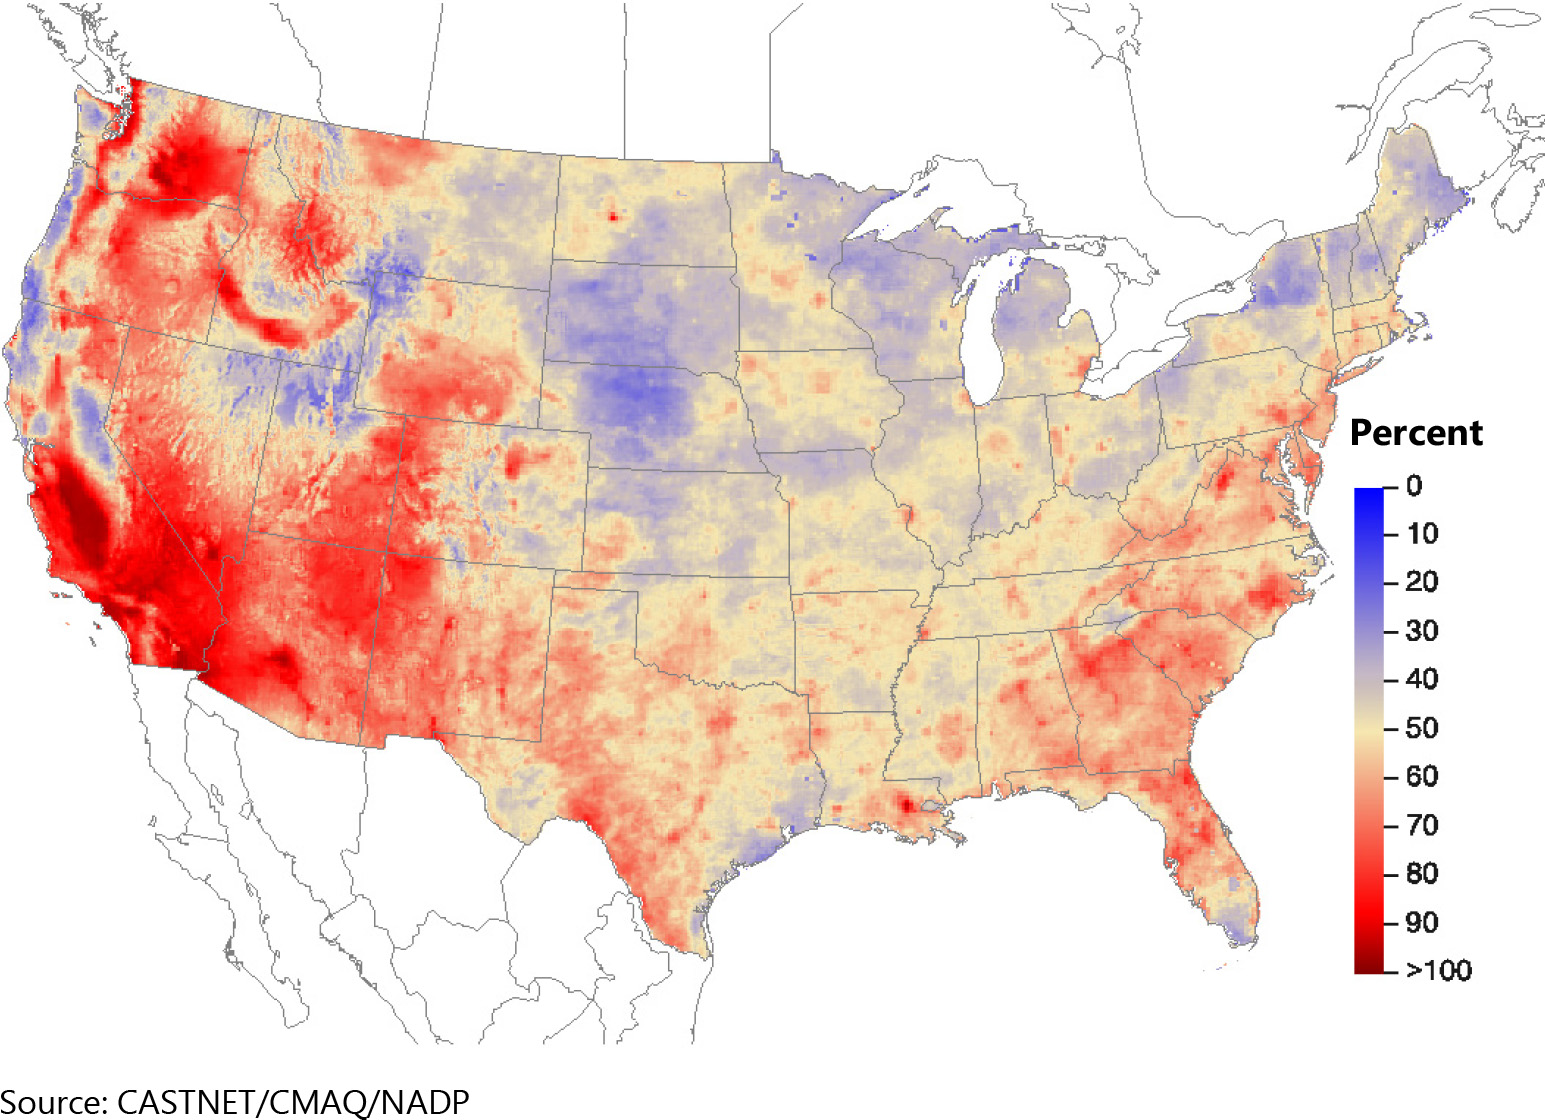
Figure 27 TDep Total Deposition Estimates of Reduced N Species (kg ha -1 yr -1 ) for 2019
 Download Figure
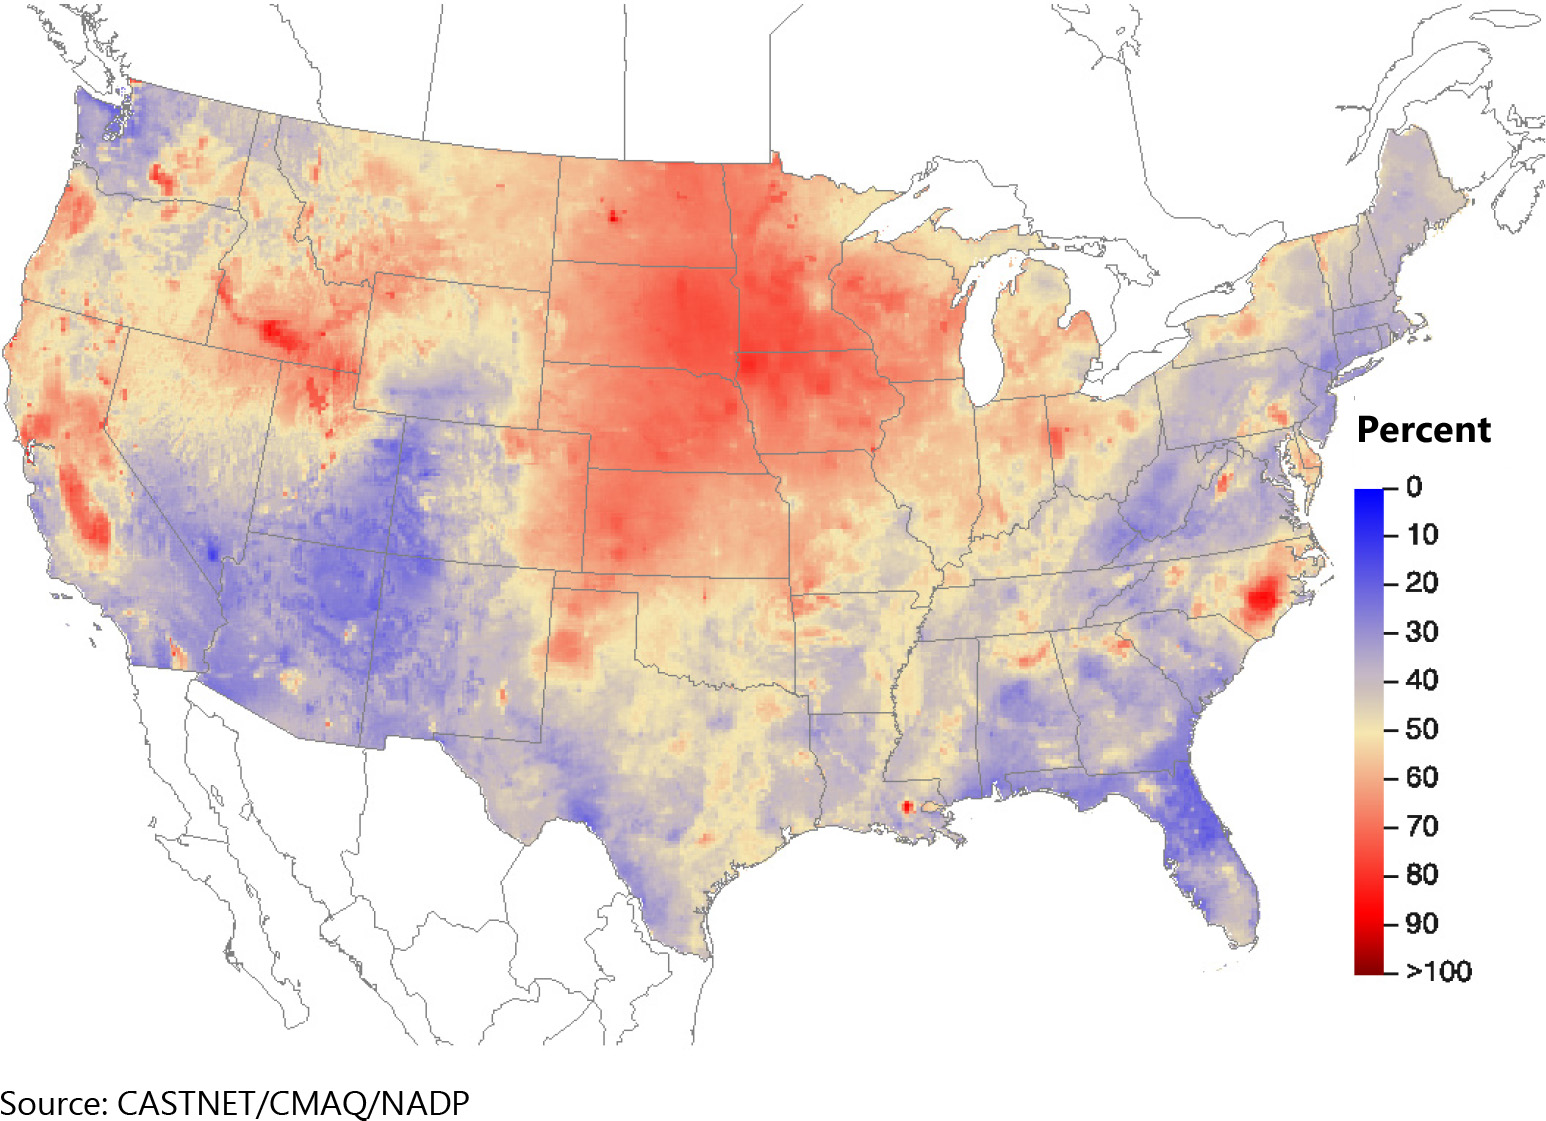
Figure 29 TDep Dry Deposition Estimates of Unmonitored N Species (kg ha -1 yr -1 ) for 2019
 Download Figure
Figure 30 TDep Percent of Total Deposition of N from Dry Deposition of Unmonitored Species for 2019
 Download Figure
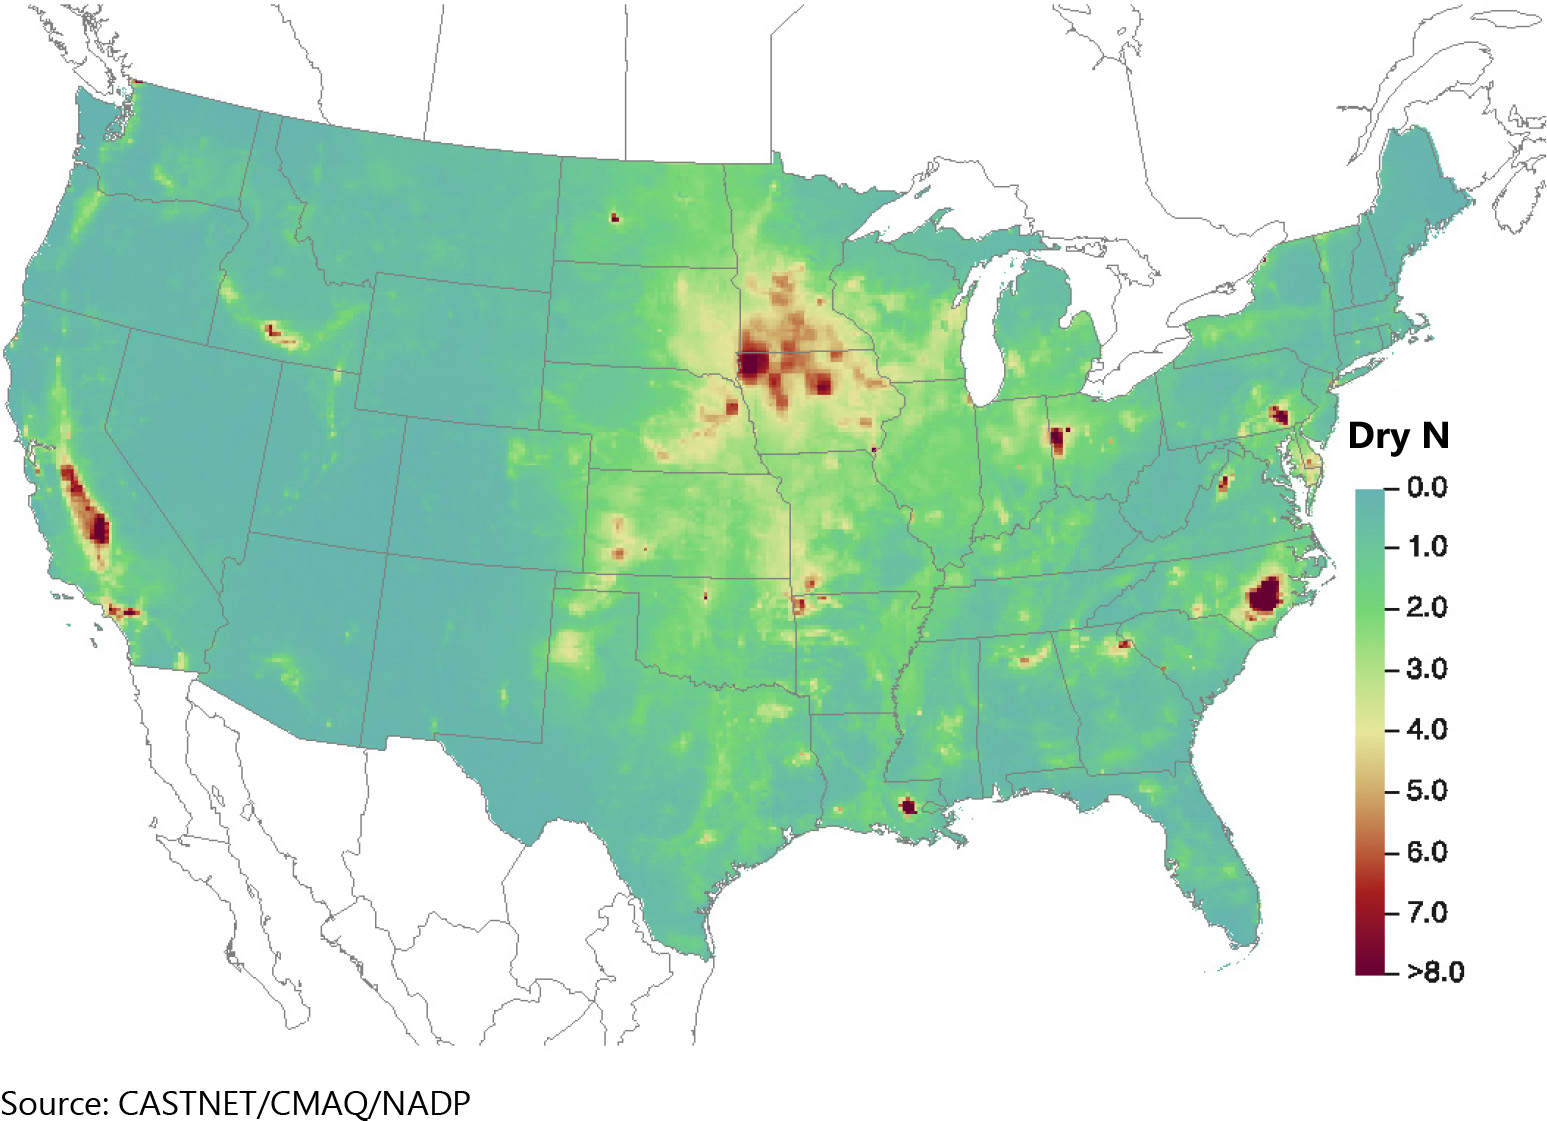
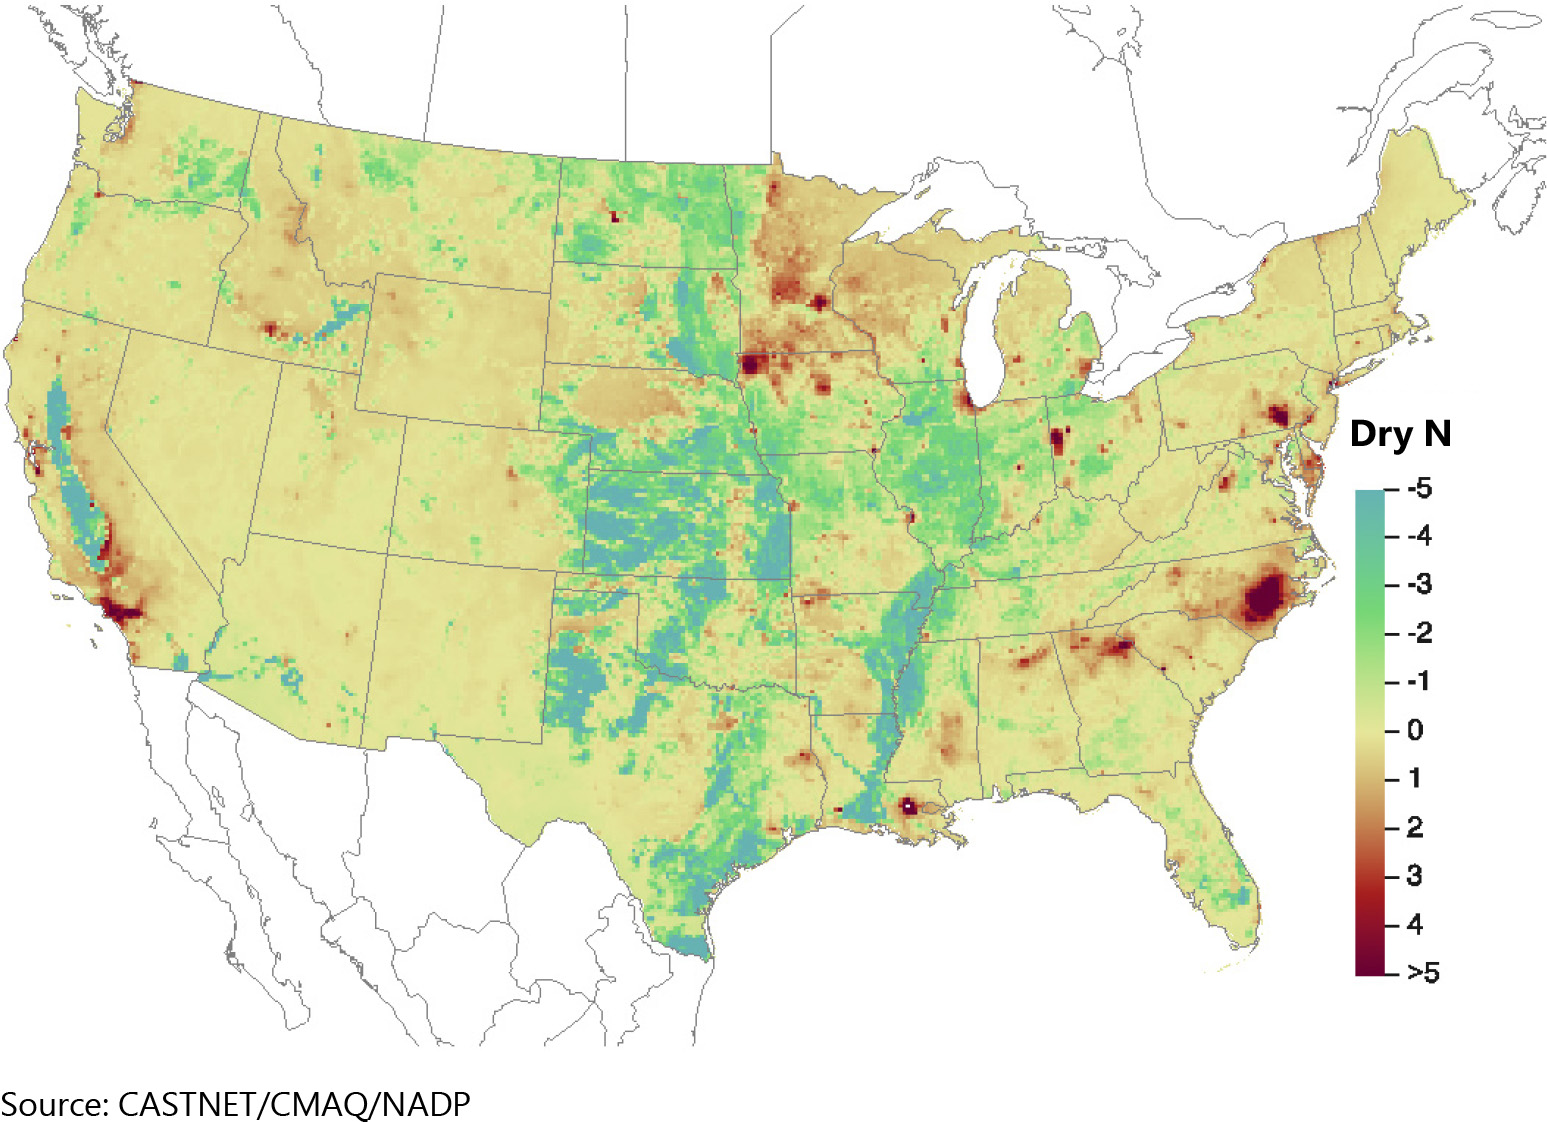
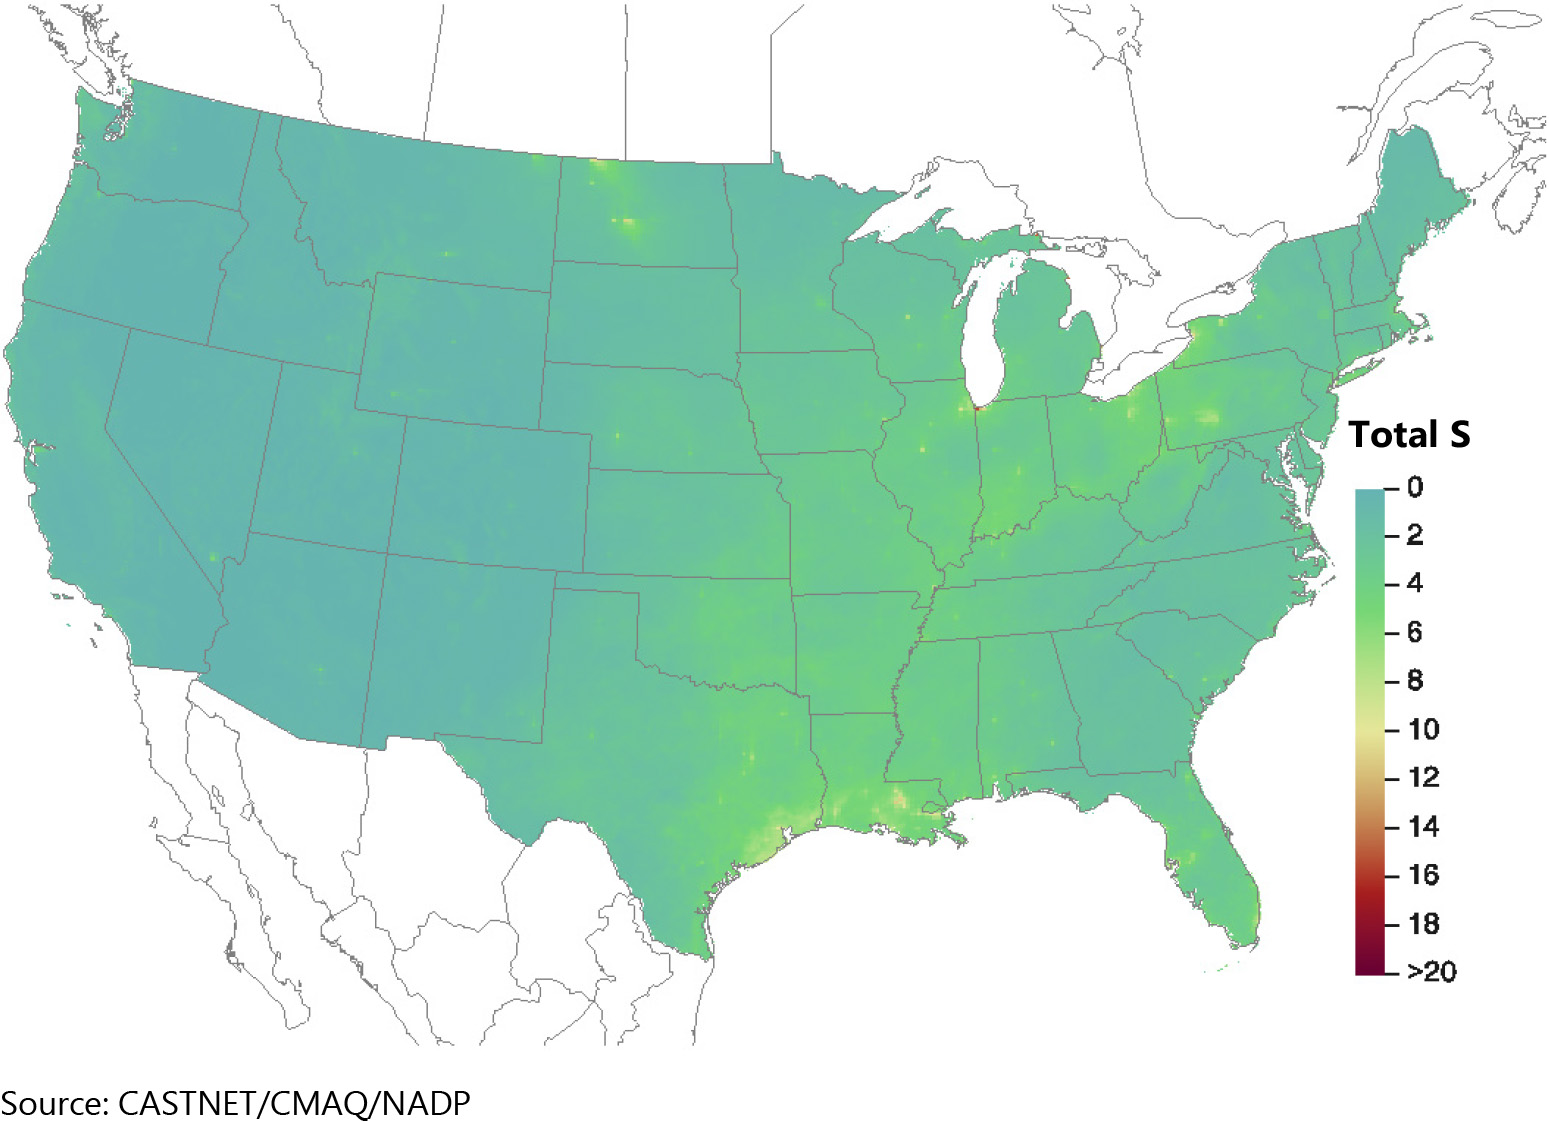
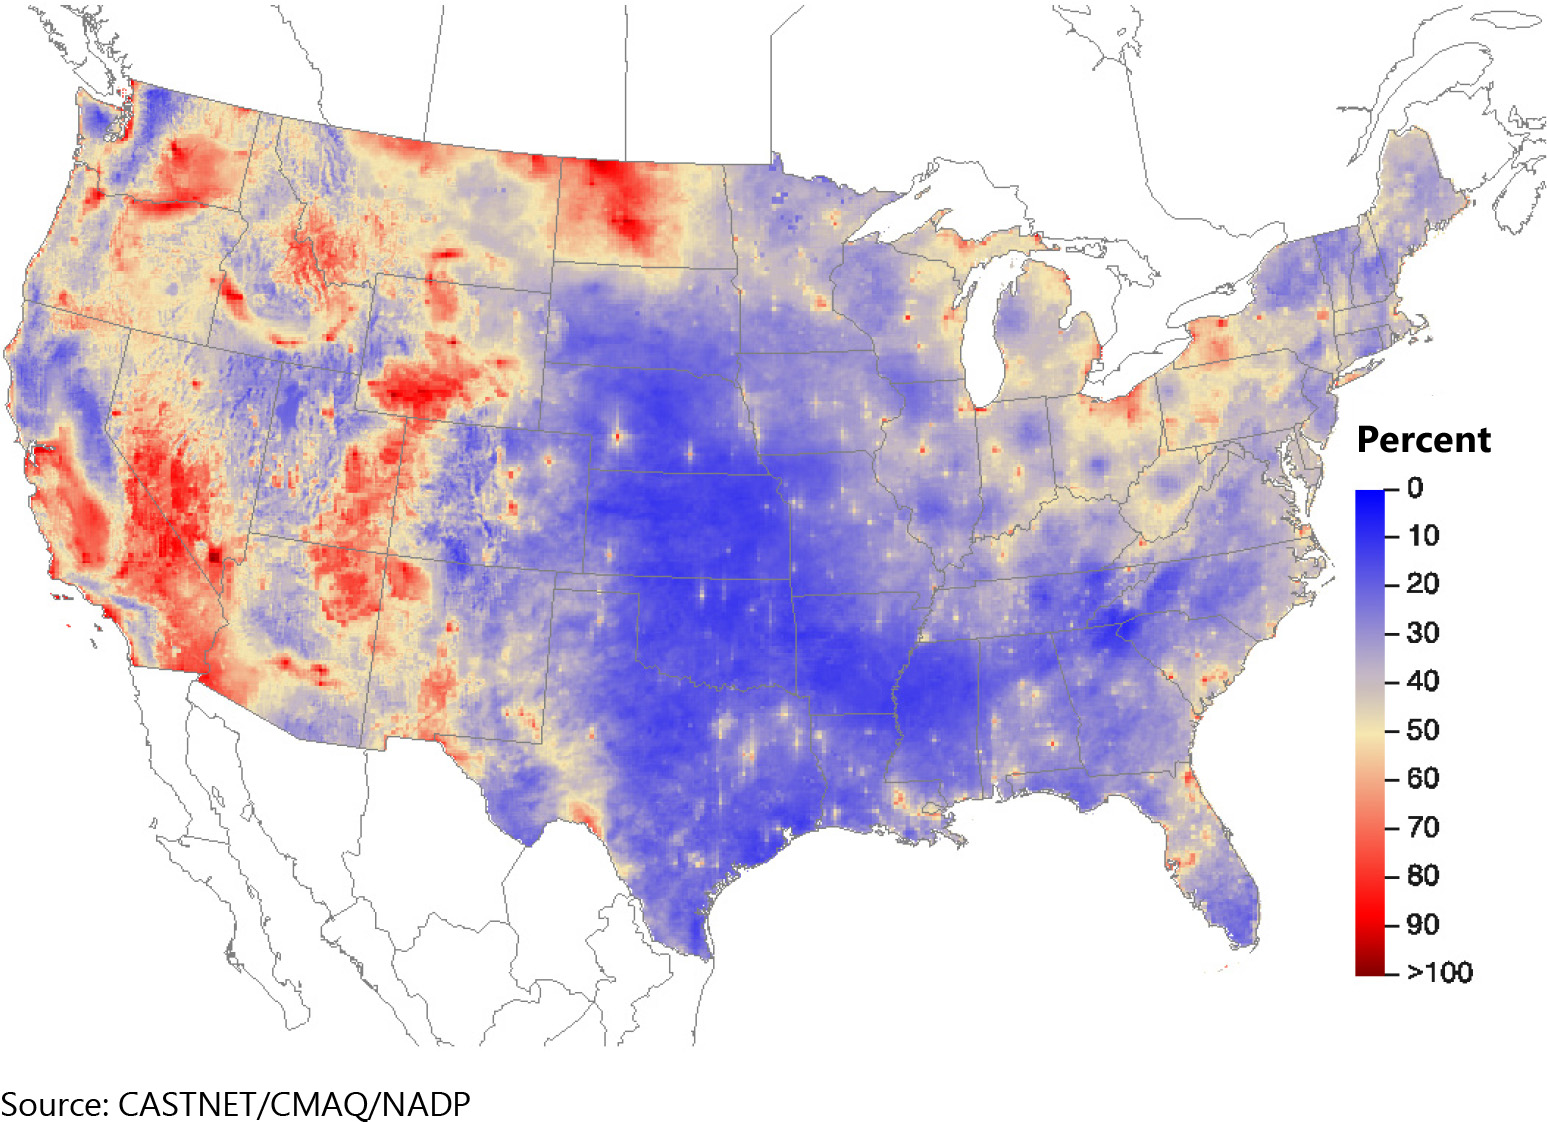
Figure 35 TDep Total Deposition Estimates of the Base Cations Ca 2+, K + , Mg 2+, and Na + (kiloequivalents per hectare per year) for 2019
 Download Figure
References
Byun, D. and Schere, K. L. 2006. Review of the Governing Equations, Computational Algorithms, and Other Components of the Models‐3 Community Multiscale Air Quality (CMAQ) Modeling System. Applied Mechanics Reviews, 59: 51‐77. doi:10.1115/1.2128636.
Chen, X., Day, D., Schichtel, B., Malm, W., Matzoll, A. K., Mojica, J., McDade, C. S., Hardison, E. D., Hardison, D. L., Walters, S., Van De Water, M., Collett, J. L. Jr. 2014. Seasonal Ambient Ammonia and Ammonium Concentrations in a Pilot IMPROVE NHx Monitoring Network in the Western United States. Atmospheric Environment 91, 118-126.
Du, E., de Vries, W., Galloway, J. N., Hu, X., Fang, J. 2014. Changes in Wet Nitrogen Deposition in the United States between 1985 and 2012. Environmental Research Letters 9, 095004.
Li, Y., Schichtel, B., Walker, J. T., Schwede, D. B., Chen, X. I., Lehmann, C., Puchalski, M., Gay, D., Collett, J. L. Jr. 2016. The Increasing Importance of Deposition of Reduced Nitrogen in the United States. Proceedings of the National Academy of Sciences, 113, 5874–5879.
Rogers, C., Mishoe, K., Stewart, M., Barry, K., Rice, J., Chen, X., Walker, J. T., Puchalski, M., Baumgardner, R., and Schichtel, B. 2021. Improving Characterization of Reduced Nitrogen at IMPROVE and CSN Monitoring Sites. U.S. Environmental Protection Agency, Washington, DC, 2021. https://cfpub.epa.gov/si/si_public_record_Report.cfm?dirEntryId=350728&Lab=CEMM. Accessed March 2021.
Schwede, D. B. and Lear, G. G. 2014. A Novel Hybrid Approach for Estimating Total Deposition in the United States. Atmospheric Environment, 92:207-220. doi:10.1016/j.atmosenv.2014.04.008.
Wood Environment & Infrastructure Solutions, Inc. (Wood). 2020. Clean Air Status and Trends Network (CASTNET) 2018 Annual Report. Prepared for U.S. Environmental Protection Agency (EPA), Office of Air and Radiation, Clean Air Markets Division, Washington, DC. Contract No. EP-W-16-015. Gainesville, FL. http://java.epa.gov/castnet/documents.do.
Wood Environment & Infrastructure Solutions, Inc. (Wood). 2019. Clean Air Status and Trends Network (CASTNET) Quality Assurance Project Plan (QAPP) Revision 9.2. Prepared for U.S. Environmental Protection Agency (EPA), Office of Air and Radiation, Clean Air Markets Division, Washington, DC. Contract No. EP-W-16-015. Gainesville, FL. https://www.epa.gov/castnet/documents-reports#QualityAssuranceProjectPlan.
Yu, X., Lee, T., Ayresa, B., Kreidenweis, S., Malm, W., Collett, J. 2006. Loss of Fine Particle Ammonium from Denuded Nylon Filters. Atmospheric Environment, 40 4797–4807.