CASTNET Overview
Introduction
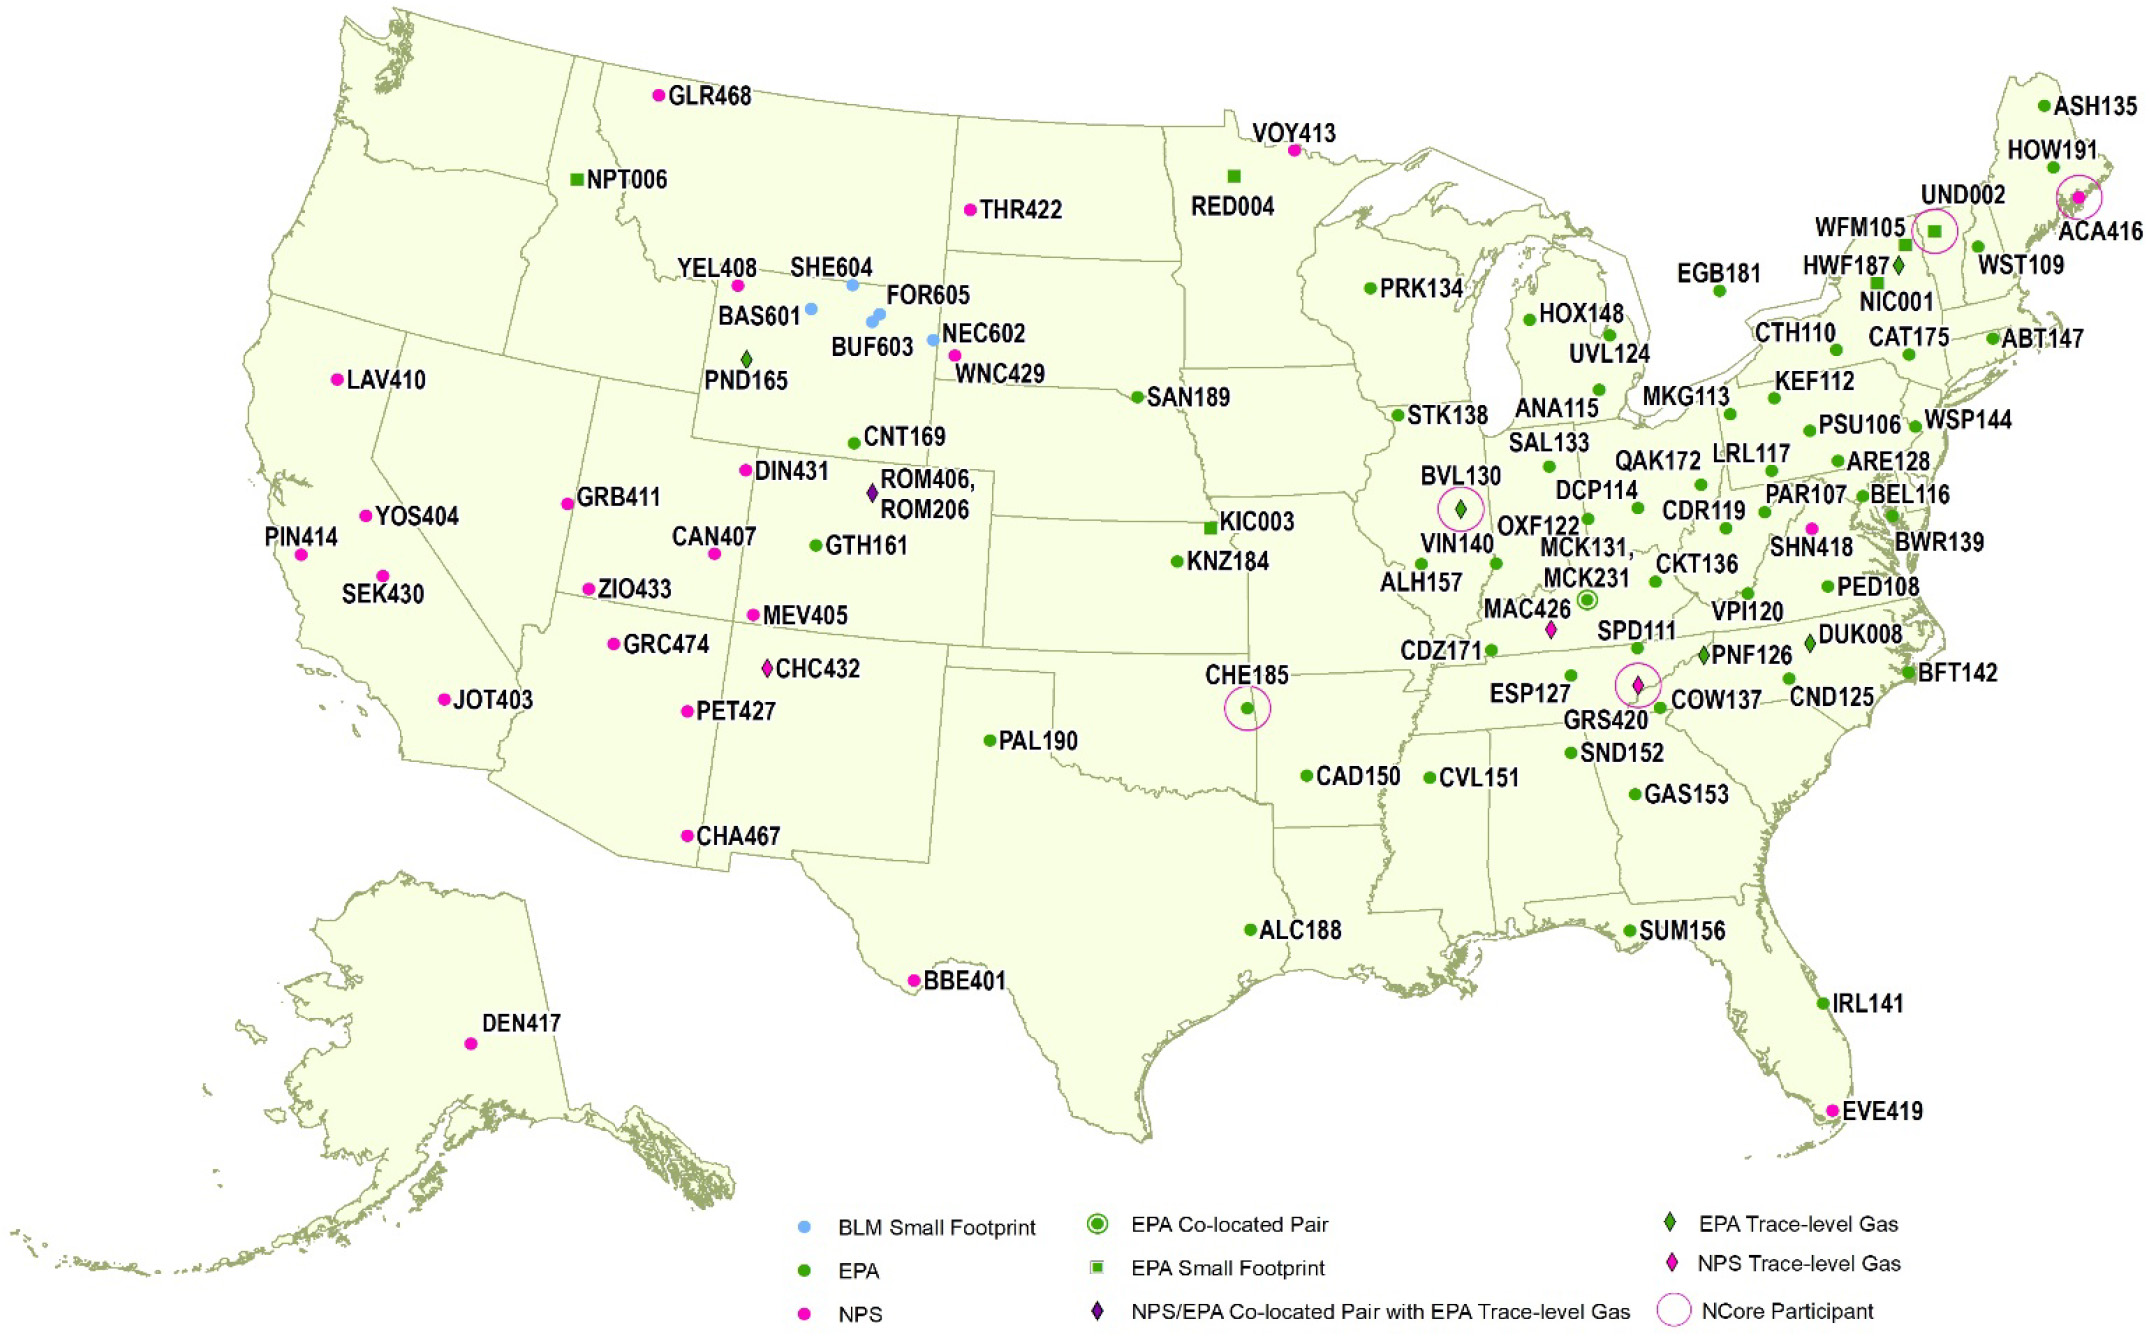
The Clean Air Status and Trends Network (CASTNET) operated 96 monitoring stations throughout the contiguous United States, Alaska, and Canada in 2018. Ninety-five sites included filter pack systems to sample weekly concentrations of acidic gases and particulate matter. Eighty-three sites included continuous ozone (O3) analyzers. The U.S. Environmental Protection Agency (EPA) and the National Park Service (NPS) are the primary sponsors of CASTNET. NPS began its participation in 1994 and operated 27 sites during 2018. The Bureau of Land Management-Wyoming State Office (BLM) operated five sites in Wyoming. View site locations on the CASTNET website.
Many organizations, including Native American tribes, state and federal government agencies, and universities, contribute to CASTNET (Program Partners). These participants sponsor individual CASTNET sites and provide in-kind services that support the overall performance of the network. For example, these participants operate and repair site instruments, change weekly filter packs, and perform general site maintenance. Many also provide the land for the CASTNET site.
Related Air Quality Networks
CASTNET monitors air quality and deposition in cooperation with other national and international networks. EPA uses data from CASTNET and the other long-term national networks to assess the effectiveness of emission control programs and to characterize rural air quality nationwide. These networks include the National Atmospheric Deposition Program (NADP; http://nadp.slh.wisc.edu/) and its affiliated networks:
- National Trends Network (NTN)
- Ammonia Monitoring Network (AMoN)
- Mercury Deposition Network (MDN)
- Atmospheric Mercury Network (AMNet)
Other cooperating networks include:
- Canadian Air and Precipitation Monitoring Network (CAPMoN)
- EPA’s National Core Monitoring (NCore)
- BLM’s Wyoming Air Resources Monitoring System (WARMS)
- Interagency Monitoring of Protected Visual Environments (IMPROVE)
Locations of Monitoring Sites
A map of CASTNET monitoring sites is given in Figure 1. In 2018, 96 monitoring sites were operated at 94 distinct locations. To estimate precision across the network, co-located sites were operated at Mackville, KY (MCK131/231) and Rocky Mountain National Park, CO (ROM406/206) during 2018. The ROM406/206 pair ensures consistency between EPA (ROM206) and NPS (ROM406). Of the two Rocky Mountain monitoring sites, ROM406 is specified as the regulatory monitoring site for O3.
Measurements Recorded at CASTNET Sites
During 2018, all but one CASTNET site (CHC432, NM), measured weekly ambient concentrations of acidic pollutants, base cations, and chloride (Cl -) using a 3-stage filter pack with a controlled flow rate (Wood, 2018). Gaseous pollutant concentrations include nitric acid (HNO3) and SO2. Particulate concentrations include nitrate (NO3-), ammonium (NH4+), sulfate (SO42-), magnesium (Mg 2+), calcium (Ca 2+), potassium (K + ), sodium (Na + ), and Cl -. The filter pack is exchanged each Tuesday and shipped to the analytical chemistry laboratory for analysis. Ambient temperature is measured at all sites in part to enable conversion of concentrations to local conditions.
Most CASTNET sites include a temperature-controlled shelter and continuous O3 monitoring system. Ozone concentrations were measured at 83 sites. The O3 inlet and filter pack are located atop a 10-m tower. Some CASTNET sites also measure trace-level SO2, carbon monoxide (CO), and nitric oxide/total reactive oxides of nitrogen (NO/NOy). One site measures NO/total nitrogen oxides (NOx). In 2018, meteorological parameters were measured at 6 EPA-, 27 NPS-, and 5 BLM-sponsored CASTNET sites. Measured meteorological parameters include 2-m temperature, wind speed and direction, standard deviation of the wind direction, solar radiation, relative humidity, precipitation, and surface wetness (at select sites).
Quality Assurance Program
The CASTNET quality assurance (QA) program was established to ensure that all reported data are of known and documented quality in order to meet CASTNET objectives. The QA program also ensures intranetwork consistency and comparability and the delivery of data that are reproducible and comparable with data from other monitoring networks. The 2018 QA program elements are documented in the CASTNET Quality Assurance Project Plan (QAPP; Wood, 2018). The QAPP includes standards and policies for all components of project operation, from site selection through final data reporting, with appendices that provide standard operating procedures for CASTNET operations.
Data quality indicators (DQI) such as precision, accuracy, and completeness are used to assess CASTNET measurements and supporting activities. Routine assessment and analysis help guarantee the production of high-quality data and information to meet project objectives. Measurements taken during 2018 and historical data collected over the period 1990 through 2017 were analyzed relative to DQI and their associated metrics. Results from these analyses are available in quarterly and annual QA reports posted on the EPA CASTNET website.
The Wood CASTNET laboratory regularly participates in interlaboratory comparison studies and proficiency testing (PT) programs such as the Environment and Climate Change Canada (ECCC) PT Program for Inorganic Environmental Substances. The ECCC PT program conforms to the requirements of the American Association for Laboratory Accreditation (A2LA). The program meets the International Organization for Standardization (ISO)/International Electrotechnical Commission (IEC) 17043:2010 conformity assessment – general requirements for proficiency testing with scope of accreditation 2867.01. The results reported are evaluated for systematic bias and precision. Systematic bias is assessed using the Youden non-parametric analysis (1969), while precision is calculated using Algorithm A from the ISO standard 13528 (ISO, 2005). CASTNET laboratory results from the PT studies are summarized in the QA annual reports posted to the EPA CASTNET website.
Results
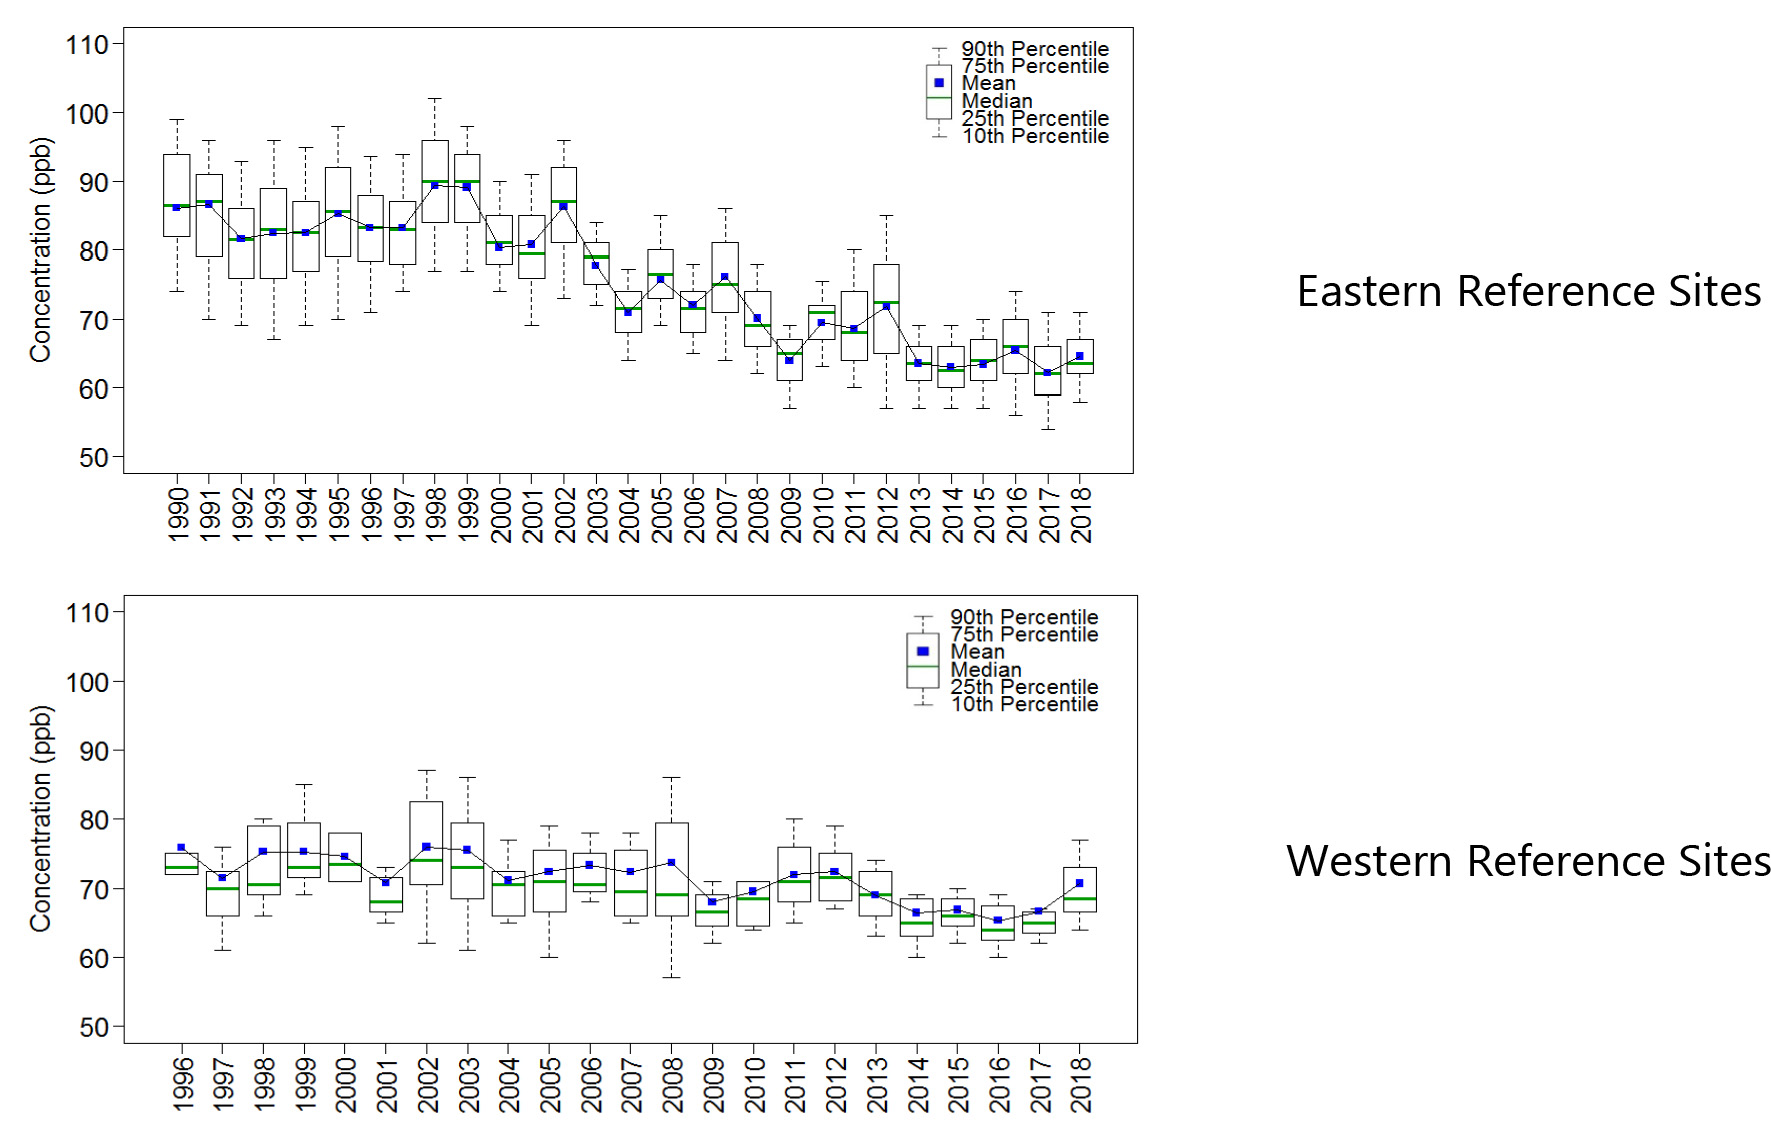
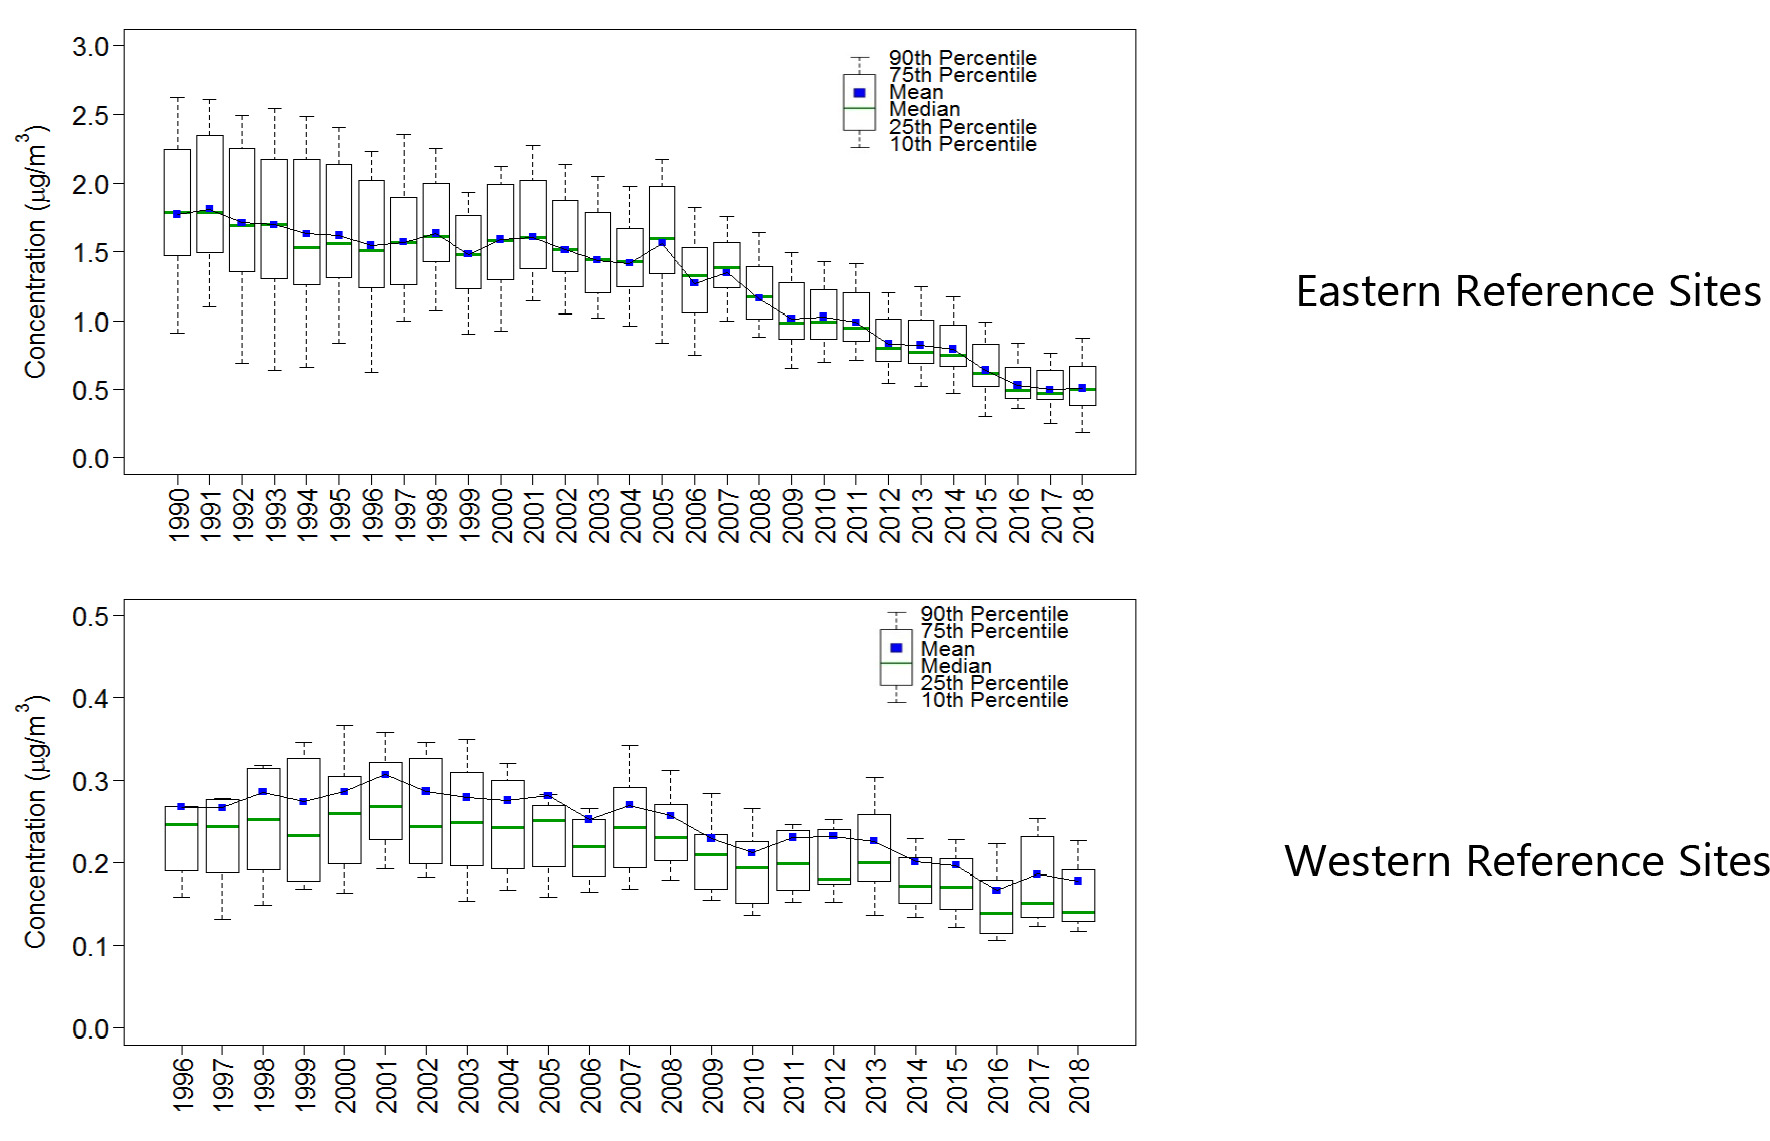
Trends in fourth highest DM8A O3 concentrations and annual sulfur and nitrogen levels are depicted in the following sections using box plots showing 1-year mean, median, and annual distributions of concentrations aggregated from 34 eastern reference sites for 1990 through 2018 and for 16 western reference sites for 1996 through 2018. The reference sites were selected for their long-term data records and consistent performance. All data used to create the figures and maps in this report are available on the CASTNET website.
Network Operation Challenges
CASTNET began operating monitoring sites in 1987 with about 50 sites in operation during the first five years of the network. Years of use and weather take a toll on equipment and equipment shelters, and regular maintenance is needed. The non-permanent shelters at the monitoring sites, while sturdy, have a limited life expectancy compared to a standard, permanent structure and need additional upkeep. All monitoring shelters are also subject to extreme weather and associated storm damage (e.g., hurricanes, flooding, and lightning) depending on location.
Hurricane Damage to Beaufort, NC (BFT142) and Sumatra, FL (SUM156)
During 2018, Hurricane Florence made landfall as a Category 1 hurricane on the morning of September 14 over Wrightsville Beach, NC, a few miles east of Wilmington and not far from the CASTNET site at BFT142. The hurricane came ashore with 90 mph winds and significant storm surge. In anticipation of the storm, BFT142 was shut down on September 11. Hurricane Florence severely flooded the site and surrounding area.
Site shutdown preparations included checking the guy wires to the sampling tower and removing critical equipment. The tower itself was left in place. Site shutdown preparations also included removing the deposition filter pack and returning it to the CASTNET laboratory in Gainesville, FL. The following instruments and equipment were removed.
- ozone analyzer
- ozone transfer standard
- air compressor
- flow pump
- mass flow controller
- data logger
- weighing precipitation gauge
- site records including the logbook and report forms
After the hurricane, the BFT142 site required repairs to both power and infrastructure. The shelter was knocked off its foundation, and the sampling tower was damaged. The soft, super-saturated ground prevented vehicles from accessing the monitoring site for repairs until March 2019. During repairs, the shelter was raised as a preventive measure. The site was eventually reopened on March 18, 2019, six months after the hurricane.
Hurricane Michael was the first Category 5 hurricane to strike the contiguous United States since Hurricane Andrew in 1992. It made landfall in Florida on October 10, 2018, between Mexico Beach and Tyndall Air Force Base near Panama City and approximately 25 miles west of SUM156. Communication with the SUM156 site was lost on October 11. Ultimately, the SUM156 infrastructure was not damaged except for the power pole, which was replaced. Routine monitoring was re-established on December 28, 2018.
Aging Infrastructure and the Efforts to Counteract the Effects of Aging
In general, CASTNET monitoring sites are affected by weather ranging from extreme cold with frost heaving to extreme heat and humidity. Damage from insects and animals also occurs. Ants, bees, roaches and other insects are attracted to the shelters. Sites are routinely checked for the following:
- damage to flow towers (e.g., cracks in the tower, loose or broken guy wires);
- roof leaks that cause wall, floor, and counter damage along with mold and mildew;
- aging weather stripping and insulation that can impact shelter and bench temperatures;
- frost heaving that can damage shelter foundations and tower bases;
- site flooding;
- extreme heat and extreme cold affecting air conditioning and heating, data logger batteries, and other instruments;
- storm damage from lightning, heavy rain, hail, and high winds;
- extreme weather damage from hurricanes, tornadoes, and blizzards;
- insect and animal damage to wiring connections and structures; and
- damage from other sources (e.g., vehicles, snowplows, etc.).
The following list describes some recent examples of the routine infrastructure repairs that are needed.
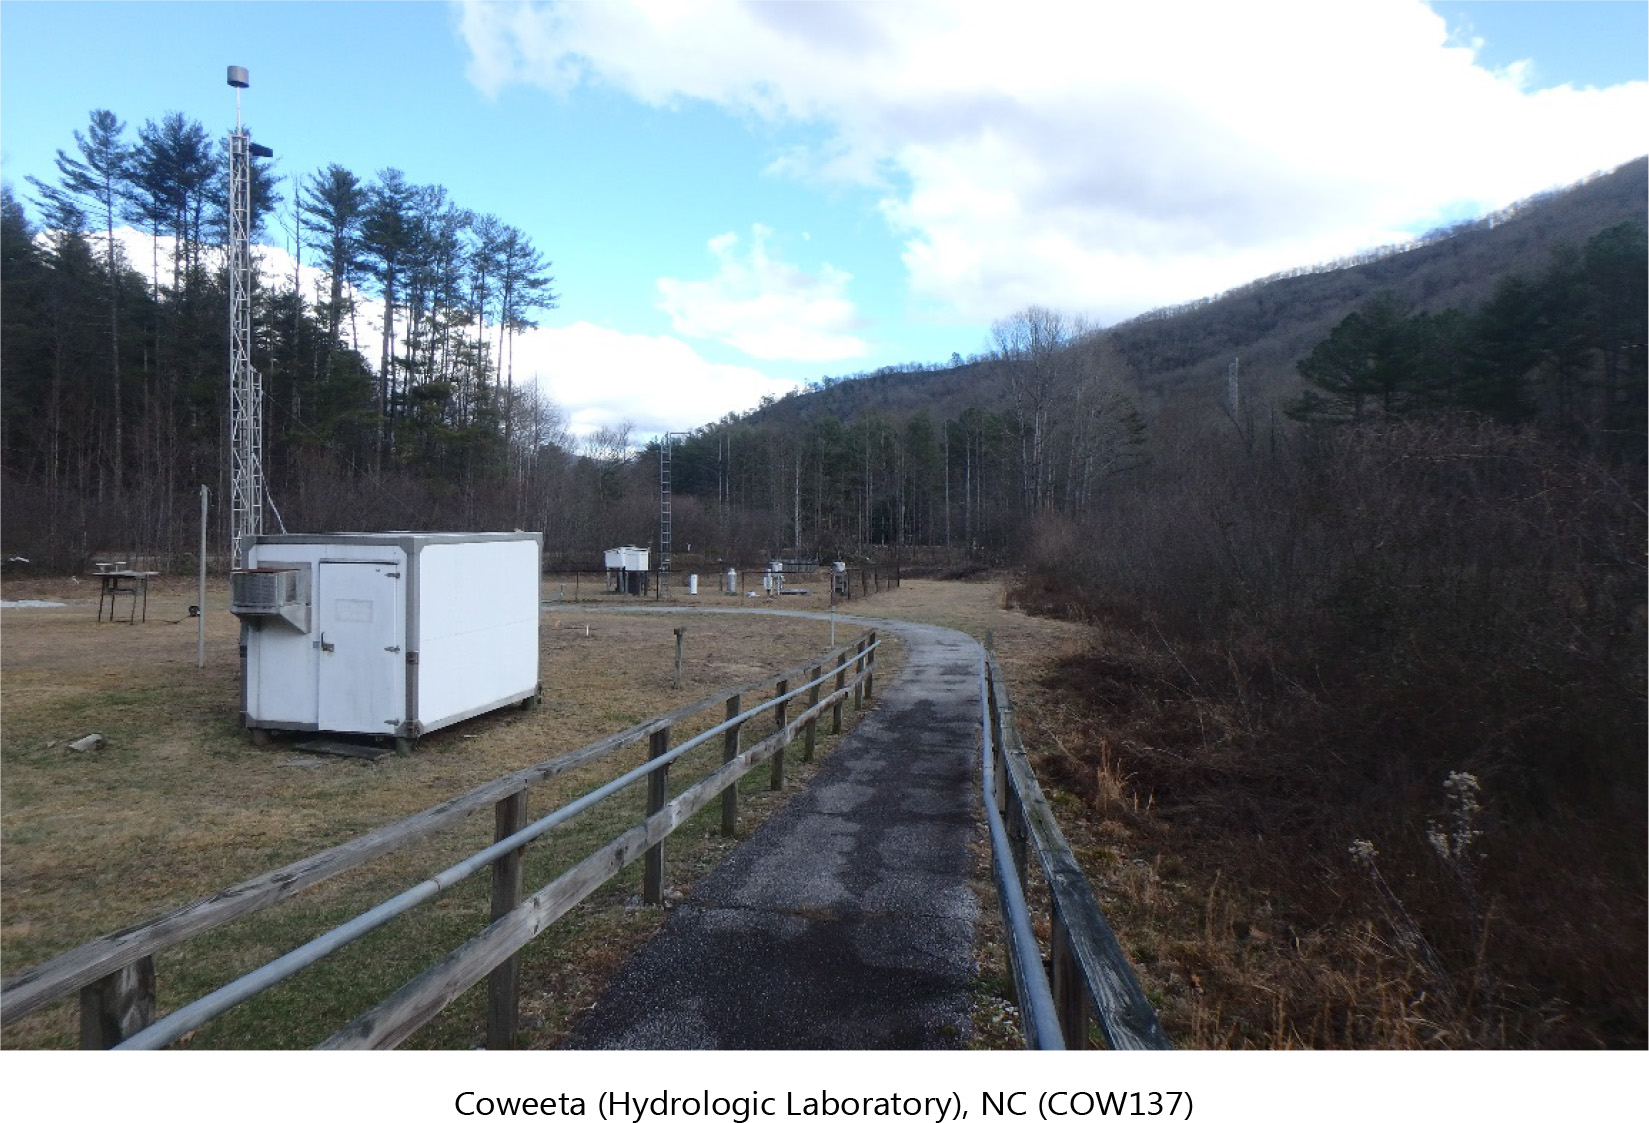
- Coweeta, NC (COW137)
On July 20, 2017, the flow tower cracked. A new tower was installed on September 20. - Perkinsville, WI (PRK134)
The flow tower was damaged. The flow tower was replaced on September 19, 2017. - Cranberry, NC (PNF126)
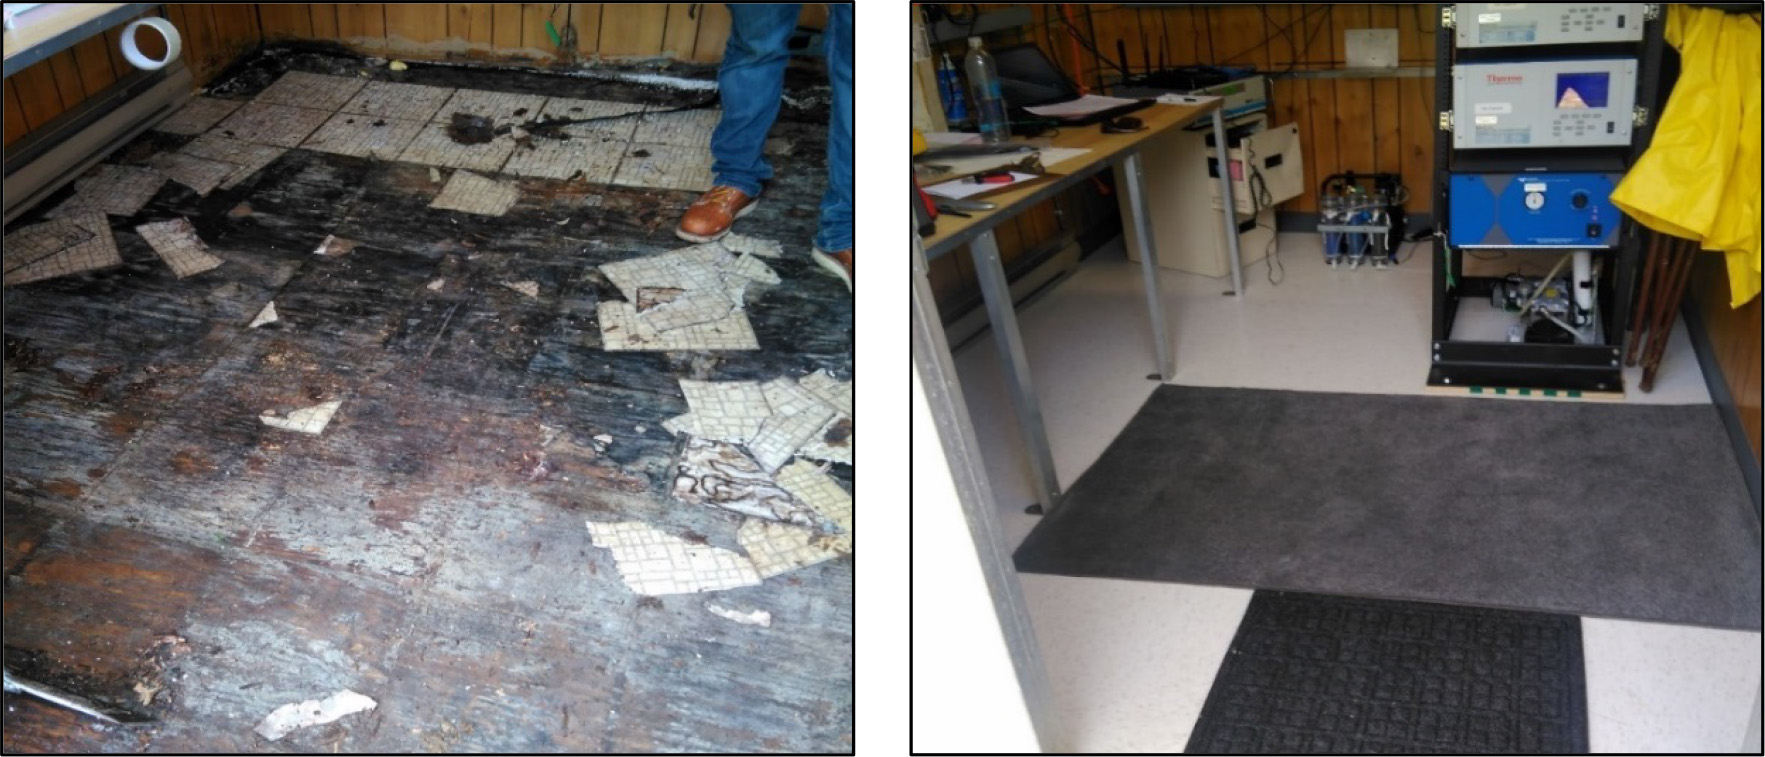
The leaking roof resulted in floor damage. On November 6, 2017, the floor and subfloor insulation were replaced. All exterior seams and rivets were sealed. The improvements to the PNF126 site are detailed in the following photographs. - Abington, CT (ABT147)
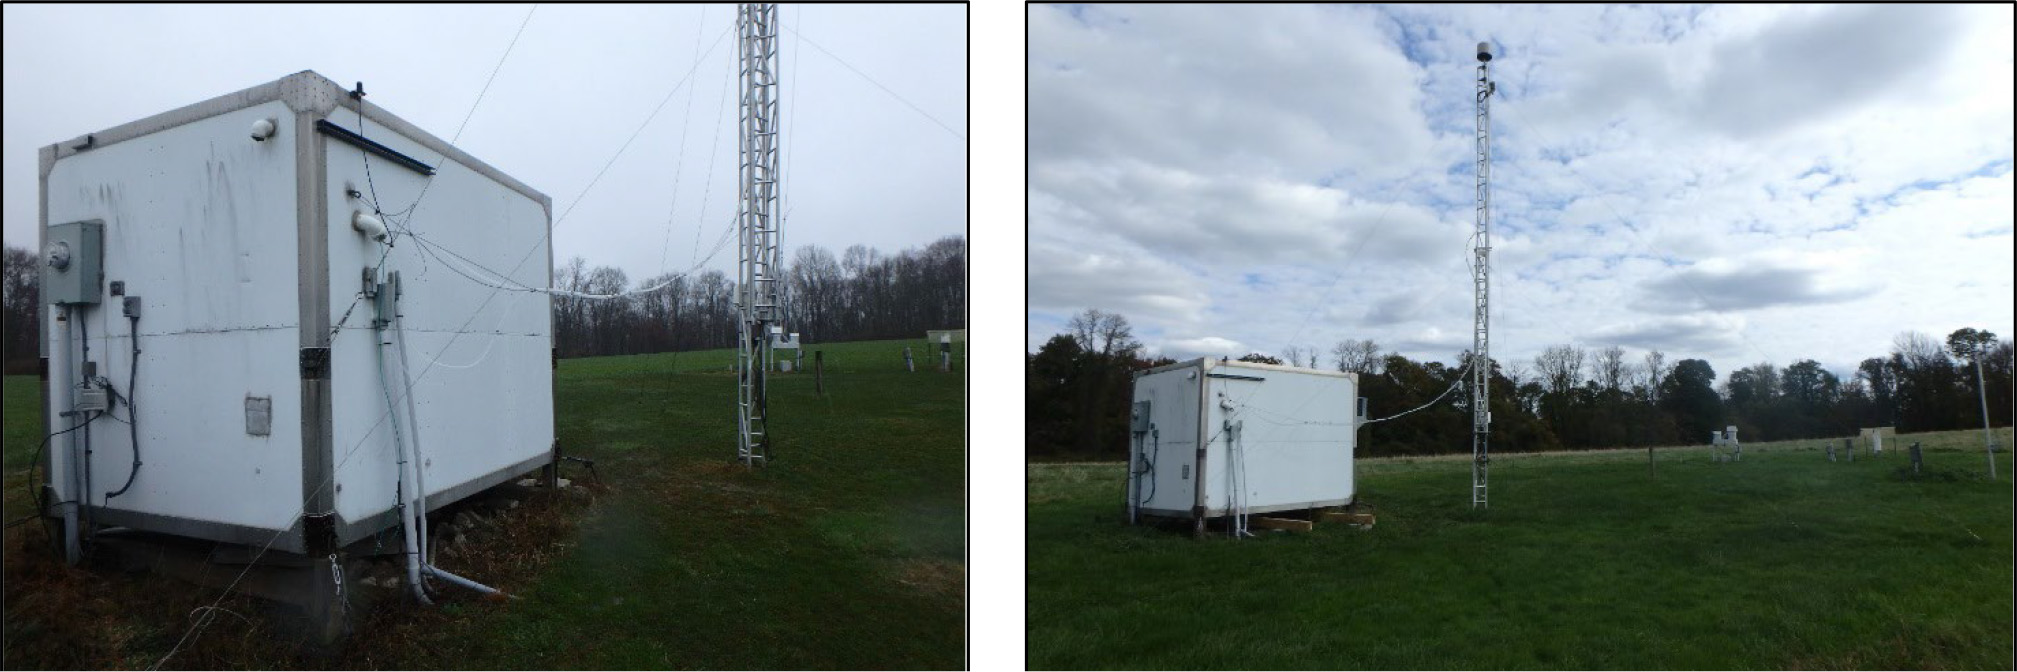
The shelter shifted due to frost heave and gravity and slid off the mounting posts. The shelter was remounted and stabilized on May 2, 2018 (see the following photographs). - Blackwater National Wildlife Refuge, MD (BWR139)
The bottom of a shelter wall rotted due to a leak in the roof. Repairs, including a new roof, inside wall, and floor replacement, were completed November 7, 2018.
Infrastructure issues are identified by the local site operator, Wood, subcontractor calibrators, and external auditors. The biggest hurdle to fixing these issues is finding a contractor to perform the work at the remote site locations. Remedial actions are prioritized by potential safety issues or data loss and then completed as soon as possible.
Infrastructure problems can affect data completeness of O3 measurements and filter pack concentrations. Data collection must meet certain criteria specific to the type of data collected for the data to be valid (see the CASTNET QAPP; Wood, 2018). Examples of problems that affect data collection and completeness include loss of power to the instruments, air conditioner and heater failures that affect shelter and bench temperature, and water damage from a leaking roof. Completeness statistics are discussed in quarterly data and QA reports. Completeness requirements are different for O3 and filter pack concentrations. Ozone design value maps require 90 percent completeness for all three years. Annual O3 concentration maps require 75 percent of daily maximum values to be available during the O3 season to meet completeness. Filter pack concentration maps require 9 out of 13 valid filter packs within a quarter for a quarterly value and 3 valid quarters for an annual value.
In summary, most of the infrastructure improvements have involved the shelter and sampling towers, including:
- sealing exterior shelter seams and rivets,
- adding shelter roofs where needed,
- restoring the inside of shelters due to roof leak damage,
- replacing damaged towers as needed, and
- providing equipment upgrades as needed.
Ozone Concentrations
CASTNET O3 data are based on rigorous QA/quality control procedures specified by the CASTNET QA Program. Hourly average concentrations were measured at 83 CASTNET sites in 2018. These data are delivered routinely to the EPA Air Quality System (AQS) database (epa.gov/aqs). Data from these sites, with the exception of Howland, ME (HOW191) and the co-located sites at MCK231, KY and ROM206, CO, which are designated as non-regulatory, are used to calculate O3 design values using fourth highest daily maximum 8-hour average (DM8A) O3 concentrations when three years of Title 40 Code of Federal Regulations (CFR) Part 58-compliant data become available. CASTNET measurements provide data to support Ozone National Ambient Air Quality Standards (NAAQS) and to assess long-term trends and geographic patterns in regional O3
The primary O3 NAAQS is designed to protect public health. The secondary standard is designed to protect public welfare and the environment. On October 1, 2015, the EPA promulgated a revision to the ozone NAAQS (2015 O3 NAAQS), lowering the level of both the primary and secondary standards to 0.070 parts per million (ppm). To attain the 2015 O3 NAAQS, the 3-year average of the fourth highest DM8A O3 concentrations measured at each monitor within a specified area must not exceed 0.070 ppm or 70 parts per billion (ppb) in practice. The 2008 O3 NAAQS remains in effect at 0.075 ppm. For this report the 2015 standard and related calculations were used. The design values for each standard can be downloaded from the EPA Design Values website.
The EPA and other federal, tribal, state, and local agencies measure hourly O3 concentrations through national and local monitoring programs. Measurements potentially affected by exceptional events, i.e., unusual or natural events that can affect air quality but are not reasonably controllable, were not removed when calculating the fourth highest DM8A values for this report.
Three-year averages of the fourth highest DM8A O3 concentrations for 2016 through 2018 are presented in Figure 2 for the 2015 NAAQS. Ozone concentrations were not included on the map if the 3-year average was not available because of incomplete data; these sites are shown as dots with no value. Table 1 lists sites with 2016–2018 O3 design values greater than 70 ppb.
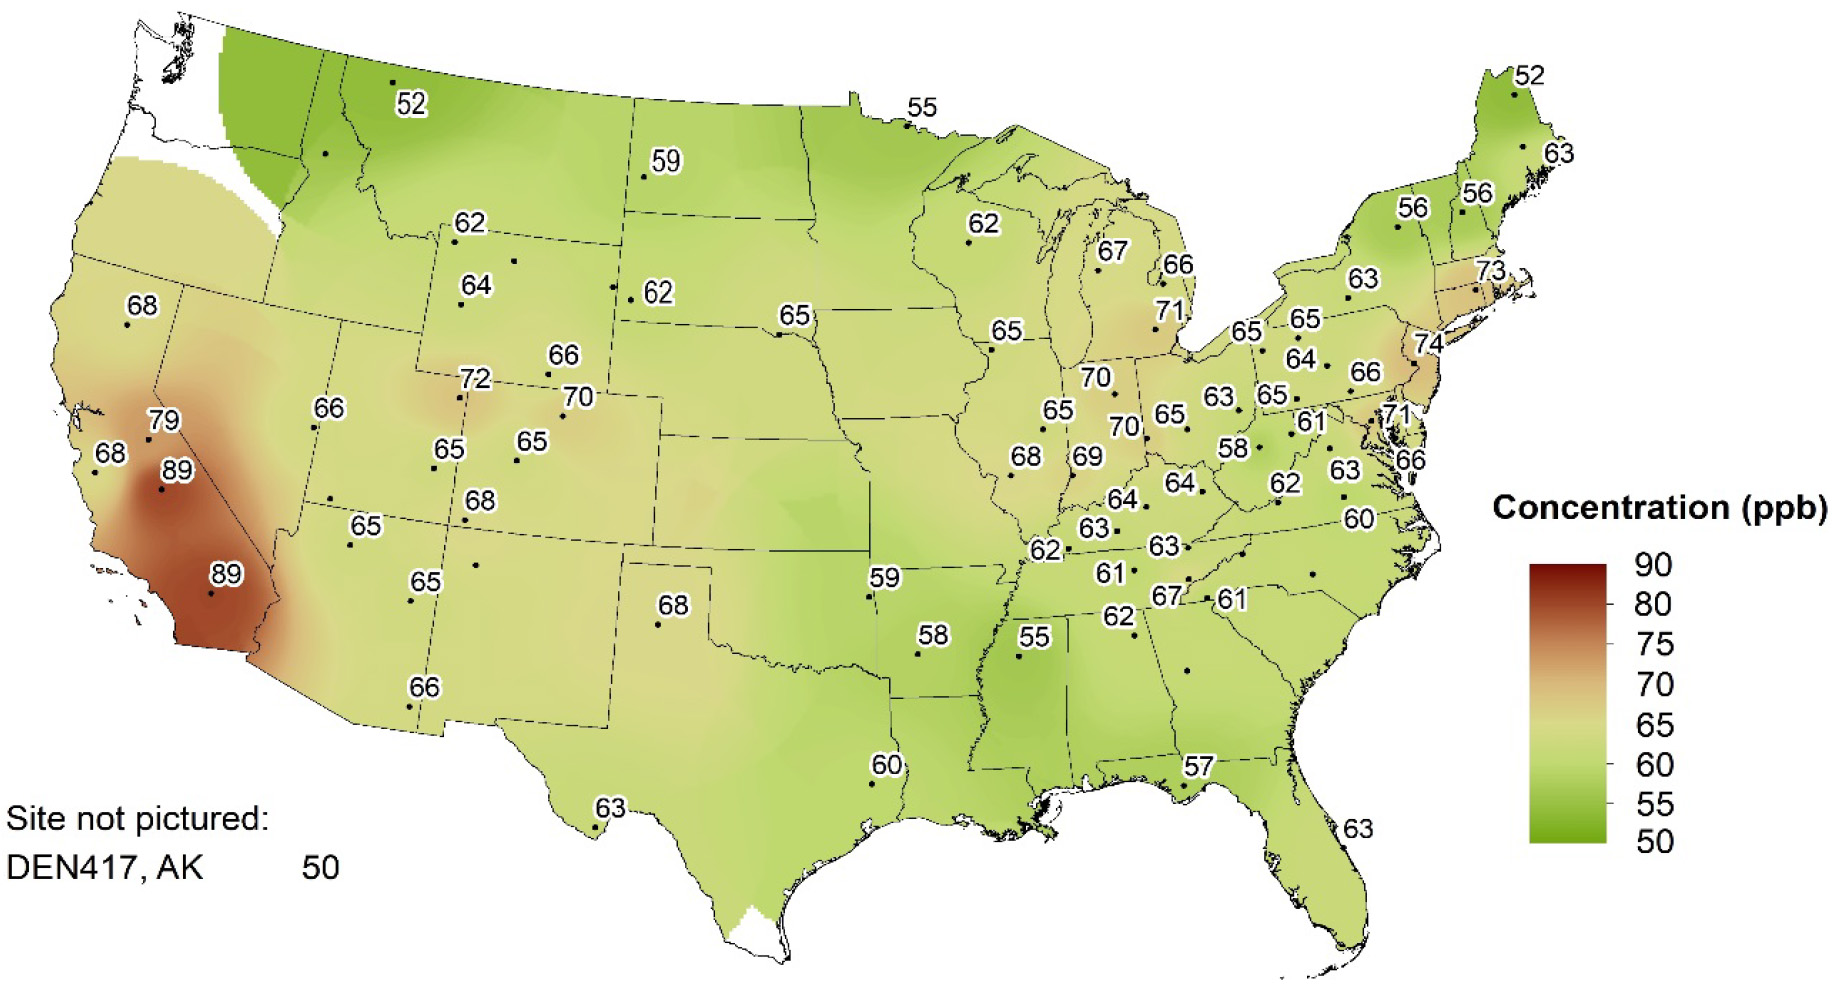
Table 1 2016–2018 O3 Design Values Greater than 70 ppb
| Site ID | State | Sponsor | 3-year Average (ppb) |
|---|---|---|---|
| JOT403 | California | NPS | 89 |
| SEK430 | California | NPS | 89 |
| YOS404 | California | NPS | 79 |
| WSP144 | New Jersey | EPA | 74 |
| ABT147 | Connecticut | EPA | 73 |
| DIN431 | Utah | NPS | 72 |
| ANA115 | Michigan | EPA | 71 |
| BEL116 | Maryland | EPA | 71 |
Figure 3 shows 2018 fourth highest DM8A O3 concentrations that met percent completeness criteria.

Figure 4 provides box plots depicting trends in 1-year mean, median, and annual distributions of fourth highest DM8A O3 concentrations from the 34 eastern reference sites (top) and for the 16 western reference sites (bottom).
Nitrogen Atmospheric Concentrations
Annual mean concentrations of total NO3- (HNO3 + NO3-), NH4+, and NH3 for 2018 are presented in three maps. Trends in annual mean concentrations of total NO3- and NH4+ over the 29-year period, 1990 through 2018, were calculated from the eastern reference sites and for the 23-year period, 1996 through 2018, from the western reference sites. Trends in NH3 were estimated from AMoN data from 2008 through 2018.
Trace-level gas analyzers measured total reactive oxides of nitrogen (NOy) at six EPA and two NPS CASTNET sites during 2018. These are presented at the end of this section.
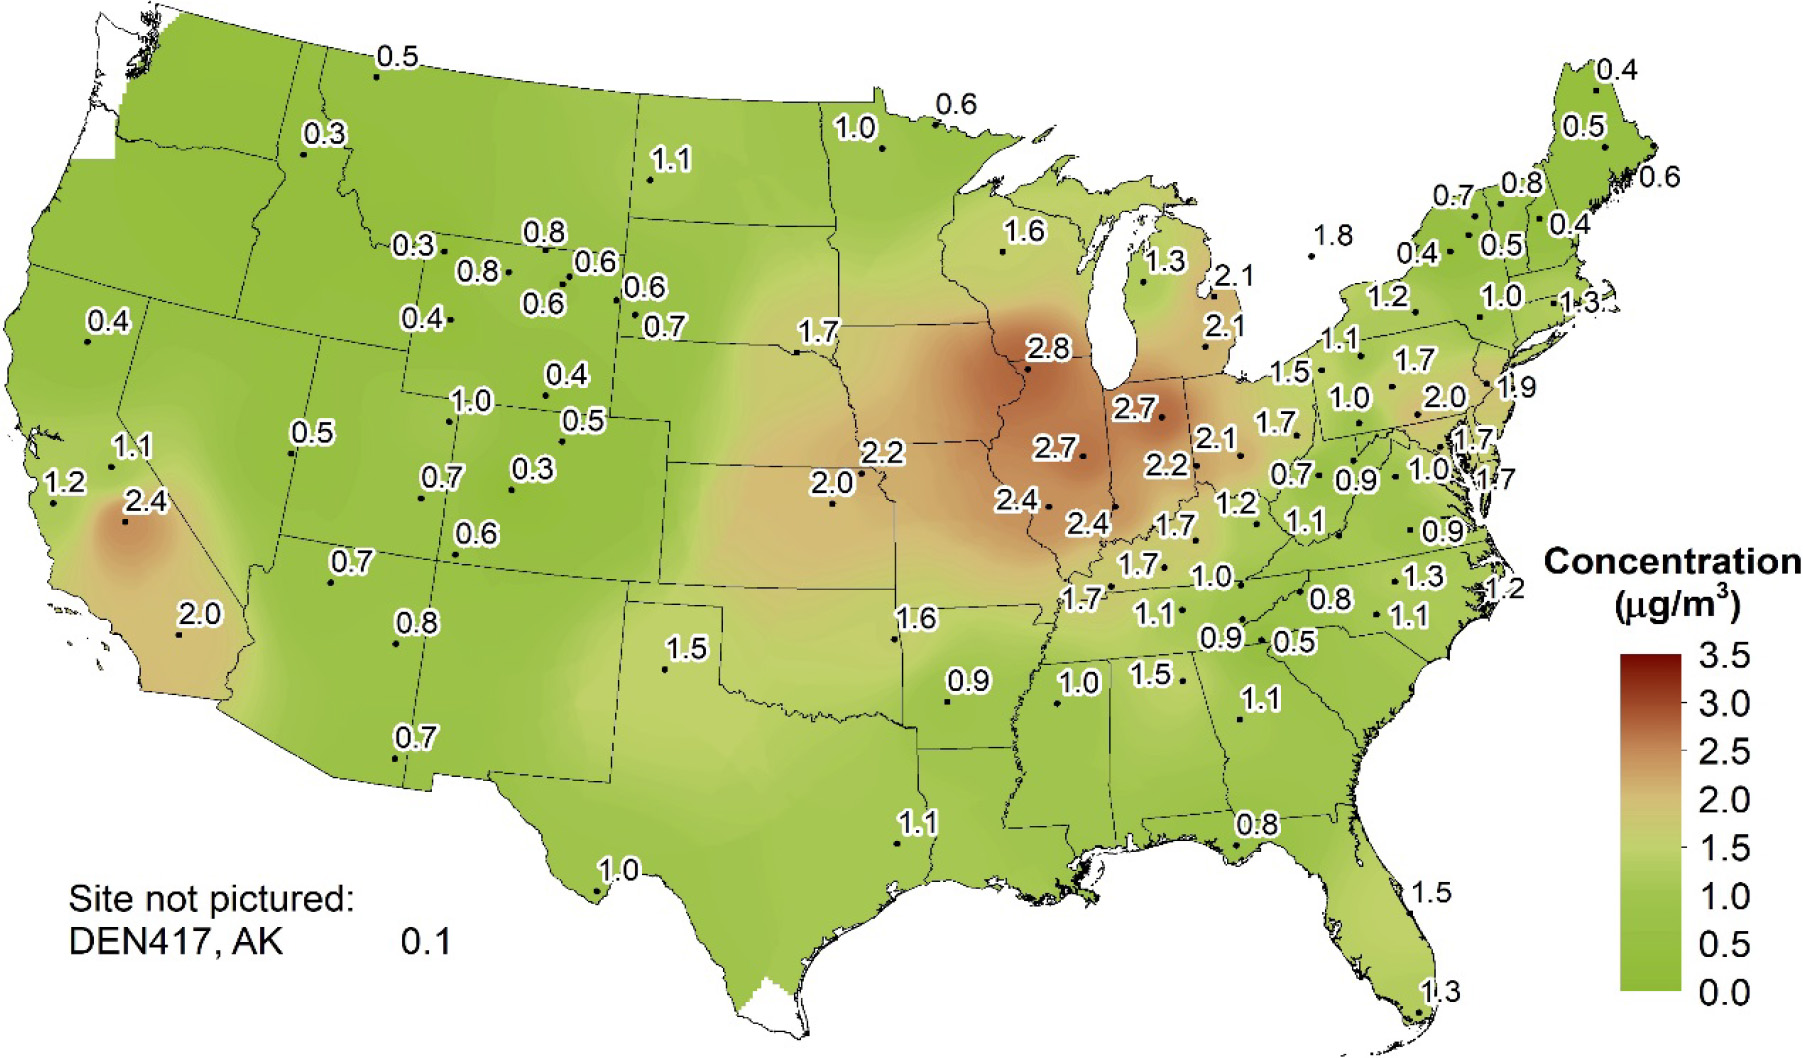
Total Nitrate Concentrations
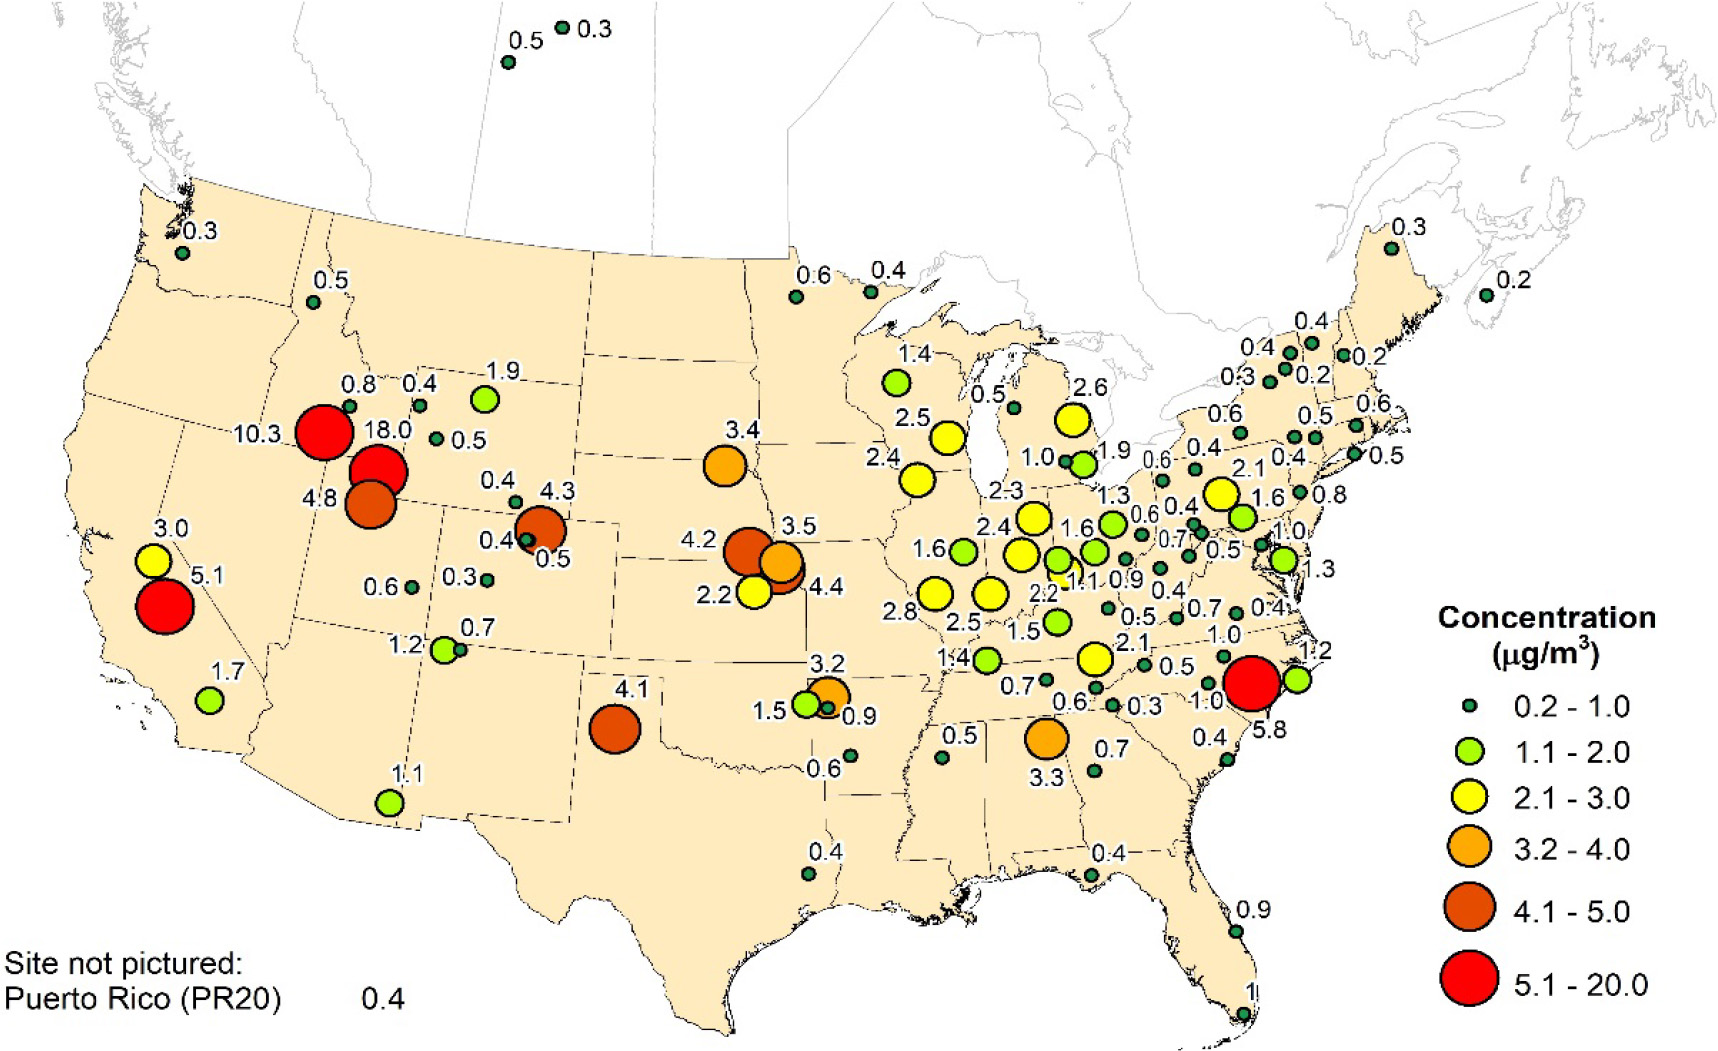
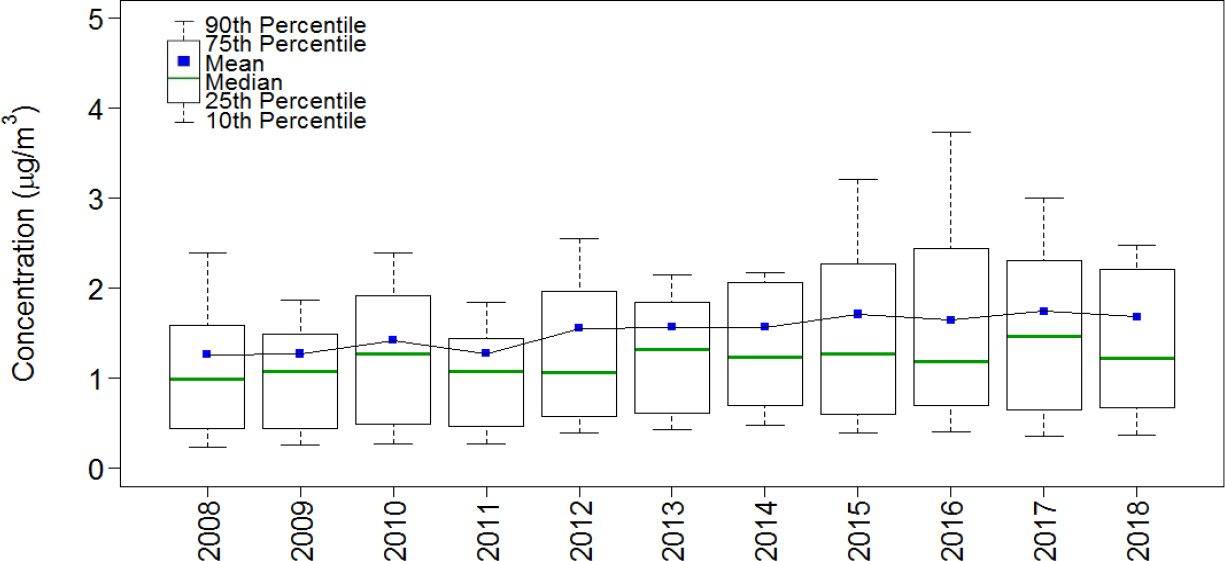
Mean total NO3- concentrations measured in 2018 are presented in the map in Figure 5. To illustrate trends, Figure 6 provides box plots of total NO3- levels for the eastern and western reference sites through 2018.

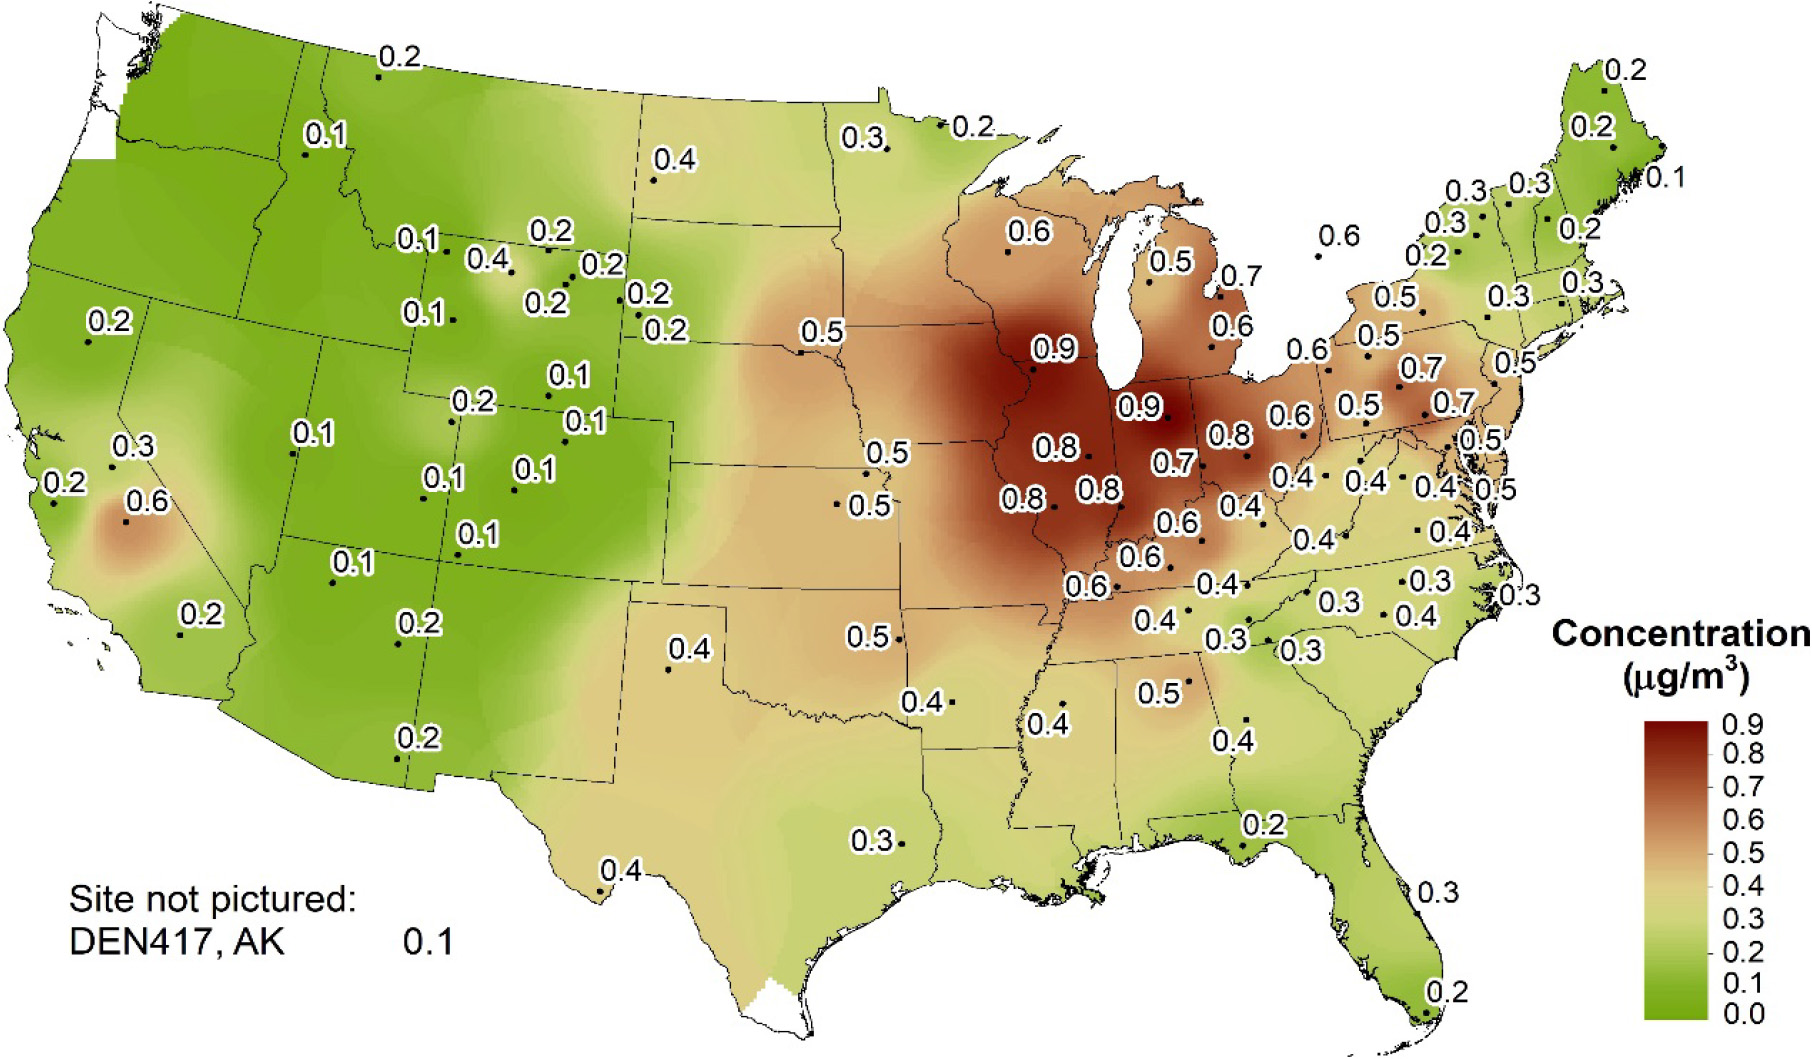
Particulate Ammonium Concentrations
A map of 2018 mean particulate NH4+ concentrations is provided in Figure 7. Figure 8 shows box plots of NH4+ concentrations.
Ammonia Concentrations
Average annual NH3 concentrations for 2018 for AMoN sites that met completeness requirements are mapped in Figure 9. Trends are shown in Figure 10.
Continuous Trace-level NOy and Filter Pack Total Nitrate Concentrations
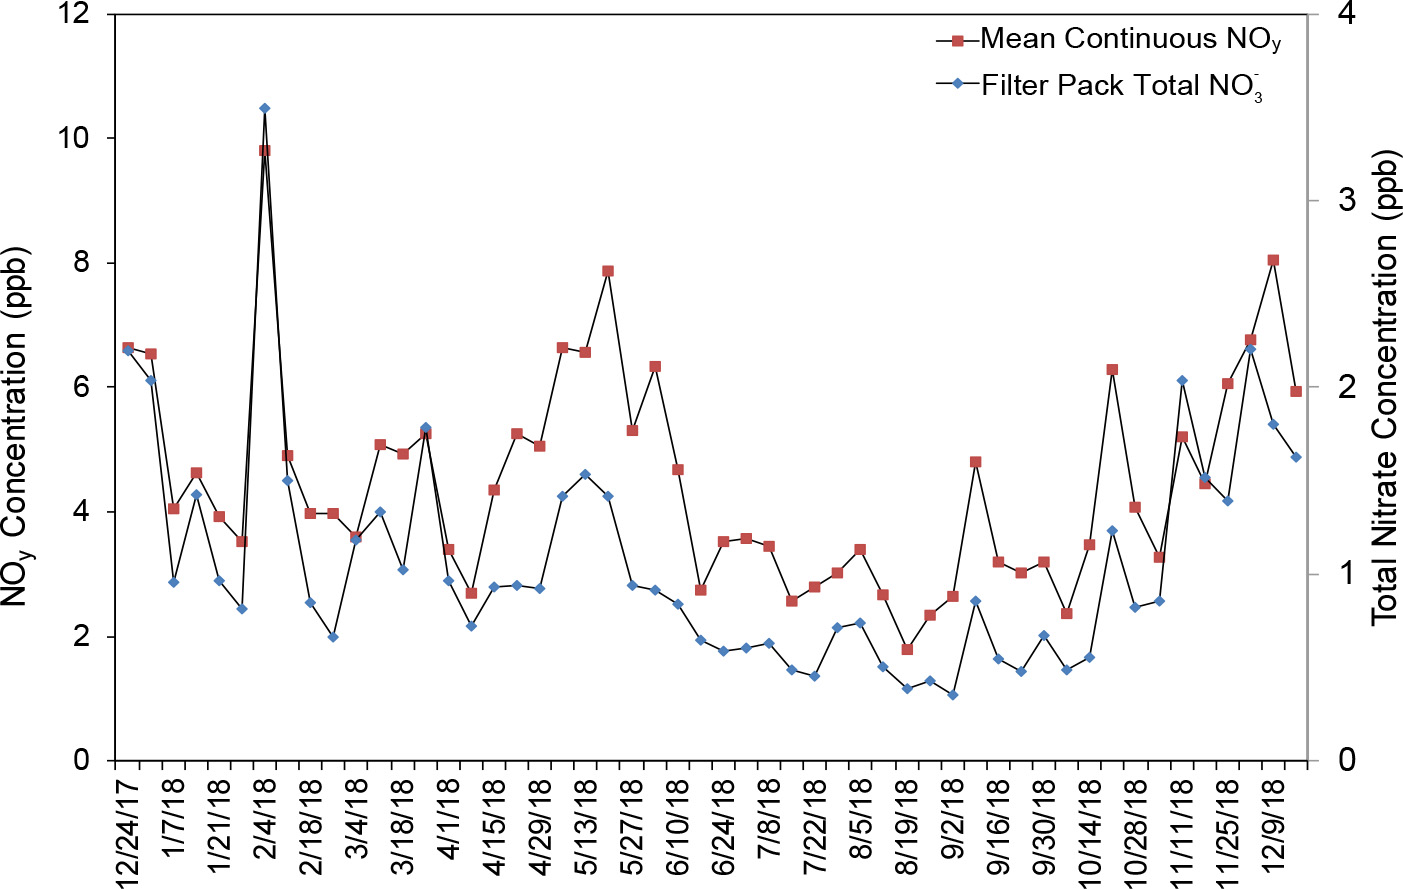
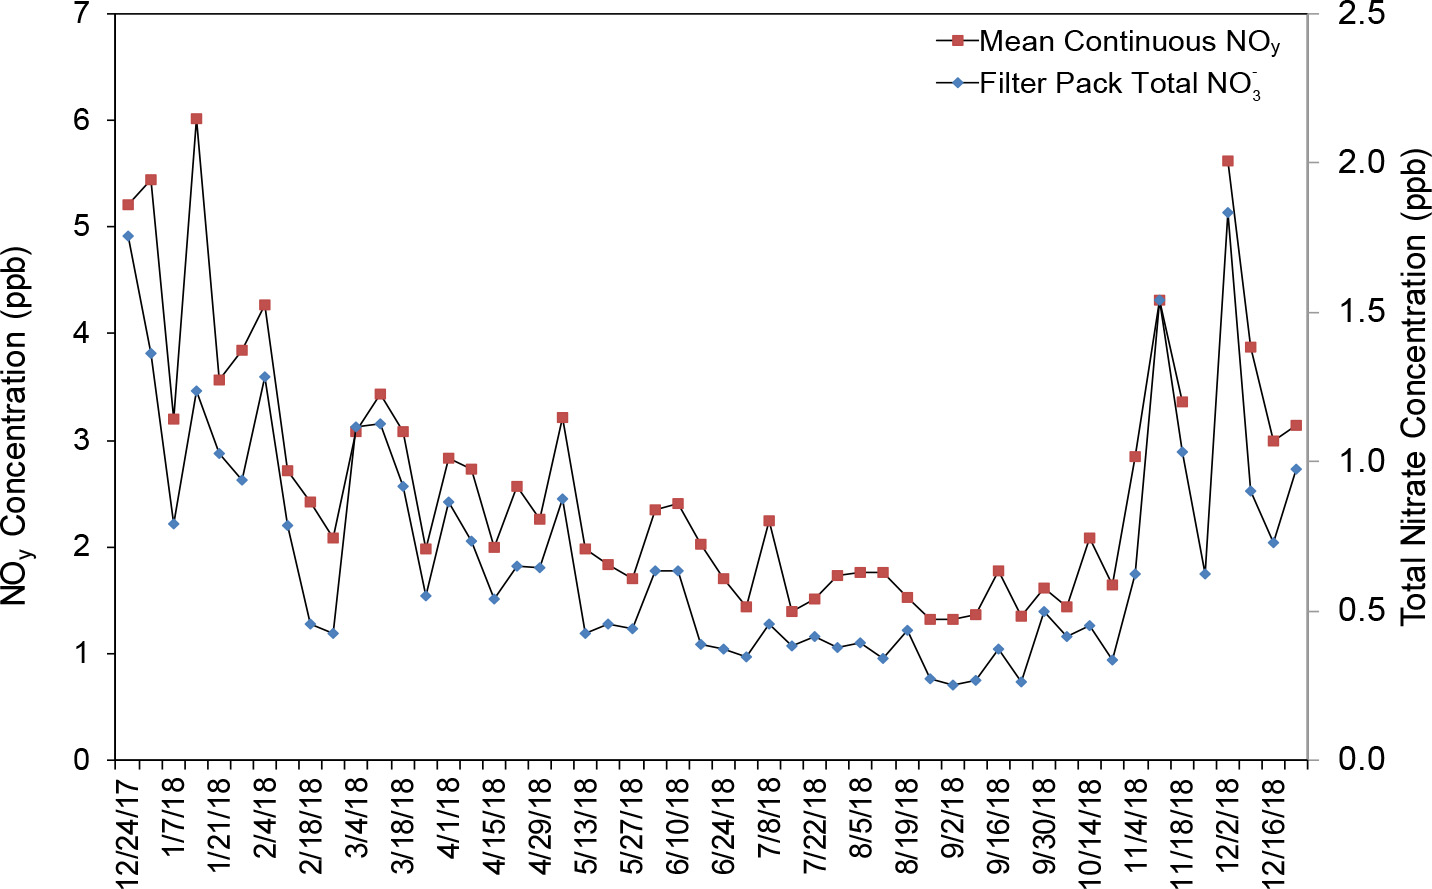
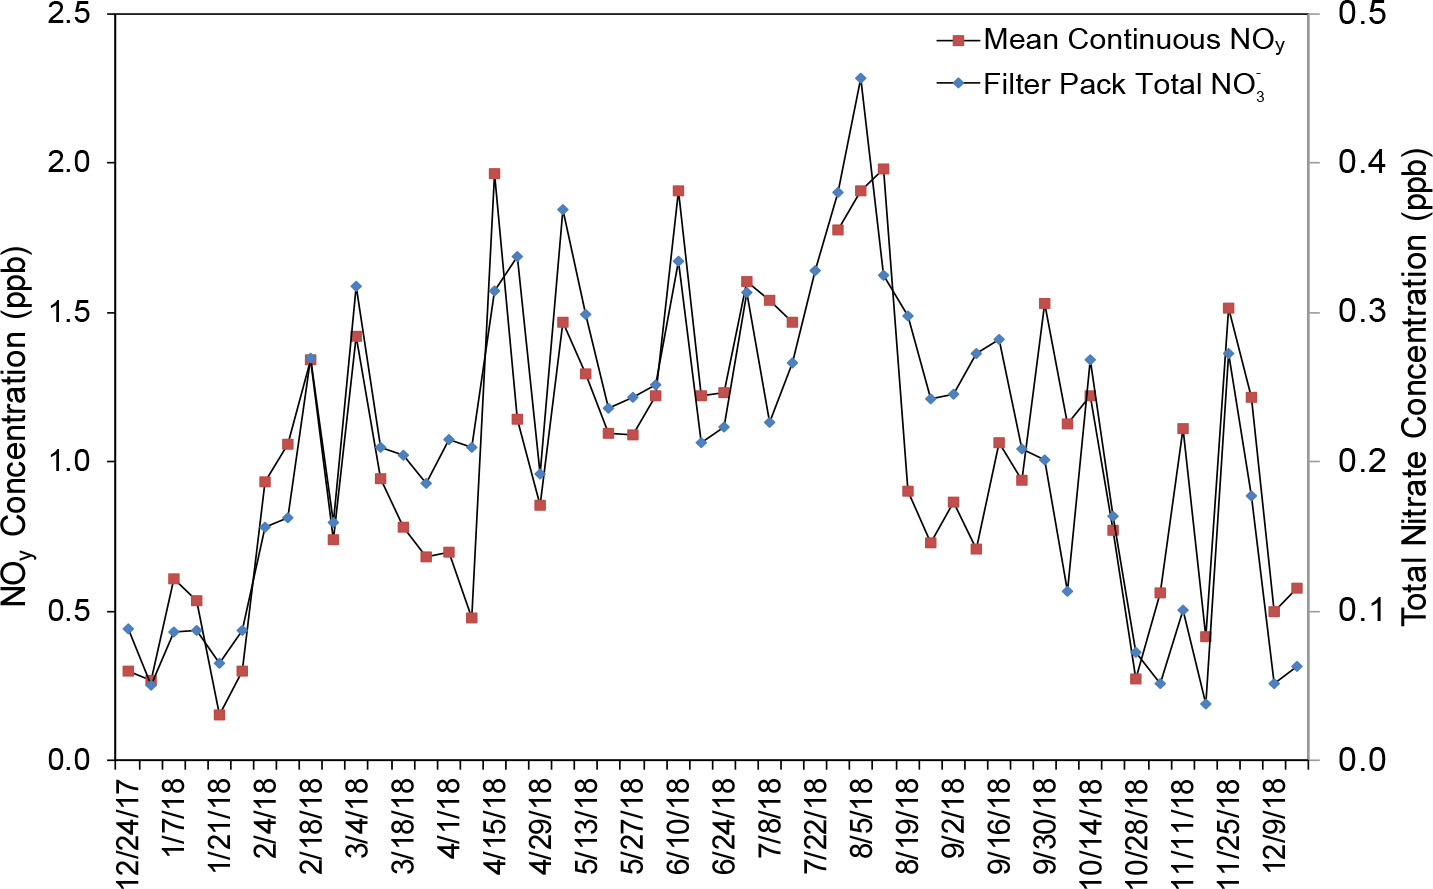
HNO3 and particulate NO3- are measured on CASTNET filter packs, and the sum is reported as total NO3-. NOy is defined as NOx (NO + nitrogen dioxide) plus NOz (HNO3, nitrous acid, peroxyacetyl nitrate, peroxyproyl nitrate, other organic nitrates, and nitrite). It consists of reactive gases that are considered precursors of O3 and fine particulate matter (PM2.5). Because HNO3 and particulate NO3- are measured as components of NOy, NOy concentrations should always be higher than total NO3- levels (i.e., the ratio of NOy to total NO3- should always be greater than 1.0). A comparison of weekly mean continuous NOy concentrations with filter pack total NO3- levels at BVL130, IL; MAC426, KY; and ROM206, CO for 2018 was used to evaluate the 2018 measurements (Figures 11 through 13). The scales for NOy and total NO3- levels are different in the three figures. The NOy concentrations were consistently higher than the total NO3- levels, as expected. The results are similar for the other five sites. The weekly total NO3- concentrations, the average weekly NOy levels, and their ratios are listed in Table 2. These were calculated as the average of all valid weekly filter pack concentrations, the average of mean NOy values matching the run time of the weekly filter packs, and the average of the ratios calculated for each week.
Figure 11 Comparison of BVL130, IL Weekly Mean Continuous Trace-level NOy and Filter Pack Total NO3- Concentrations
 Download Figure
Figure 12 Comparison of MAC426, KY Weekly Mean Continuous Trace-level NOy and Filter Pack Total NO3- Concentrations
 Download Figure
Figure 13 Comparison of ROM206, CO Weekly Mean Continuous Trace-level NOy and Filter Pack Total NO3- Concentrations
 Download Figure
Table 2 Summary of Total NO3- and NOy Measurements for 2018
| Site Location | Elevation (m) | Total NO (ppb) | NOy (ppb) | Ratio |
|---|---|---|---|---|
| DUK008, NC* | 164 | 0.51 | 2.92 | 5.74 |
| BVL130, IL | 213 | 1.06 | 4.49 | 4.66 |
| MAC426, KY | 243 | 0.69 | 2.61 | 4.03 |
| HWF187, NY | 497 | 0.19 | 0.8 | 4.74 |
| GRS420, TN | 793 | 0.4 | 1.5 | 3.61 |
| PNF126, NC | 1216 | 0.3 | 1.11 | 4.14 |
| PND165, WY | 2386 | 0.15 | 0.57 | 4.15 |
| ROM206, CO | 2742 | 0.21 | 1.02 | 5.35 |
Note:
*Enhanced NOy monitor located at the top of the 30-m tower
Sulfur Atmospheric Concentrations
Annual mean concentrations of SO2 and SO42- for 2018 are presented in Figures 14 and 16, respectively. Trends in annual mean concentrations of SO2 and SO42- for 2018 are also shown in Figures 15 and 17, respectively. The Basin, WY (BAS601) site (Figure 1) measured unexpectedly high SO2 concentrations during fourth quarter 2017. High concentrations persisted through first quarter 2018 and then returned to levels more consistent with the other Wyoming CASTNET sites. The high concentration measured during the first quarter affected the annual mean concentration for BAS601 shown in Figure 14.
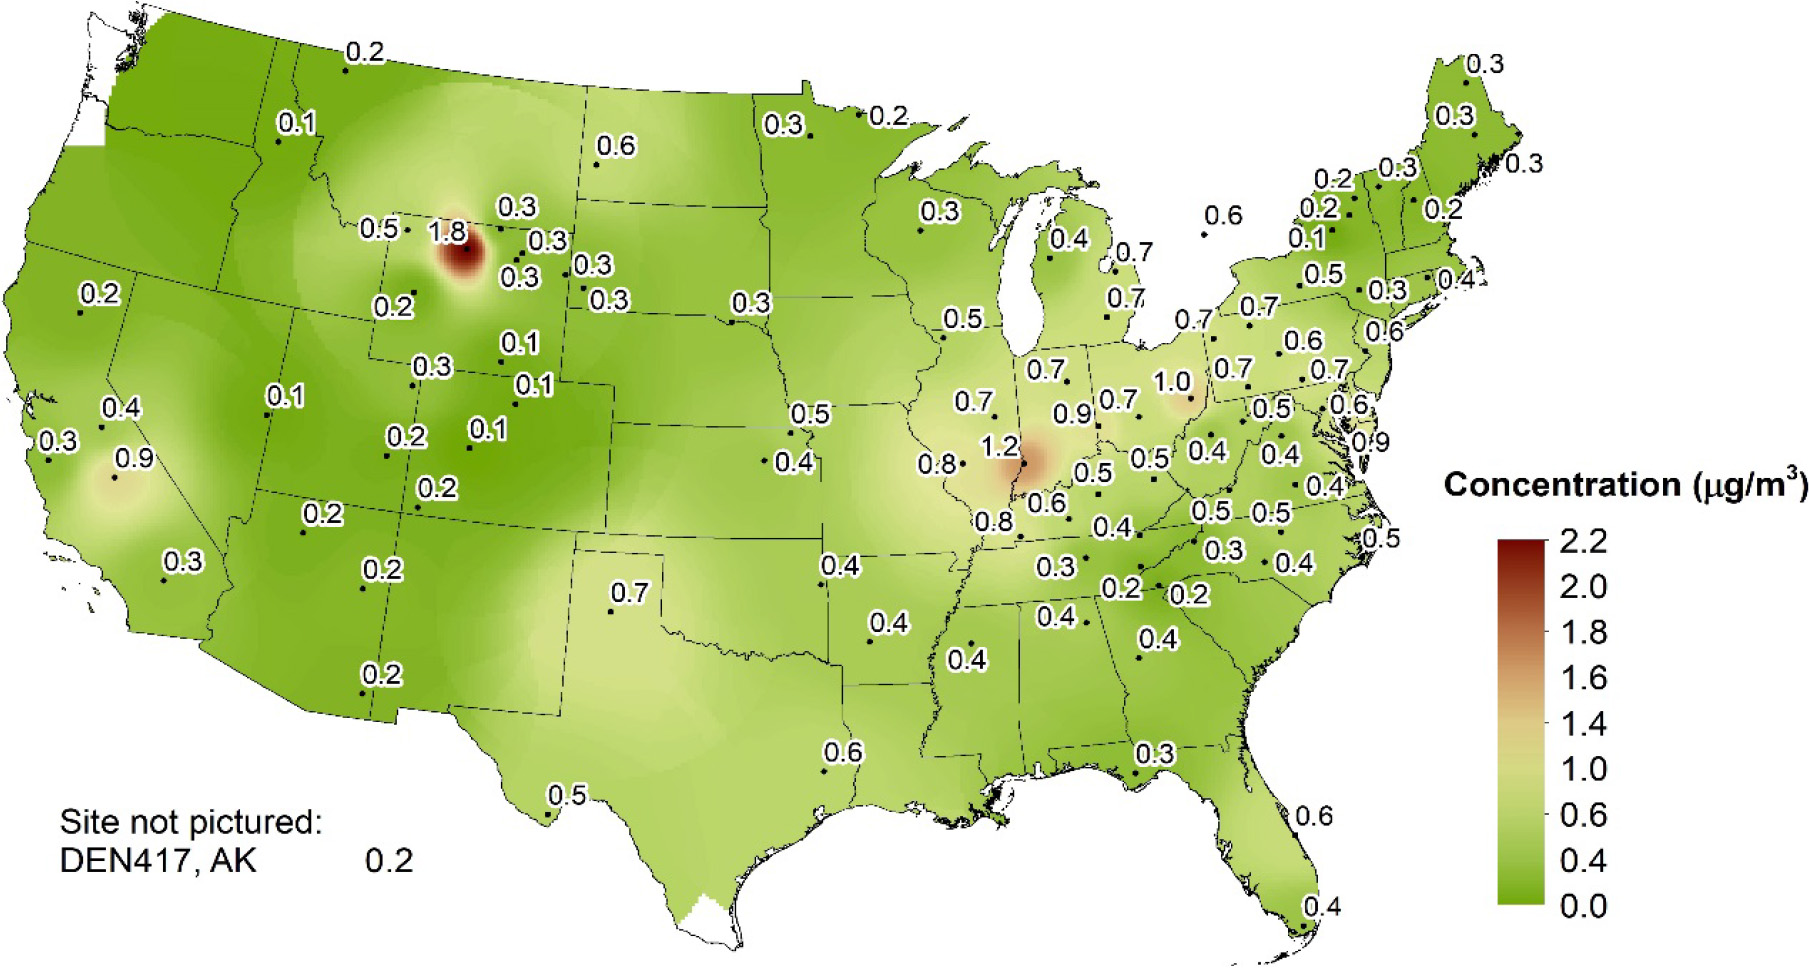
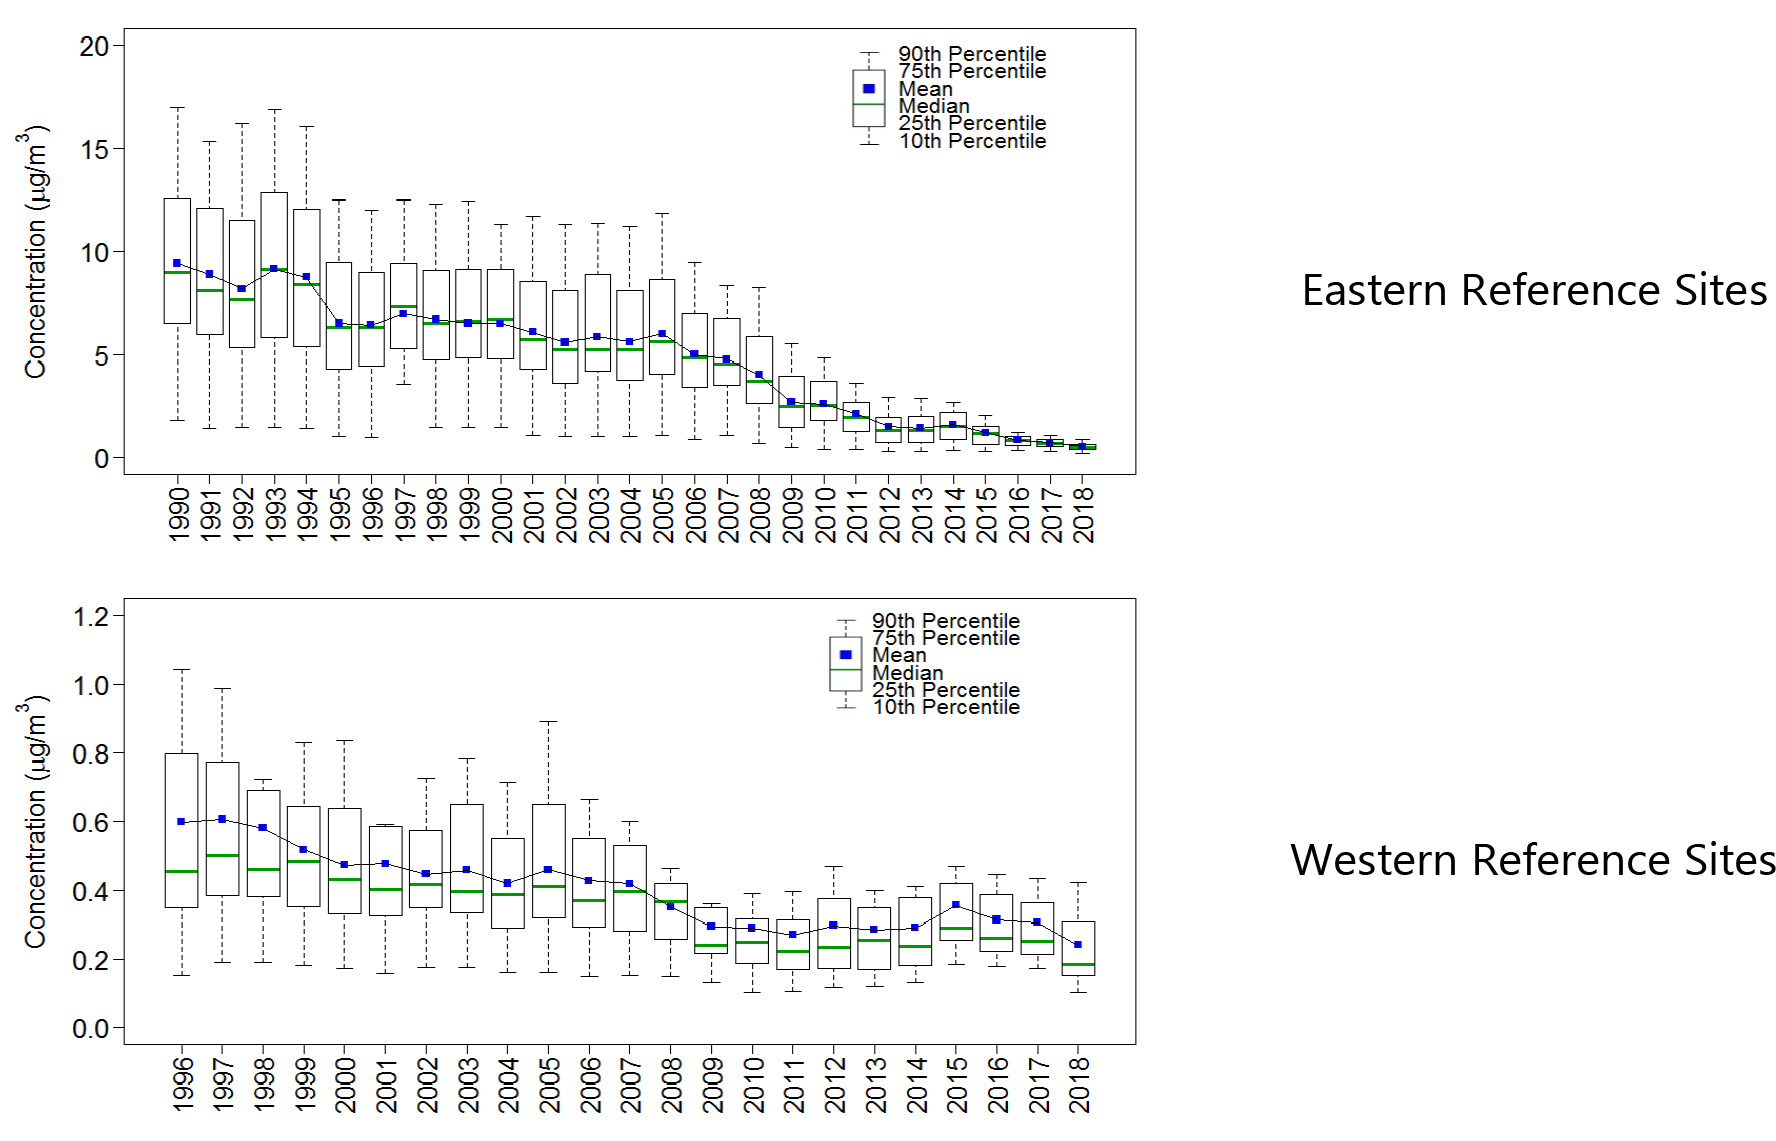
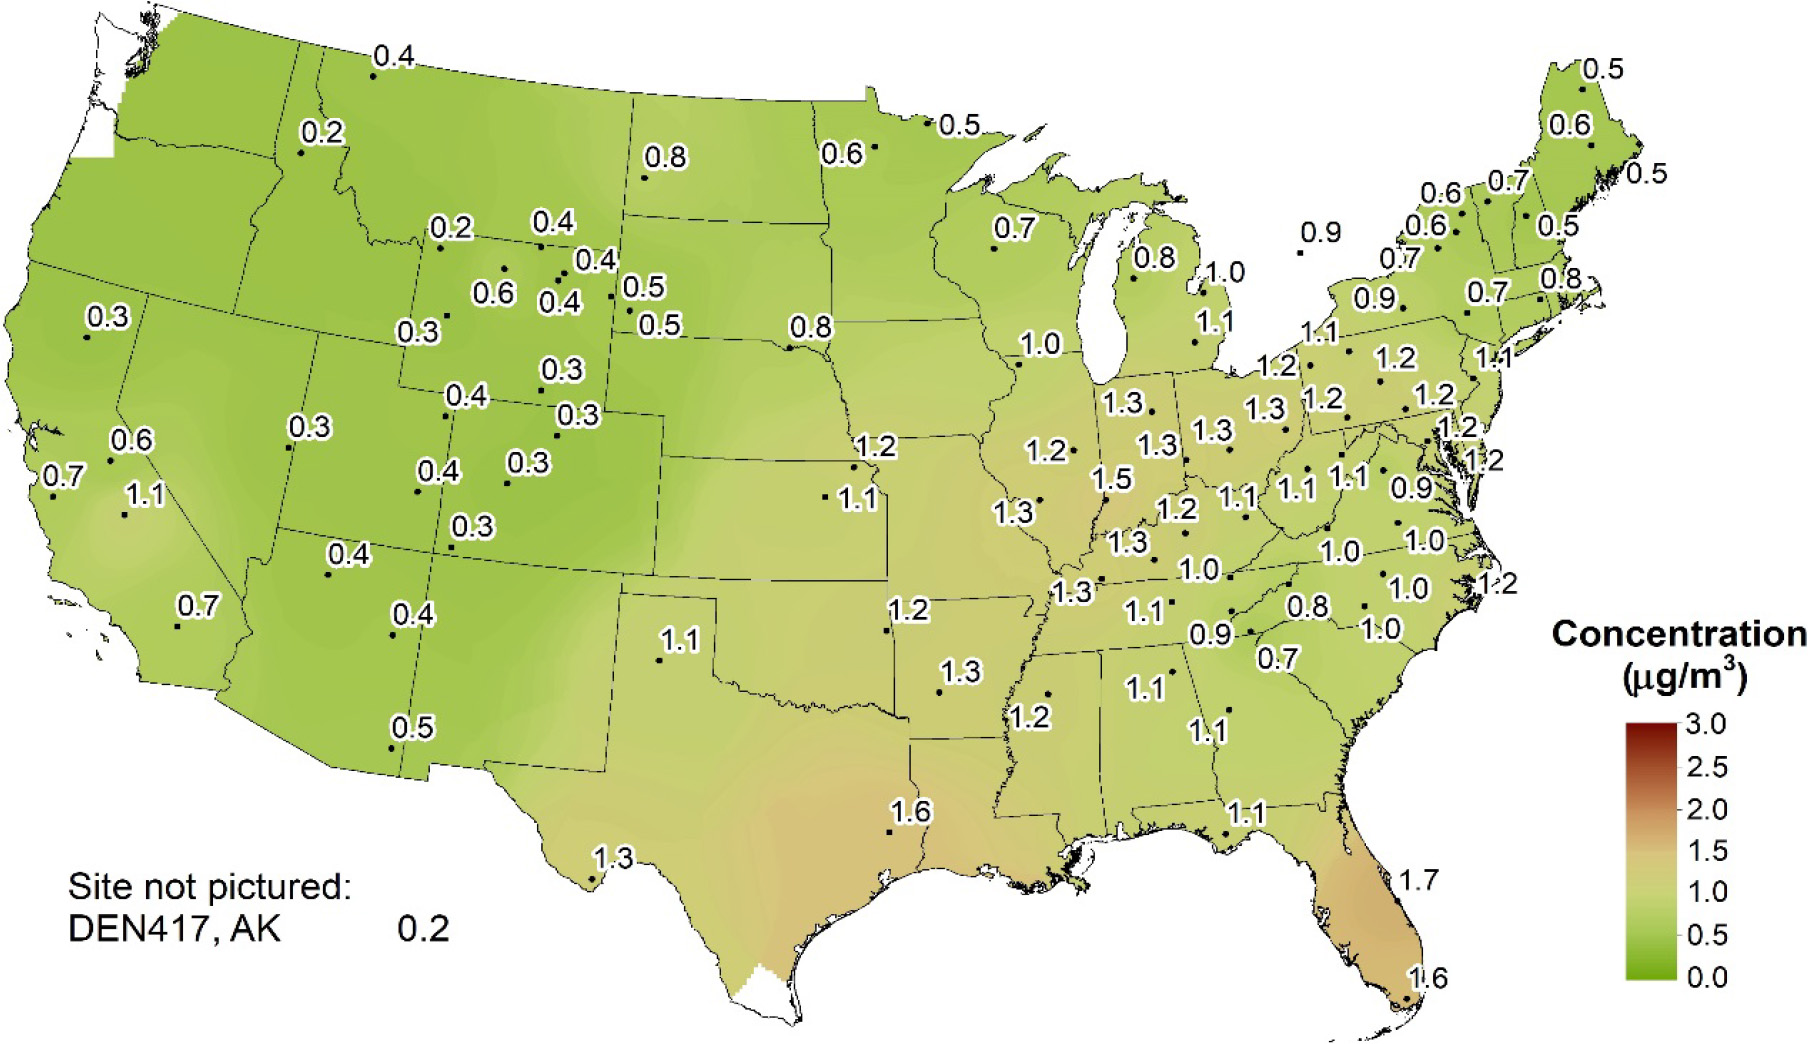
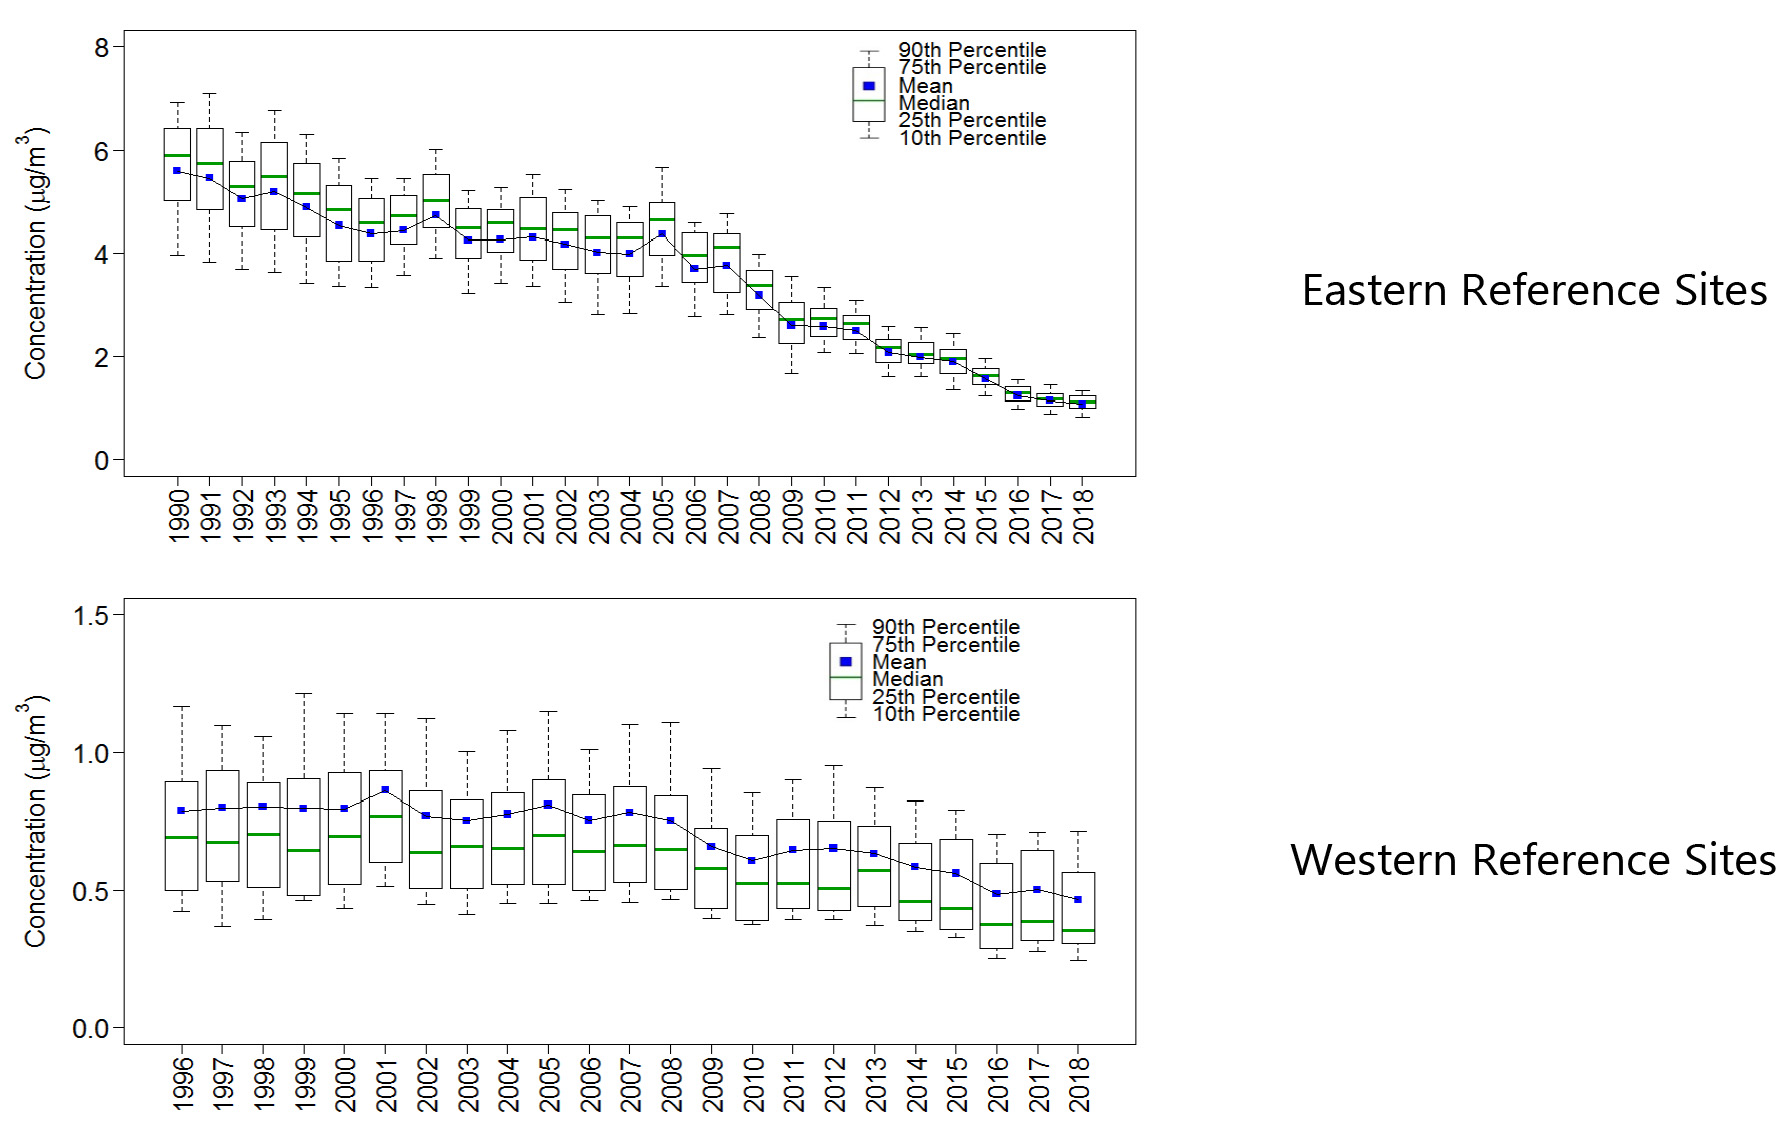
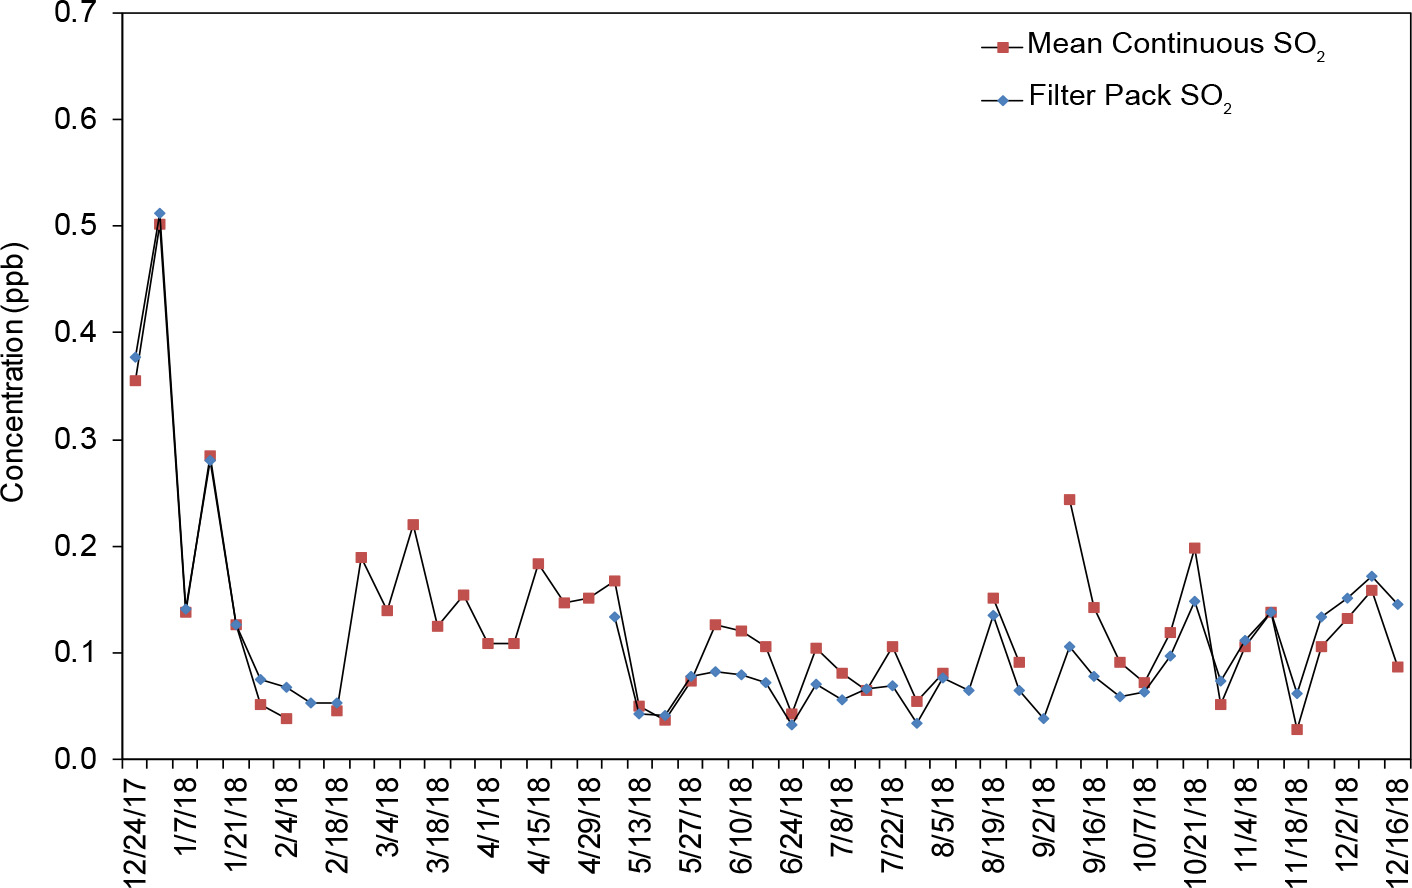
Figure 18 provides a diagram that compares weekly filter pack SO2 concentrations with continuous tracelevel gas data measured at Great Smoky Mountains National Park, TN (GRS420). The continuously measured trace-level concentrations were comparable to the filter pack concentrations.
Atmospheric Deposition
Gaseous and particulate nitrogen, sulfur, and other trace pollutants are deposited to the environment through dry and wet atmospheric processes. A primary goal of CASTNET is to estimate the dry deposition of pollutants from the atmosphere to sensitive ecosystems. The NADP Total Deposition (TDep) measurement-model fusion technique (Schwede and Lear, 2014) combines CASTNET monitoring data with output from the Community Multiscale Air Quality (CMAQ) modeling system (Byun and Schere, 2006) to estimate dry deposition. The TDep method uses measurement data from air quality monitoring sites when available and CMAQ output in areas where monitoring data are not available. CMAQ also provides modeled data for species that are not routinely measured. TDep and its recent updates are discussed on the TDep web page. See also the NADP Fact Sheet, “Hybrid Approach to Mapping Total Deposition”.
For wet deposition, the TDep method combines precipitation amounts measured at NADP/NTN sites with a Parameter-elevation Regressions on Independent Slopes Model (PRISM) modeled grid of precipitation data to develop a continuous grid of precipitation data. PRISM uses terrain elevation, slope, and aspect and climatic measurements to estimate precipitation. Pollutant concentrations in precipitation are measured by NADP/NTN, extrapolated into a grid using an inverse distance weighting algorithm, and then multiplied by the combined precipitation grid to generate estimates of wet deposition. For 2018, dry and wet deposition rates were added to obtain estimates of total deposition of nitrogen, sulfur, base cations, and Cl -, which are presented on the maps in this section as kilograms per hectare per year (kg ha-1 yr-1 ).
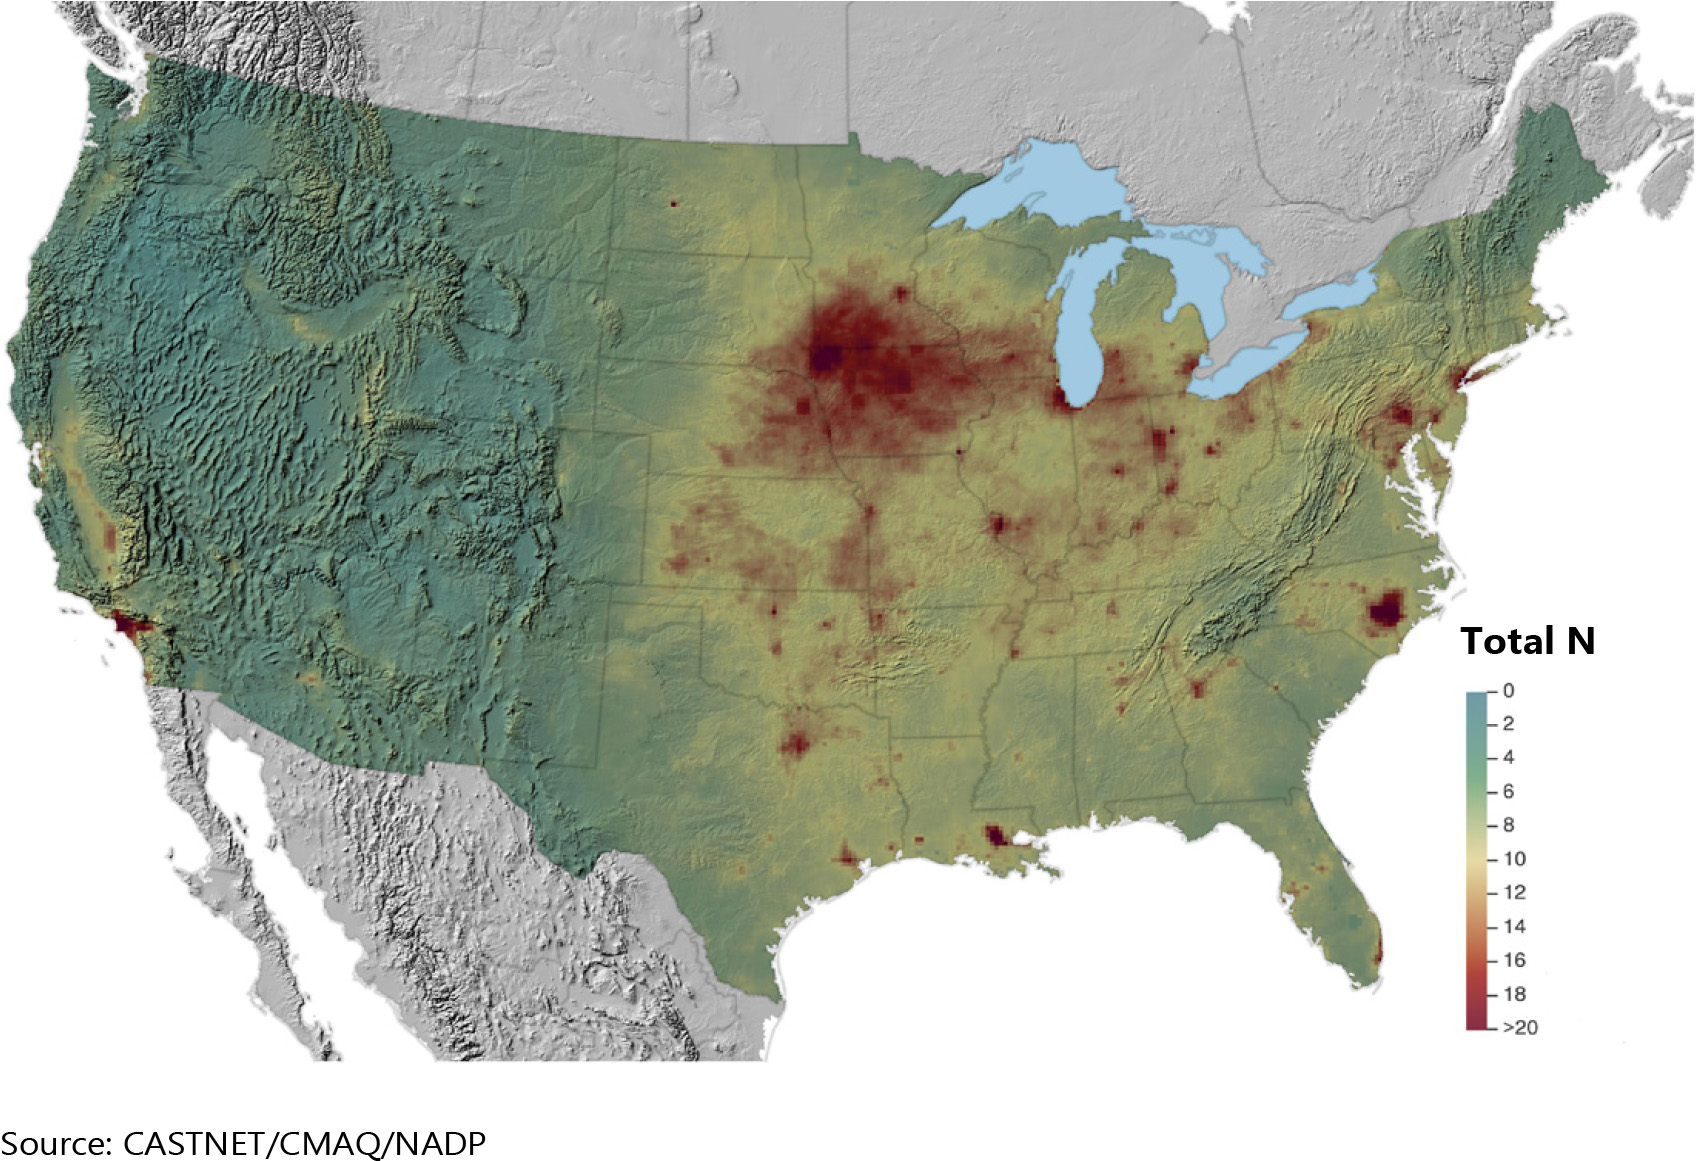
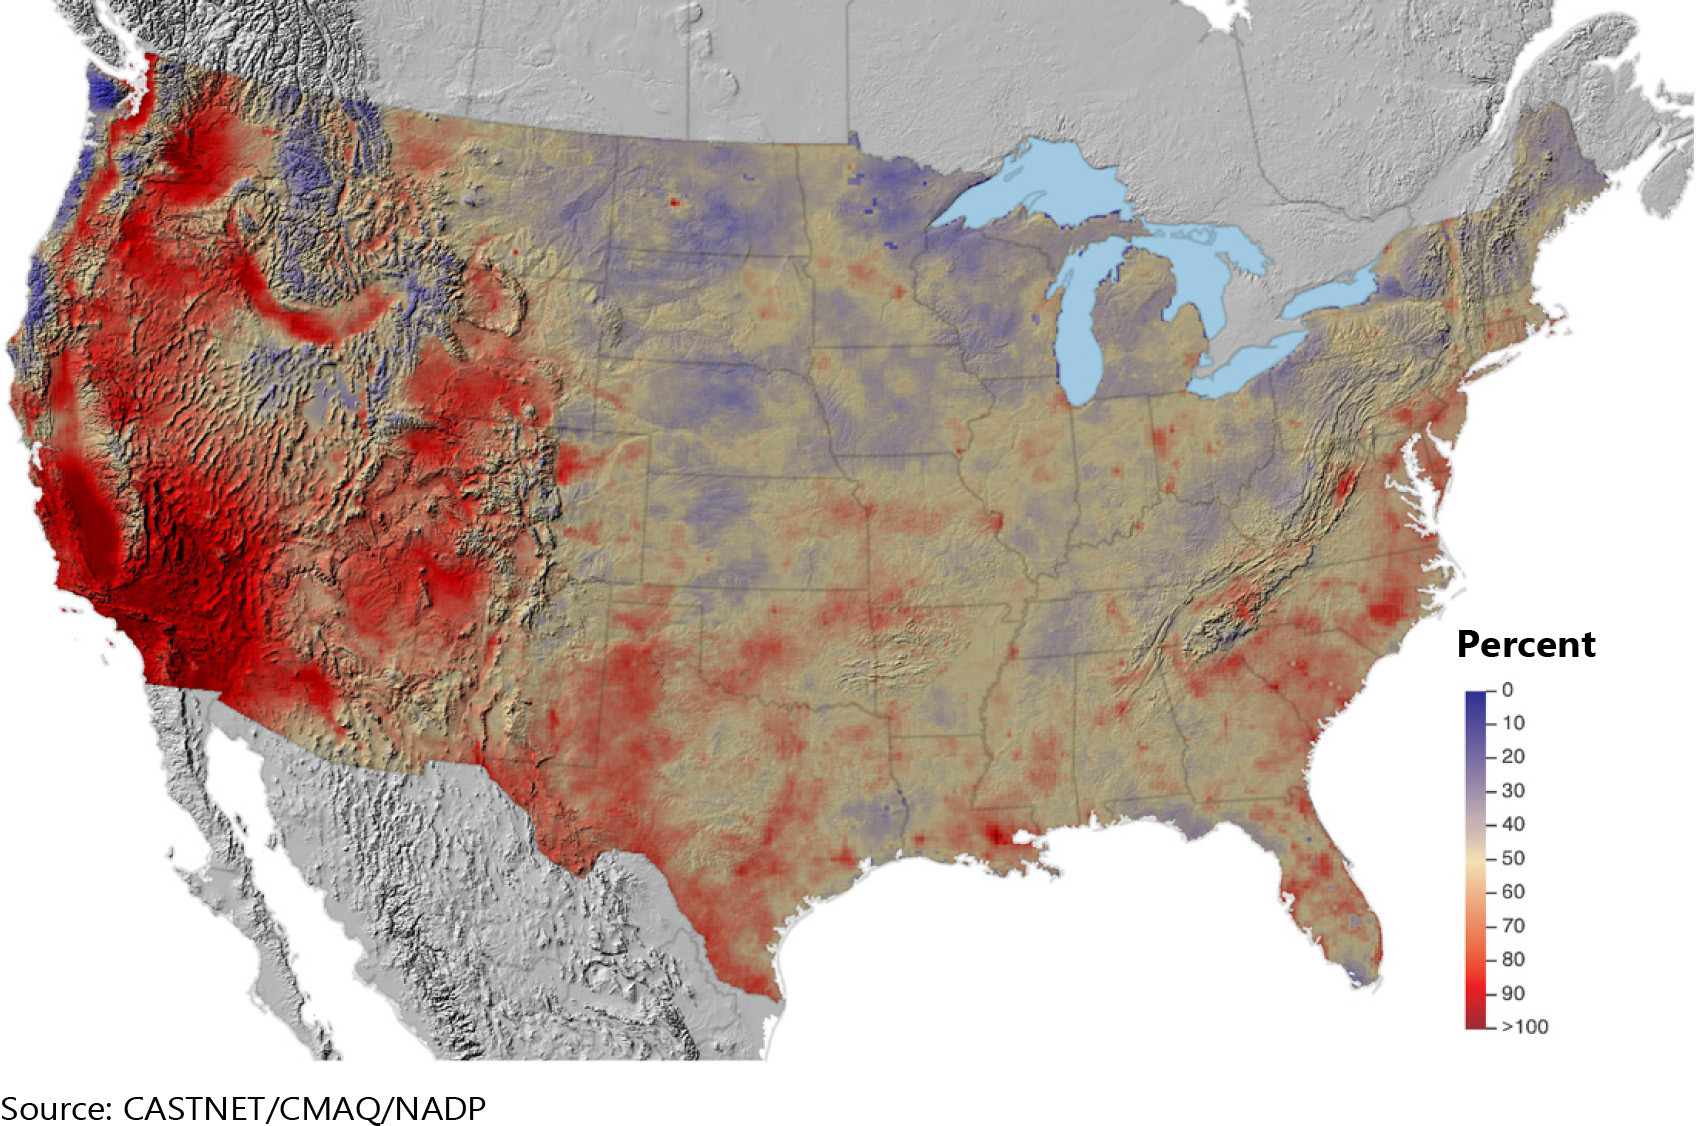
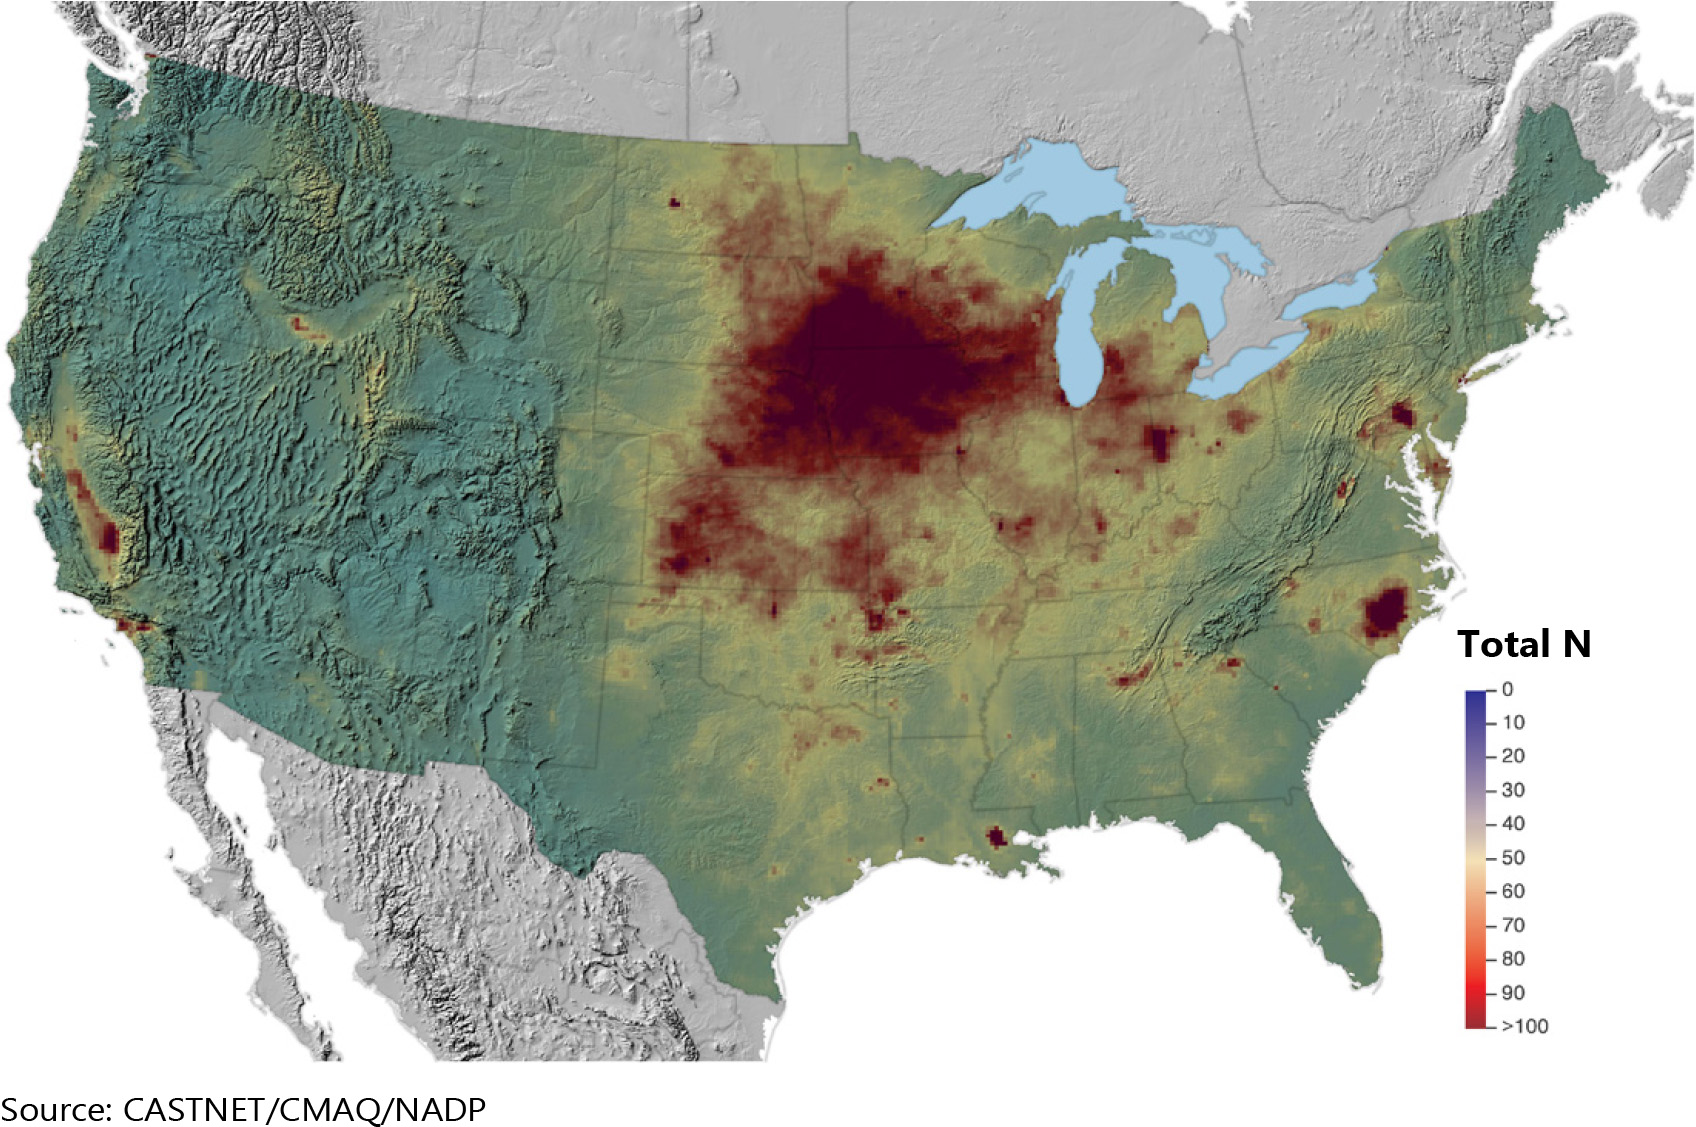
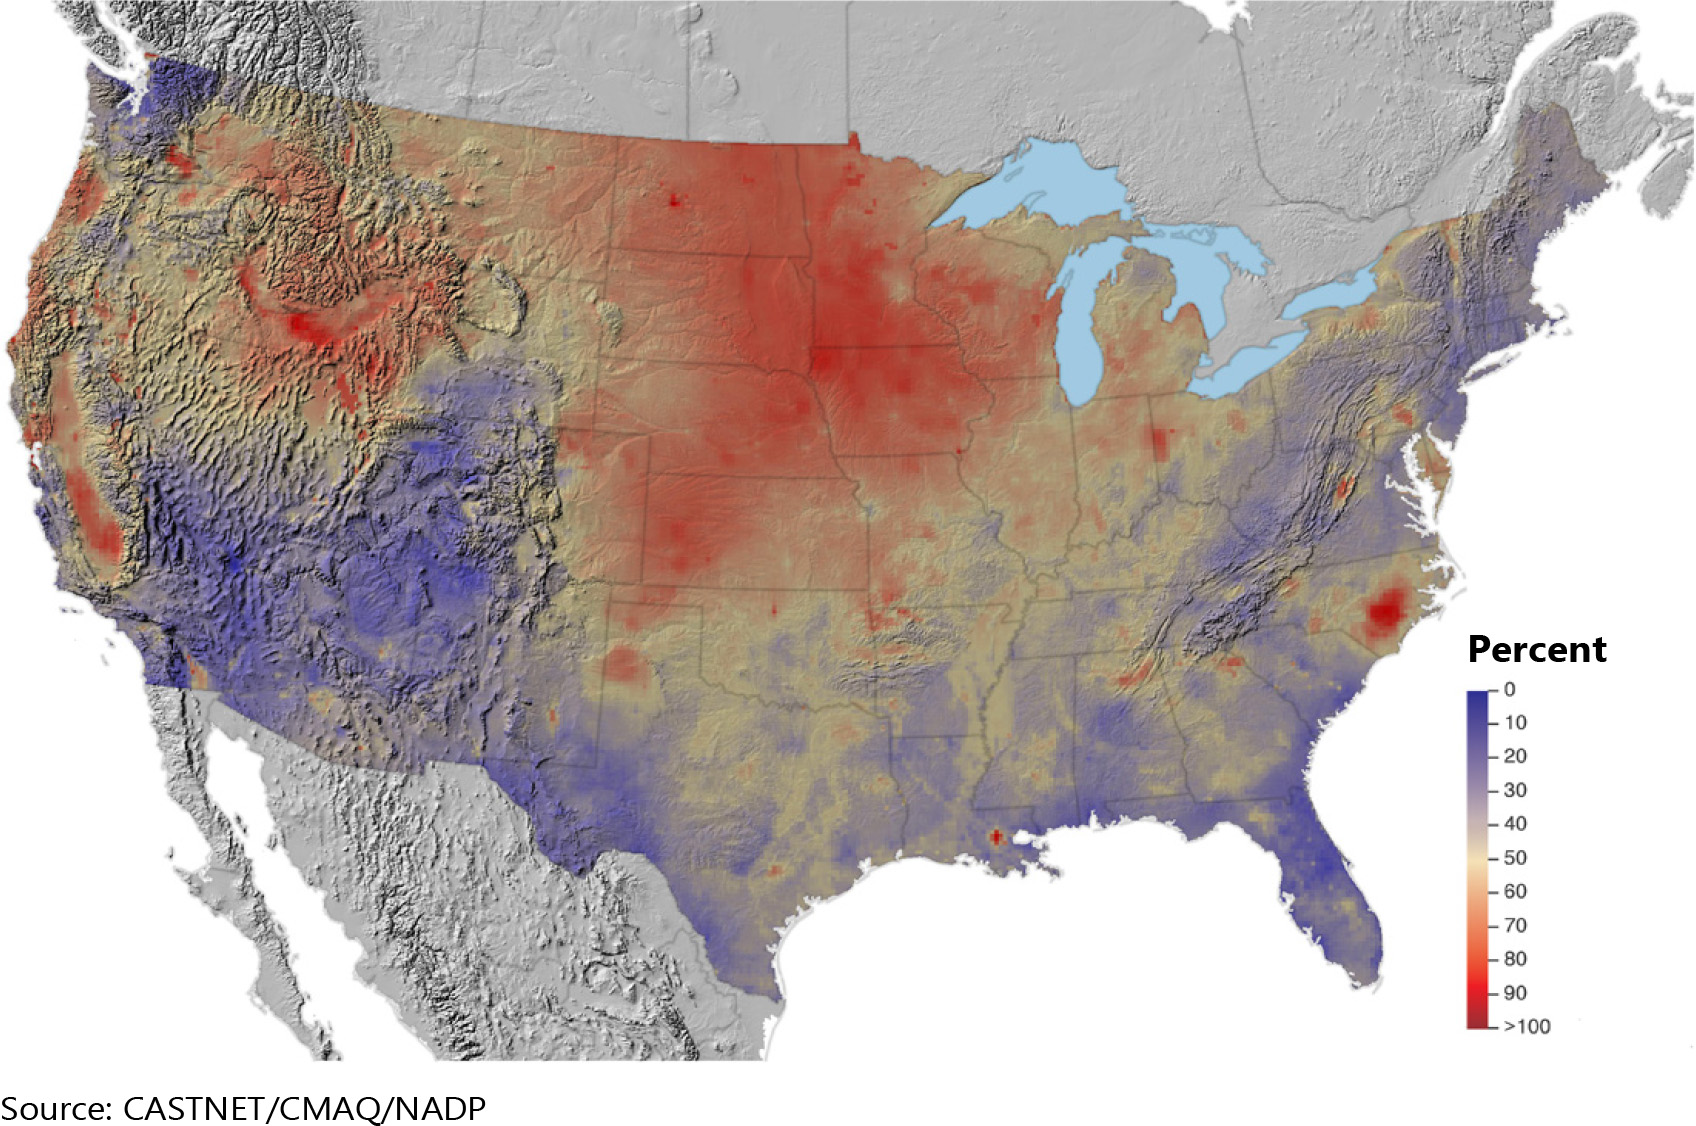
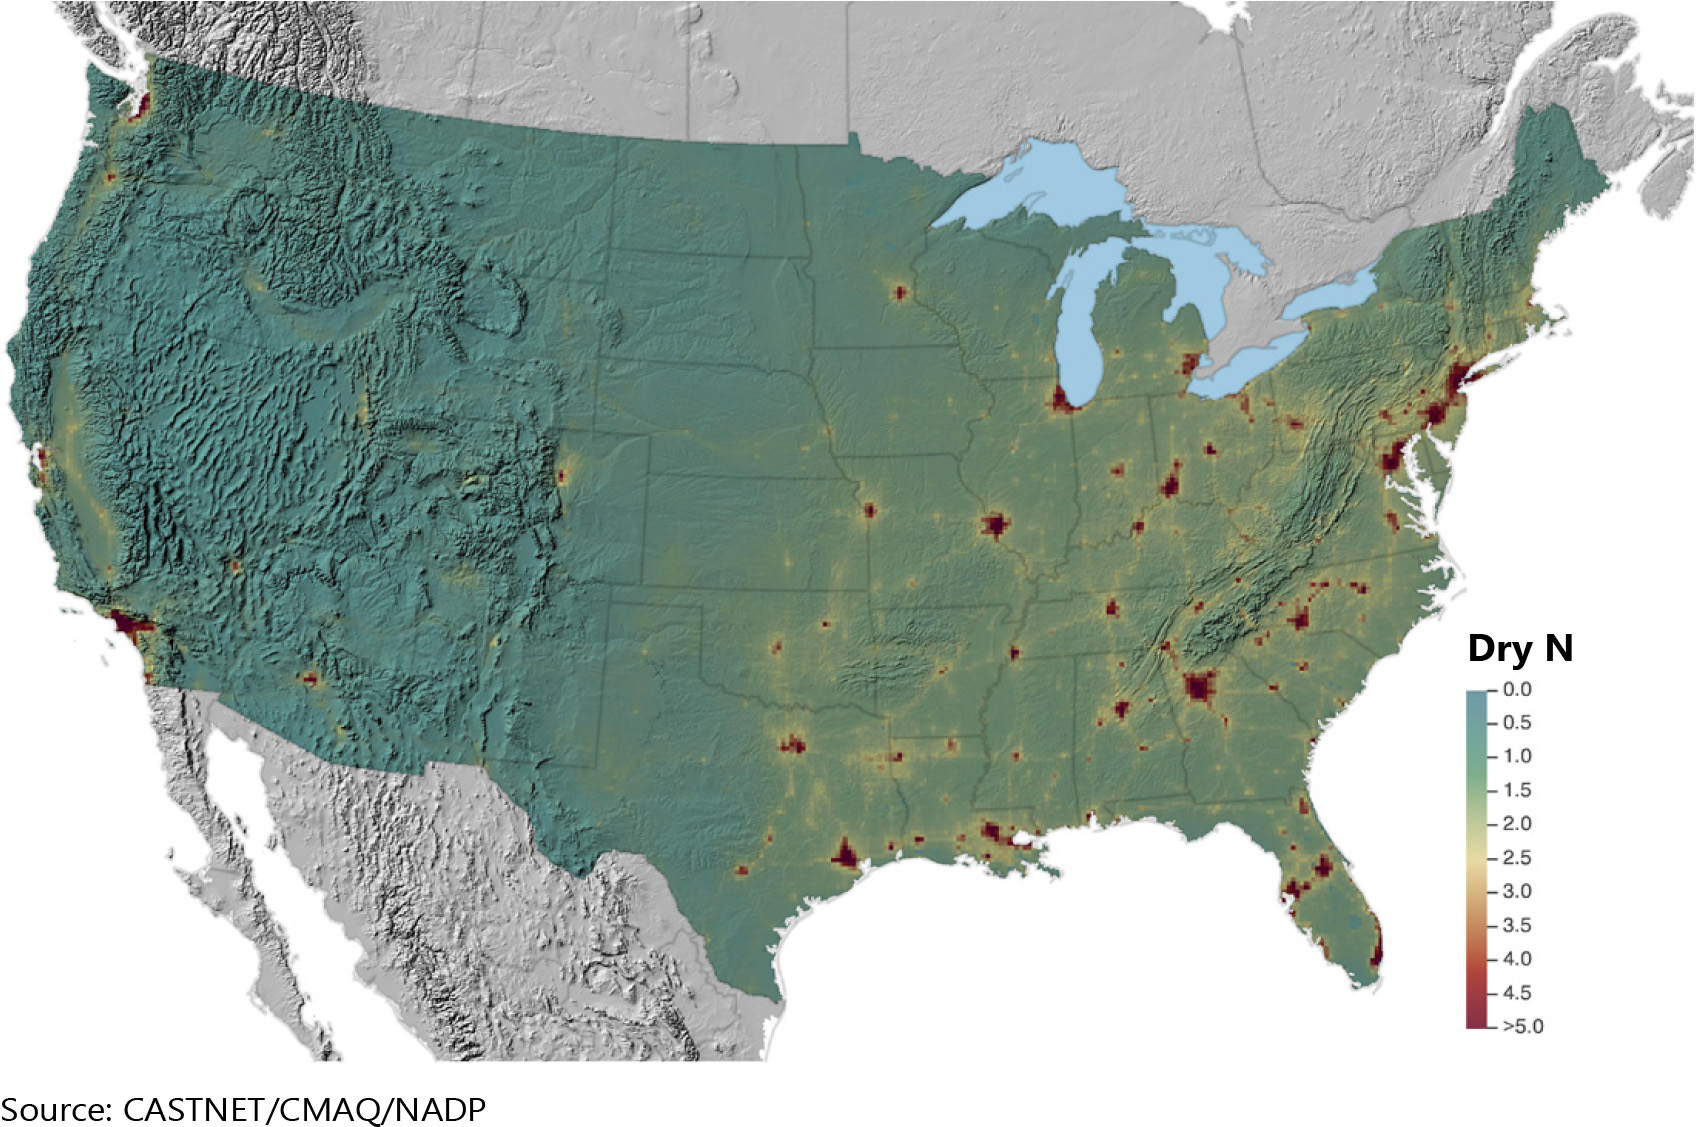
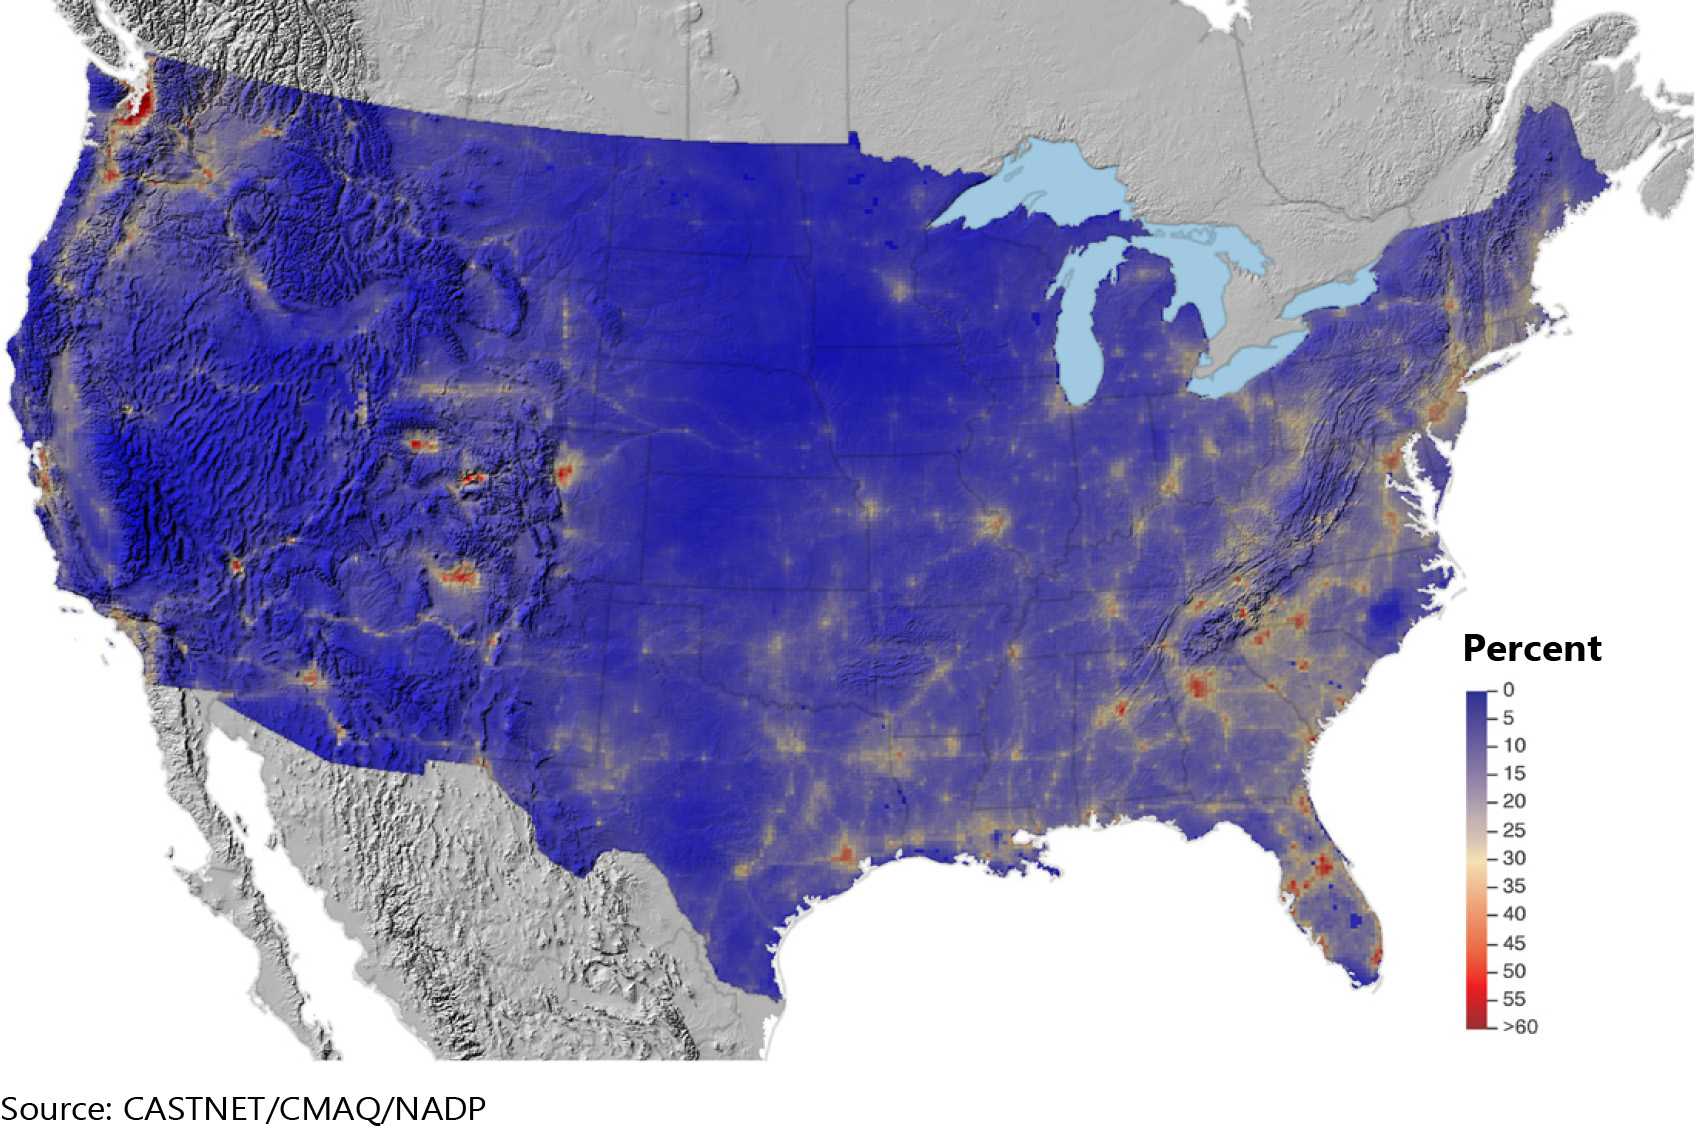
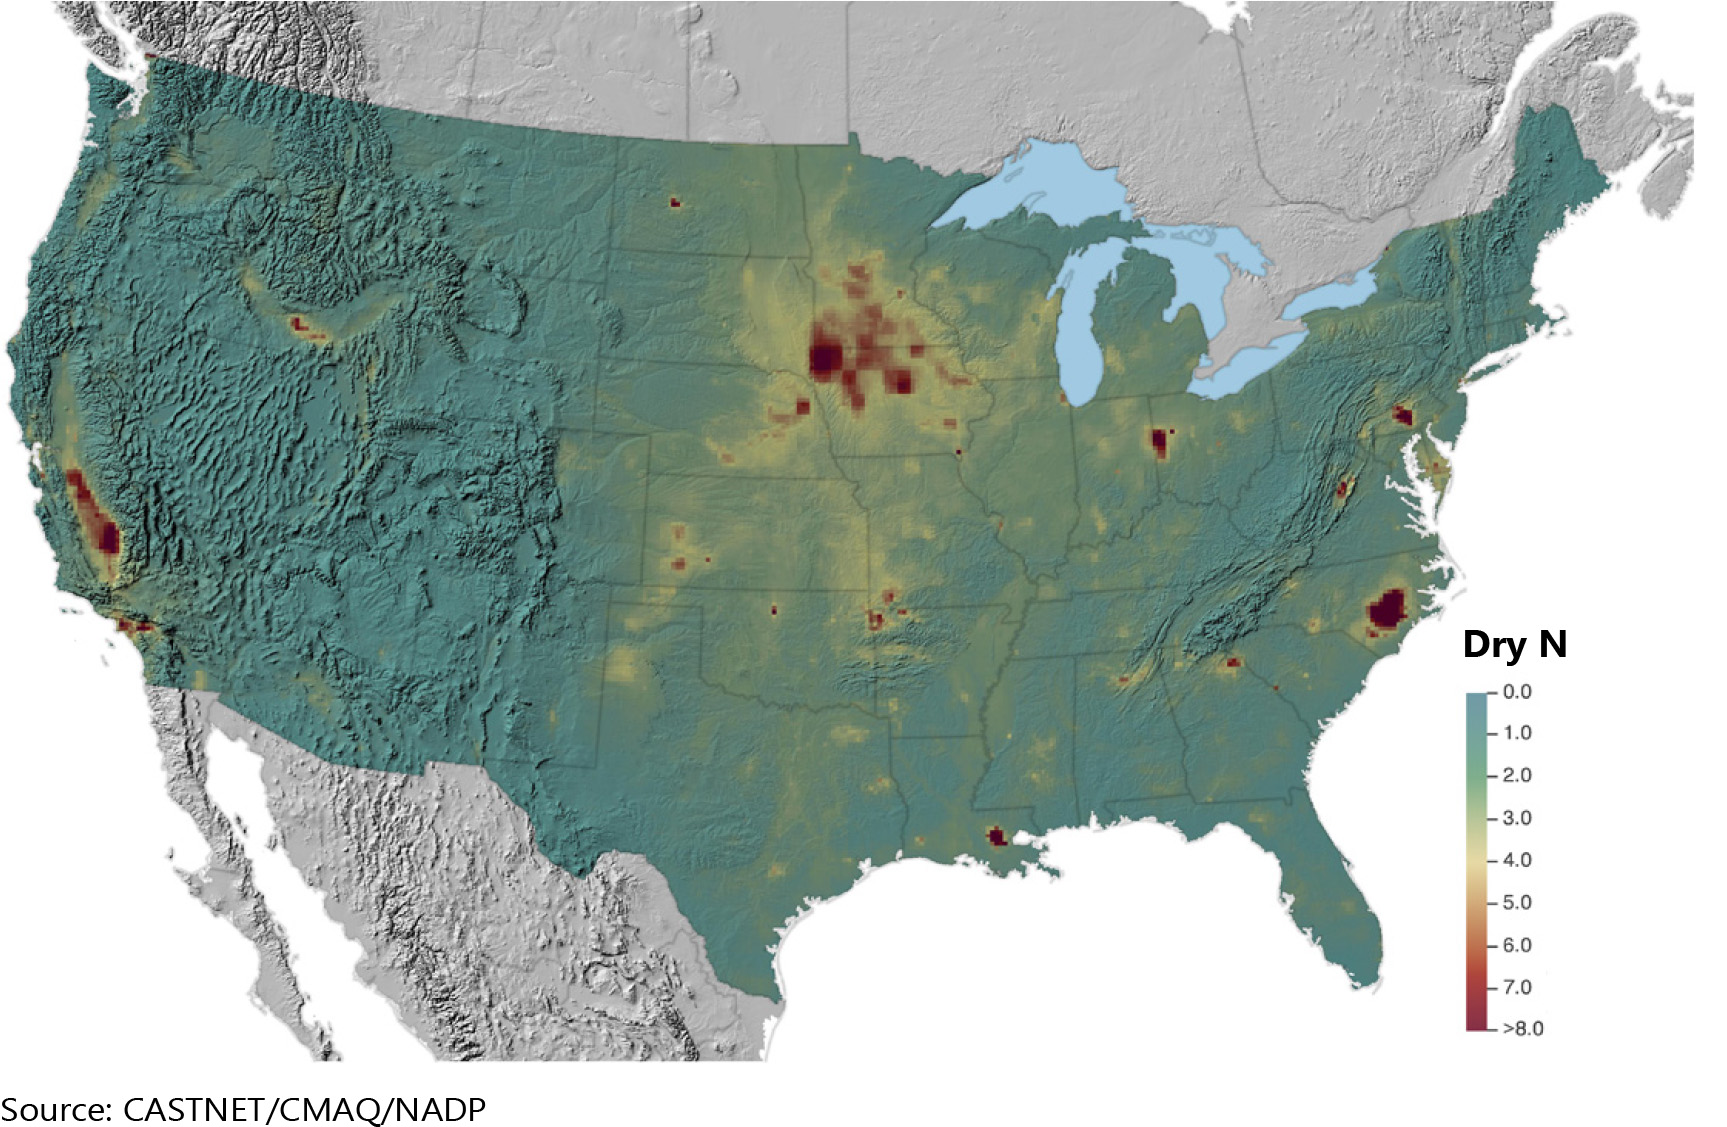
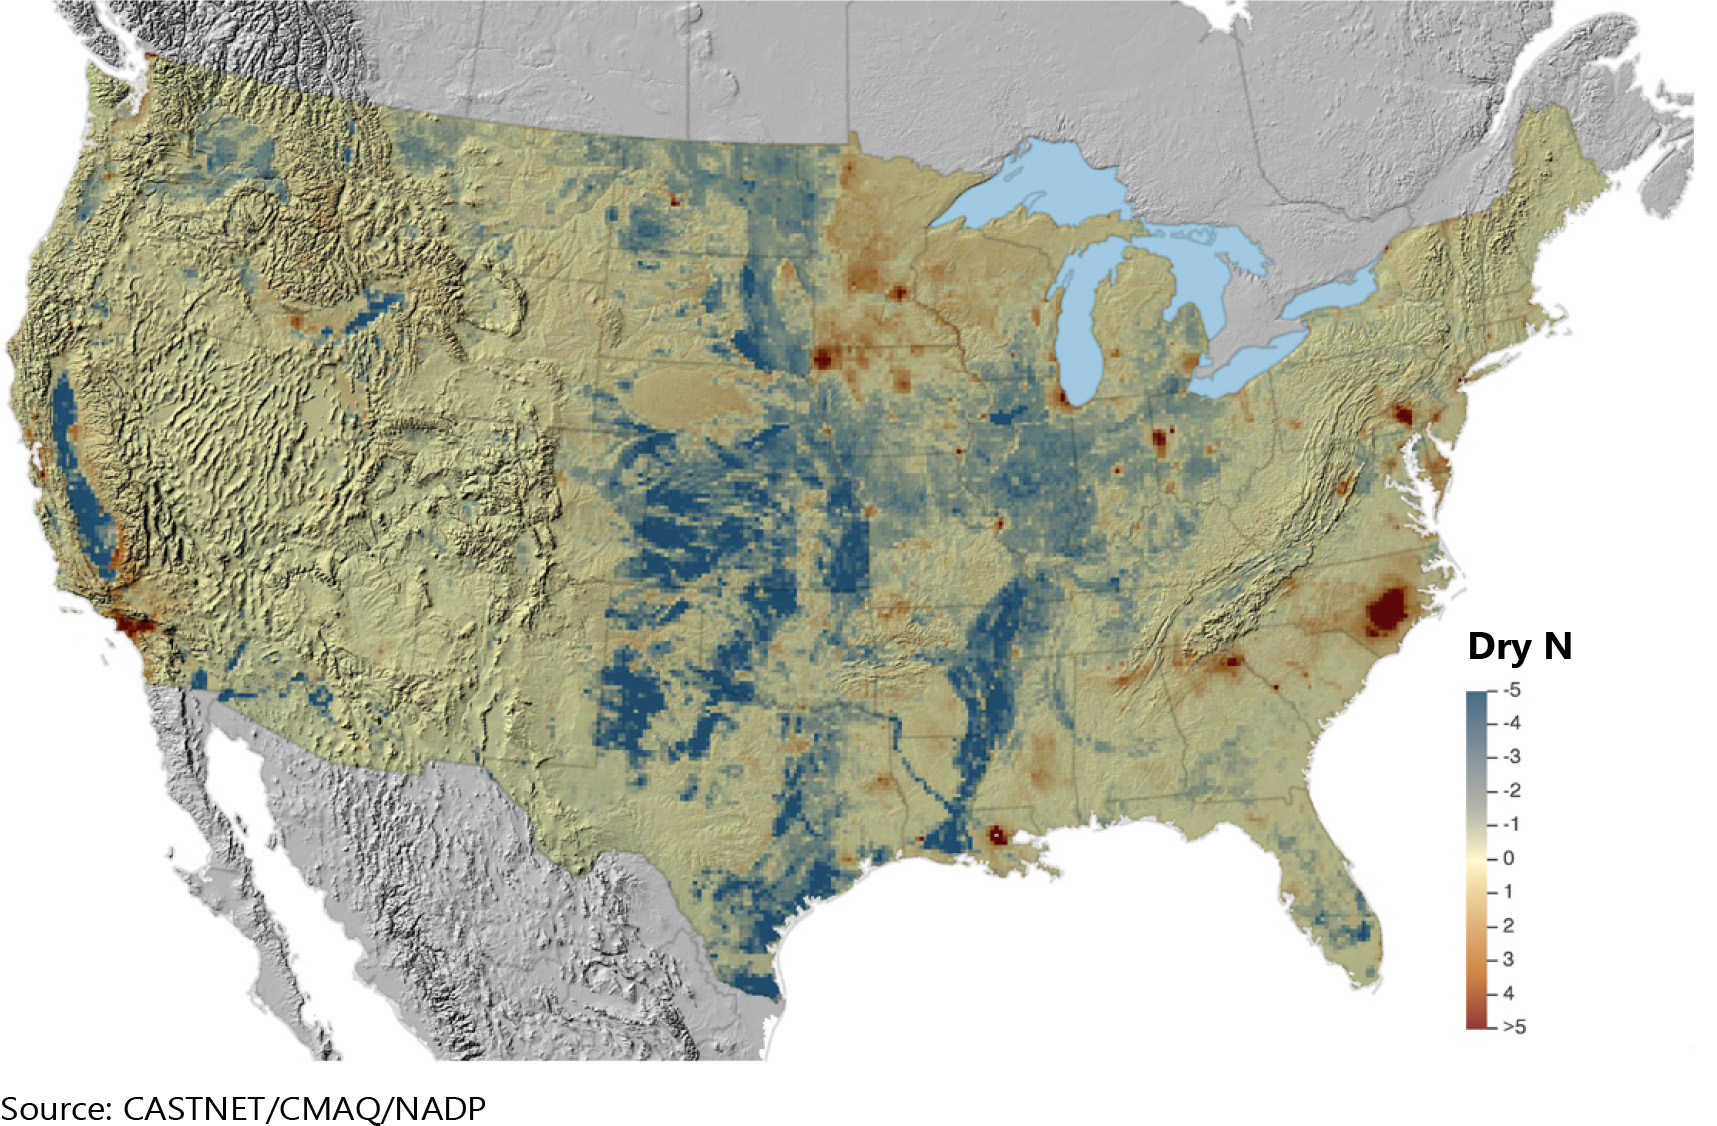
Nitrogen Deposition
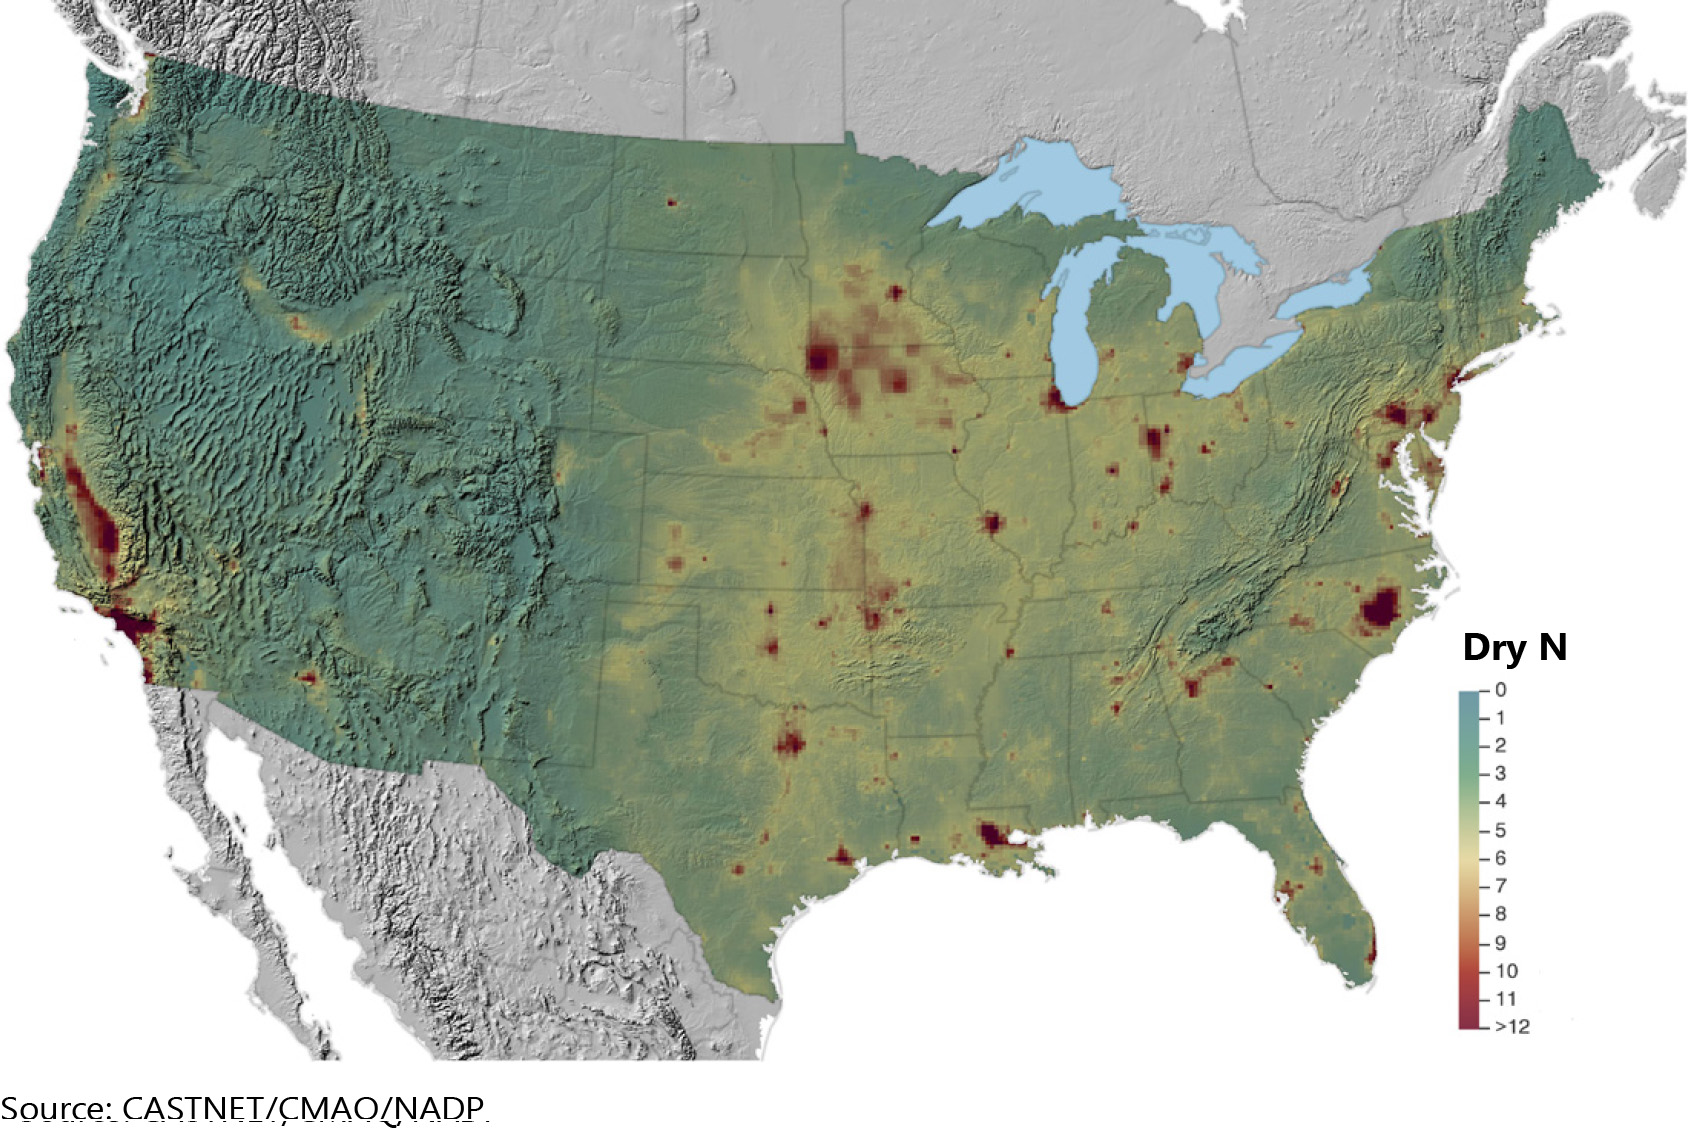
A map of the dry deposition fluxes of nitrogen (N) estimated for 2018 by the TDep method is shown in Figure 19. The magnitude of the deposition fluxes is illustrated by the shading in the figure legend. A map of total deposition of N estimated for 2018 is given in Figure 20. The percentage of total deposition of N due to dry deposition is shown in Figure 21. A map of TDep estimates of total deposition of reduced N species for 2018 is given in Figure 22. Figure 23 gives the percentage of total deposition of reduced N. Dry deposition of N species that are not routinely measured but are modeled by CMAQ and used by TDep is shown in the map in Figure 24, and its percentage of total deposition is shown in Figure 25. Estimates of annual gross dry deposition of NH3 as N for 2018 is shown in Figure 26, and the net dry deposition of NH3 as N is shown in Figure 27. The net dry deposition figure shows the direction of the flux (i.e., positive values for deposition and negative values for emissions).
Sulfur Deposition
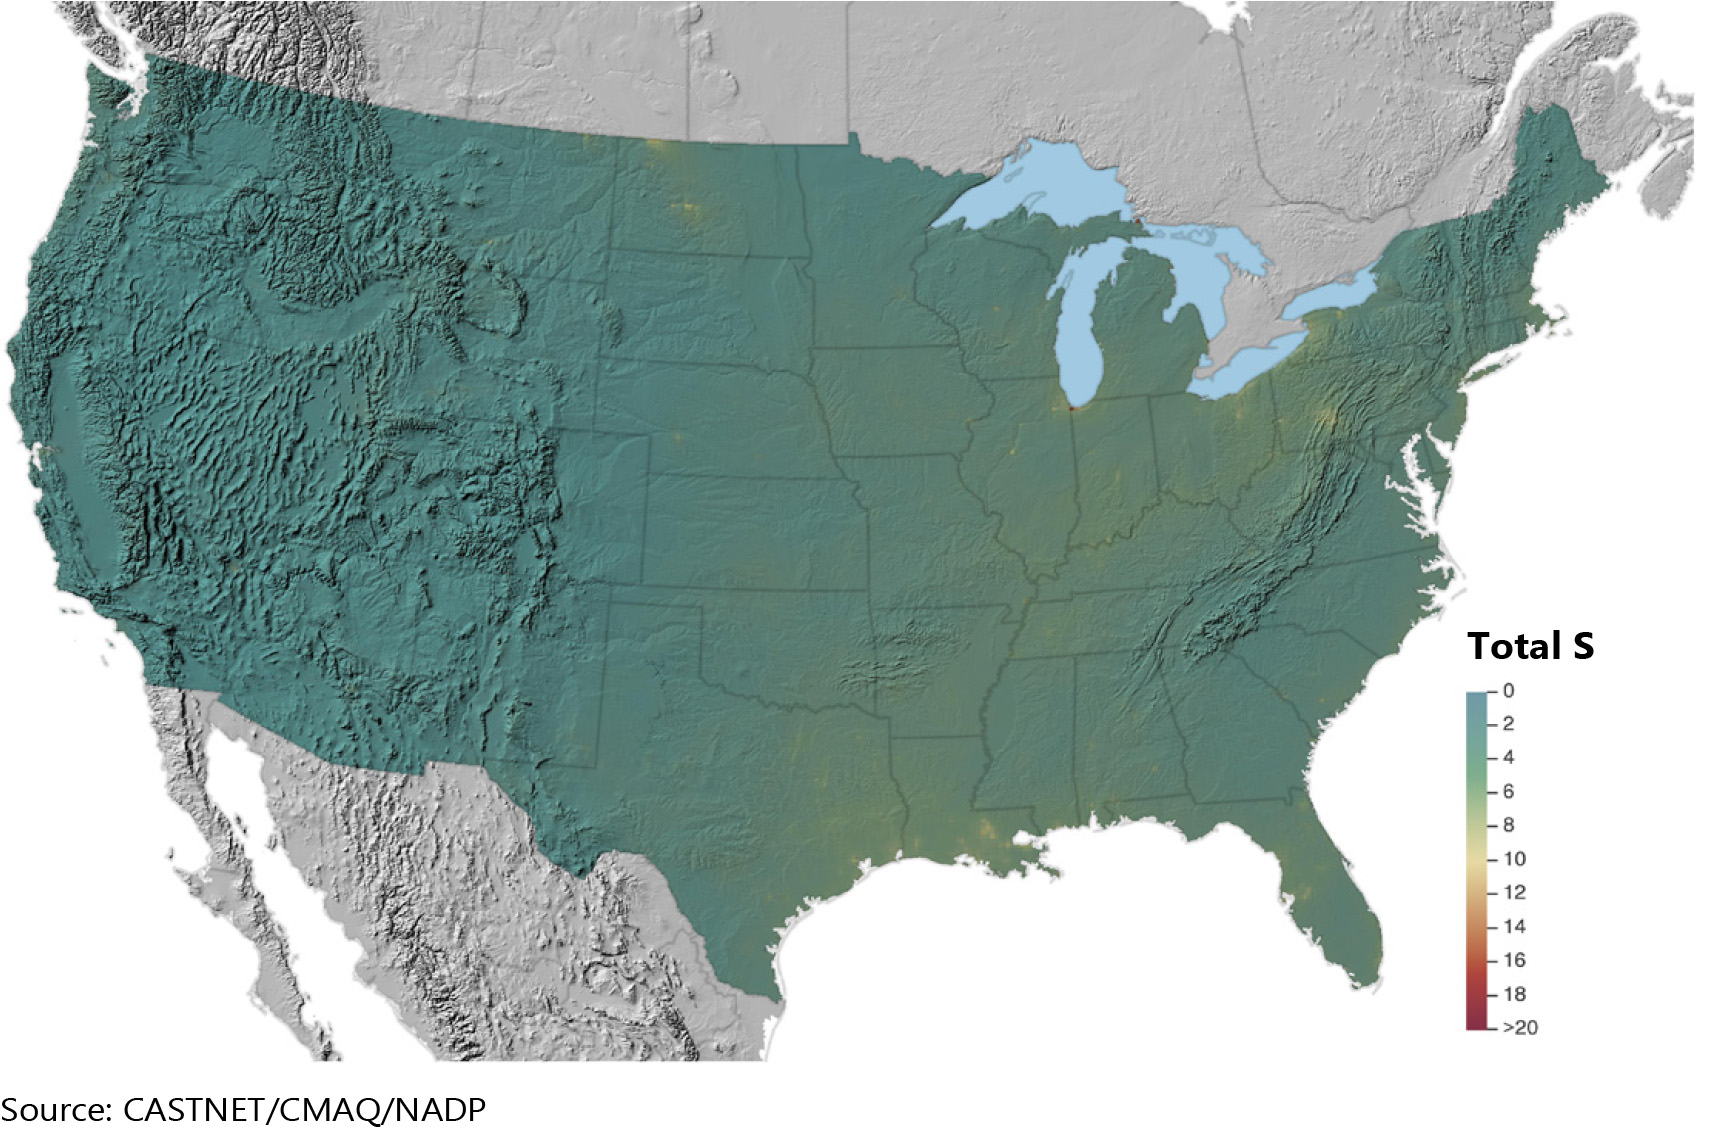
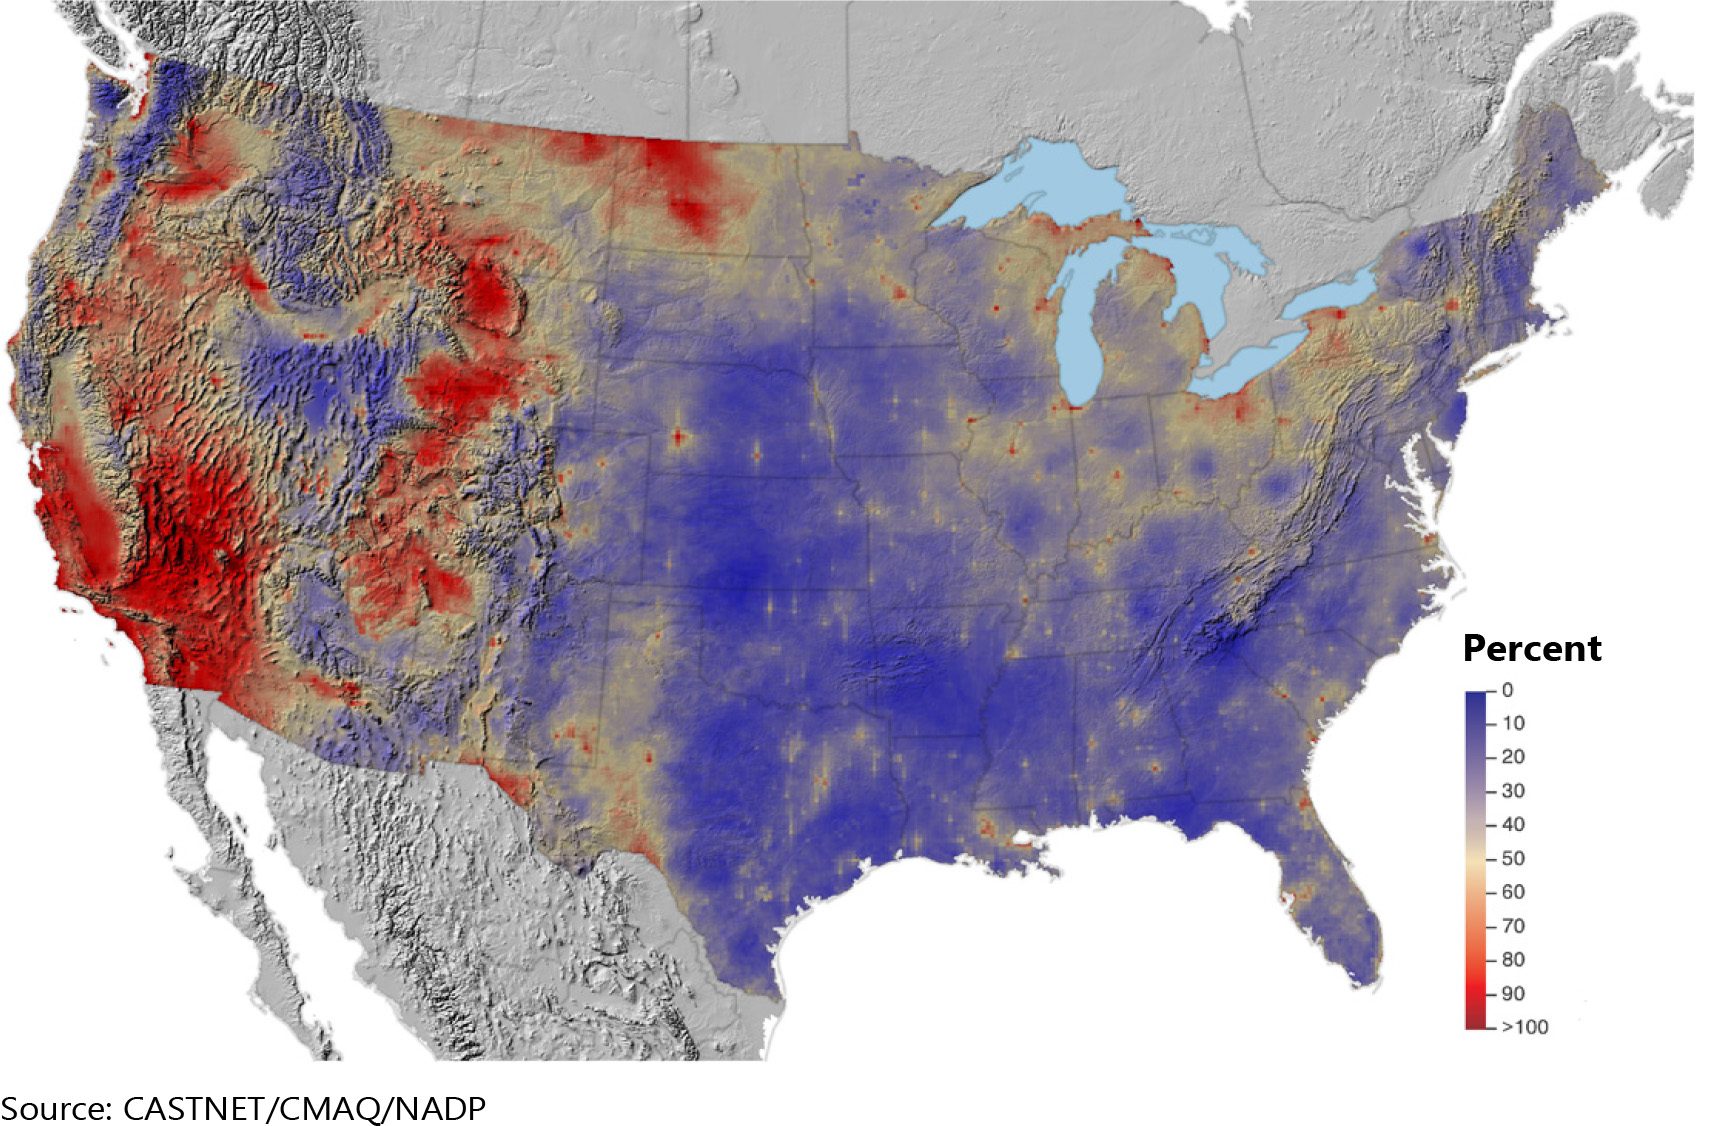
Figure 28 shows a map of TDep estimates of total deposition rates of sulfur (S) for 2018. The magnitude of the deposition fluxes is illustrated by the shading in the figure legend. The percentage of total deposition of S due to dry deposition is shown in Figure 29.
Deposition of Base Cations and Chloride
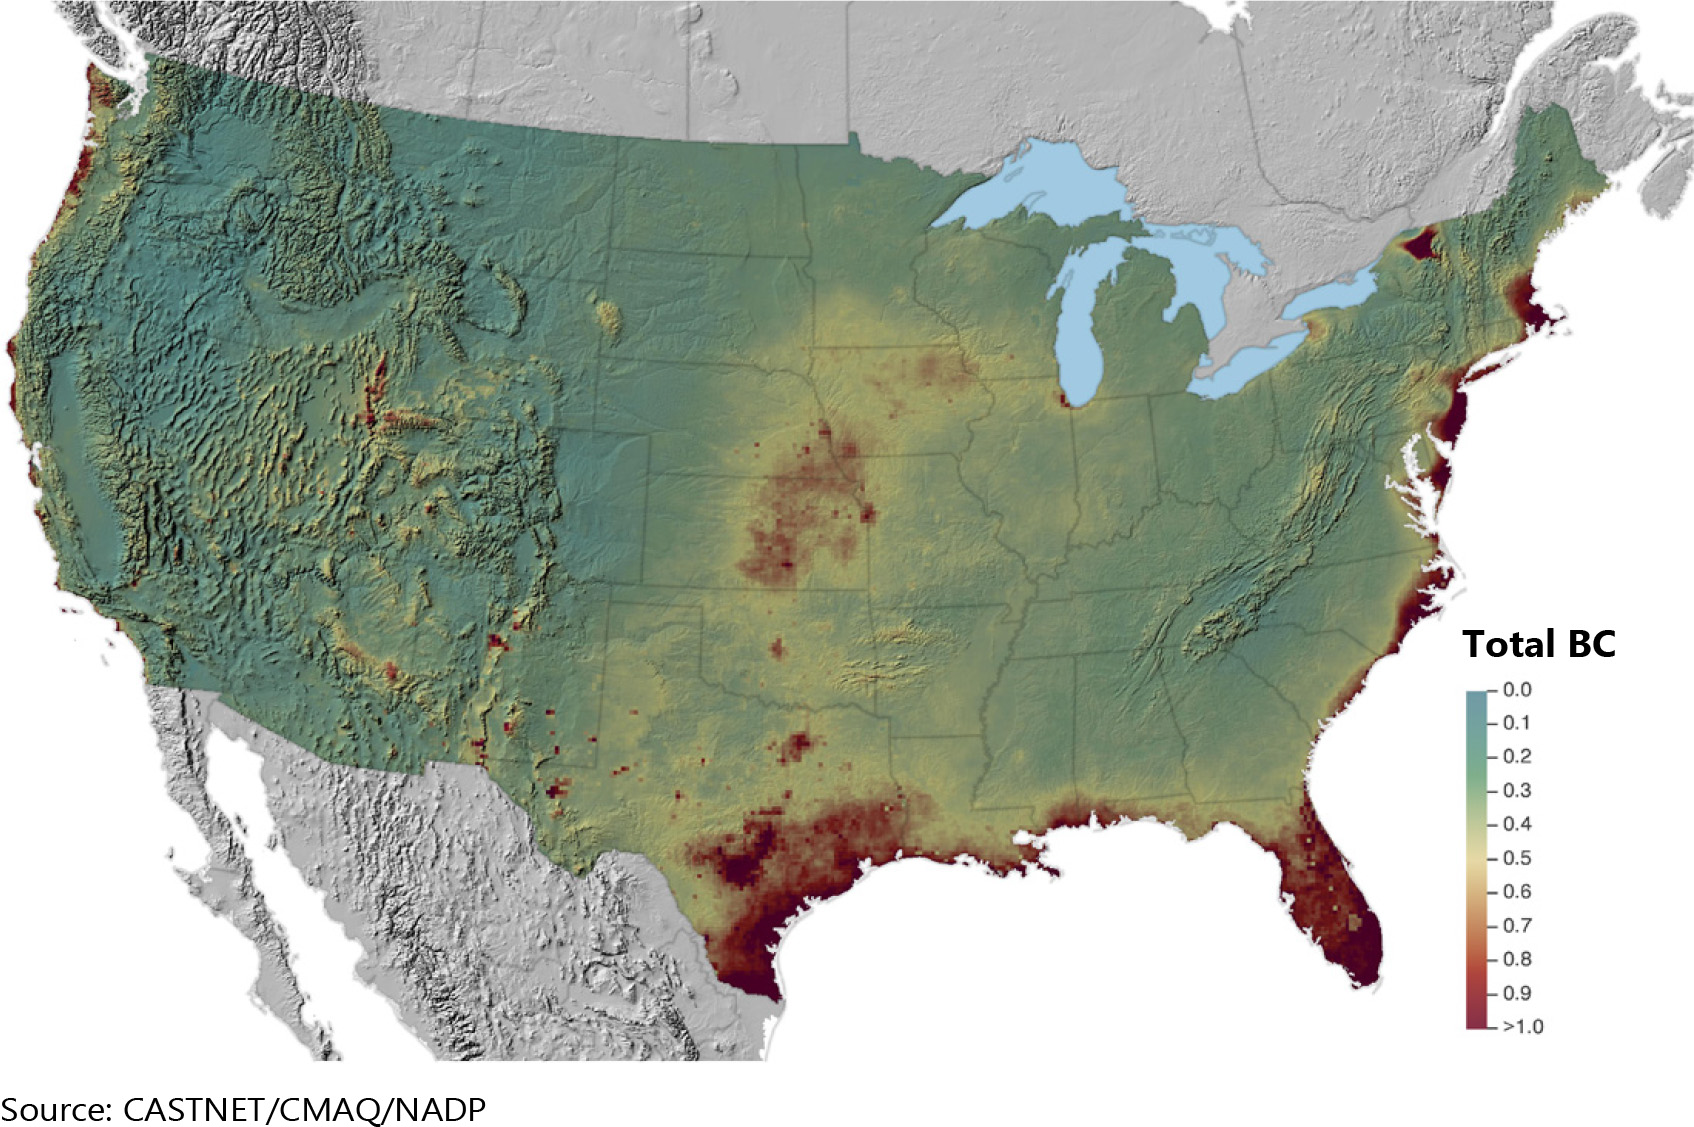
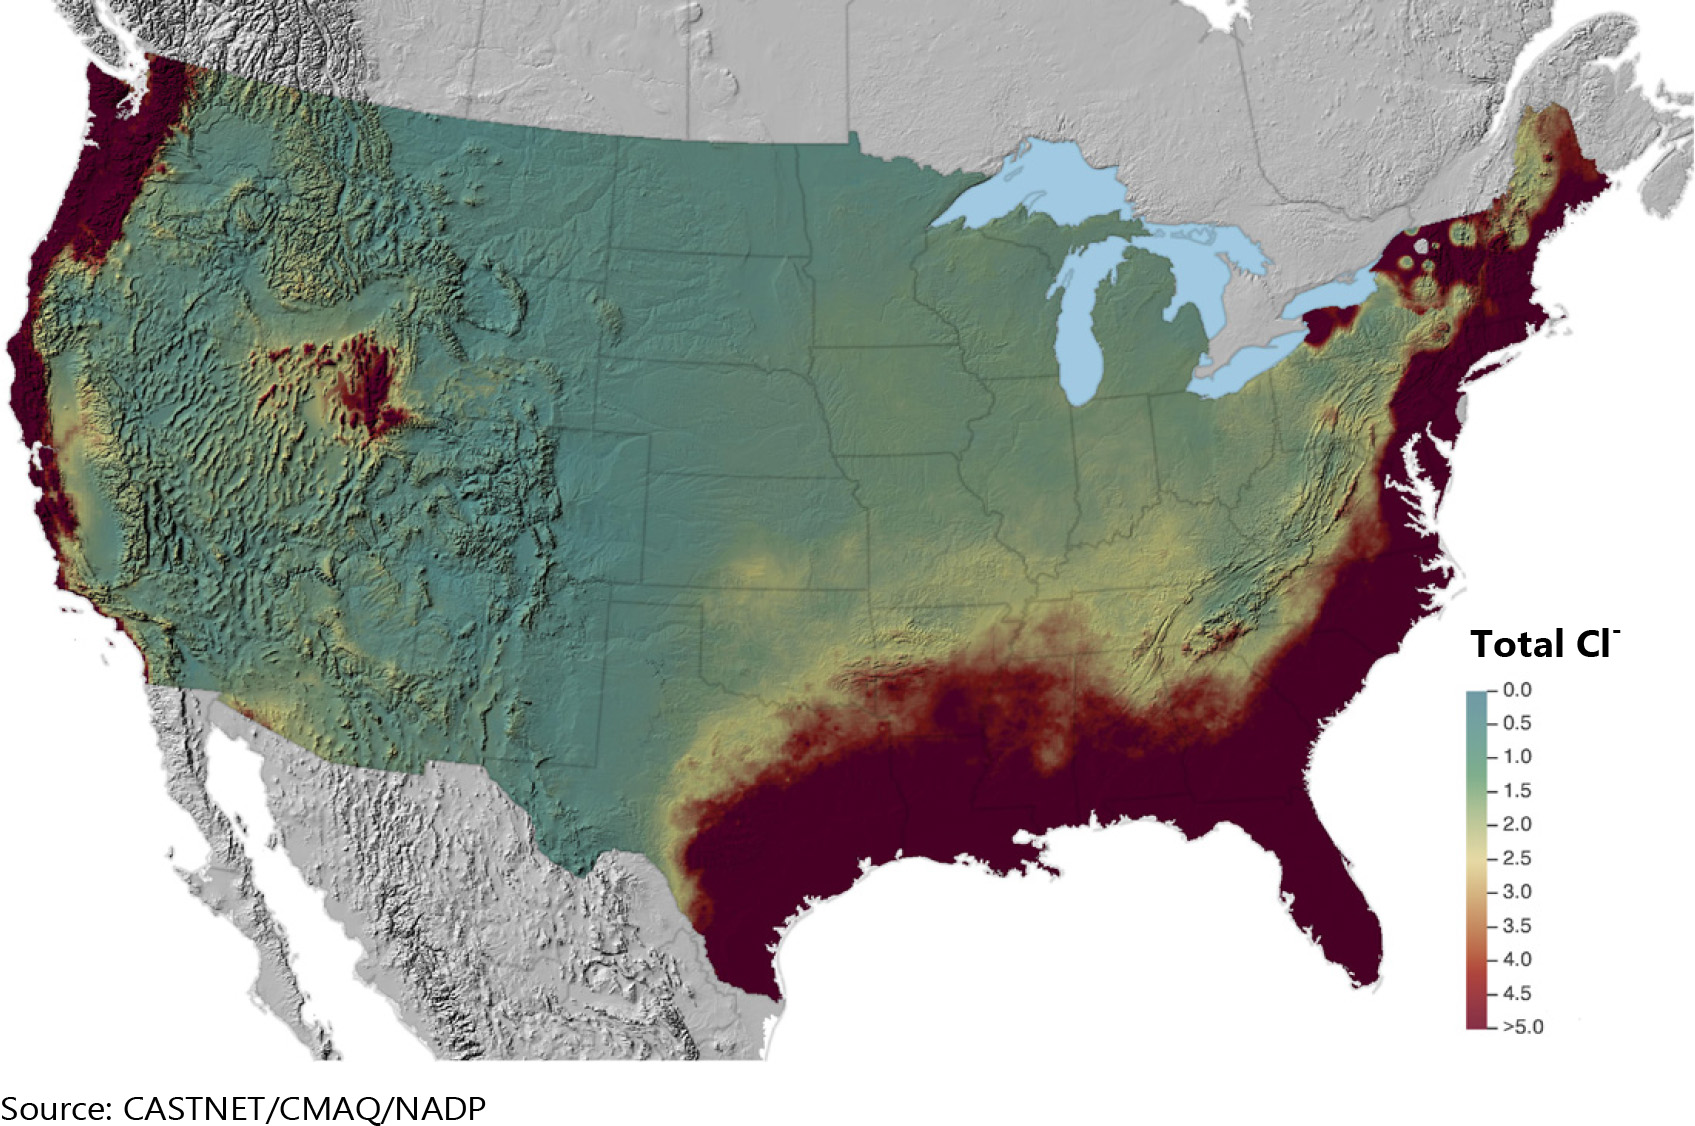
A map of 2018 estimated total deposition of base cations (Ca 2+ , K + , Mg 2+ , and Na + ) is given in Figure 30. Figure 31 provides 2018 estimated rates of deposition of total Cl -.
Figure 19 TDep Dry Deposition Estimates of N (kg ha-1 yr-1 ) for 2018
 Download Figure
Source: CASTNET|CMAQ|NADP
Figure 20 TDep Total Deposition Estimates of N (kg ha-1 yr-1 ) for 2018
 Download Figure
Source: CASTNET|CMAQ|NADP
Figure 21 TDep Percent of Total Deposition of N from Dry Deposition for 2018
 Download Figure
Source: CASTNET|CMAQ|NADP
Figure 22 TDep Total Deposition Estimates of Reduced N Species (kg ha-1 yr-1 ) for 2018
 Download Figure
Source: CASTNET|CMAQ|NADP
Figure 23 TDep Percent of Total Deposition of Reduced N Species for 2018
 Download Figure
Source: CASTNET|CMAQ|NADP
Figure 24 TDep Dry Deposition Estimates of Unmonitored N Species (kg ha-1 yr-1 ) for 2018
 Download Figure
Source: CASTNET|CMAQ|NADP
Figure 25 TDep Percent of Total Deposition of N from Dry Deposition of Unmonitored Species for 2018
 Download Figure
Source: CASTNET|CMAQ|NADP
Figure 26 TDep Gross Dry Deposition of NH3 as N (kg ha-1 yr-1 ) for 2018
 Download Figure
Source: CASTNET|CMAQ|NADP
Figure 27 TDep Net Dry Deposition of NH3 as N (kg ha-1 yr-1 ) for 2018
 Download Figure
Source: CASTNET|CMAQ|NADP
Figure 28 TDep Total Deposition Estimates of S (kg ha-1 yr-1 ) for 2018
 Download Figure
Source: CASTNET|CMAQ|NADP
Figure 29 TDep Percent of Total Deposition of S from Dry Deposition for 2018
 Download Figure
Source: CASTNET|CMAQ|NADP
Figure 30 TDep Total Deposition Estimates of the Base Cations Ca 2+, K +, Mg 2+, and Na + (kiloequivalents ha-1 yr-1 ) for 2018
 Download Figure
Source: CASTNET|CMAQ|NADP
Figure 31 TDep Total Deposition Estimates of Total Cl - (kg ha-1 yr-1 ) for 2018
 Download Figure
Source: CASTNET|CMAQ|NADP
Monitor for Aerosols and Gases (MARGA) Update
Several Monitor for AeRosol GAses (MARGA) field measurement campaigns have been completed since 2011. These measurement campaigns produced hourly concentrations of the pollutant gases and aerosols historically collected by CASTNET plus NH3 to characterize the integrated measurements from the CASTNET filter pack and provide more information on atmospheric chemistry and processes that may affect the filter pack data. In several of the campaigns, MARGA systems were deployed in a gradient sampling mode and paired with sonic anemometers to directly measure dry deposition fluxes. These gradient sampling studies were conducted across different ecosystems to improve deposition model parameterizations. These studies were supported by EPA’s Clean Air Markets Division through CASTNET and Office of Research and Development (ORD). Other sponsors/operators included NADP, the Illinois State Water Survey (ISWS), Colorado State University, College of Charleston, and ECCC. In 2020, the United States Department of Agriculture’s Agricultural Research Service plans to operate a MARGA in Denton, MD. Table 3 summarizes the MARGA field measurements and resulting databases.
The datasets have already been used in published studies (e.g., Rumsey et al., 2014; Rumsey and Walker, 2016; Evanoski-Cole et al., 2017; Chen et al., 2017), doctoral dissertations (Evanoski-Cole, 2017), environmental reports (EPA, 2011), and many presentations. The data are currently being used in several EPA studies (publications in preparation). An additional goal of the MARGA sampling program is to make the concentration and flux datasets publicly available on the CASTNET website. The datasets that will be published are listed in Table 3. The databases will include both EPA and collaborator-collected data. The studies are at various QA stages, and the datasets must be organized, made consistent, and documented. Some of the MARGA project tasks in progress or under consideration include the following:
- Developing a publicly available MARGA concentration database including
- Organization of all EPA-related concentration datasets for consistency and compatibility prior to merging into the current EPA concentration database,
- Addition of collaborator-collected concentration datasets to EPA database, and
- Documentation of the experimentation and data analysis notes and metadata from each study to publish alongside the related database;
- Developing a publicly available MARGA flux database for flux studies (will include similar subsets as the MARGA concentration database);
- Publishing additional refereed papers and joint research with collaborators including vetting and characterization of integrated measurements from CASTNET filter packs, enhanced NOy monitoring systems, and AMoN (e.g., preparation of average diurnal profiles of NH3 for different seasons and ecosystems);
- Using MARGA data to improve nitrogen and sulfur budgets locally and nationally;
- Using the higher temporal resolution MARGA data to investigate specific acute pollution events and combine with source apportionment studies;
- Developing better parameterizations of fluxes and deposition velocities, which will be used to improve future versions of models such as CMAQ and the Comprehensive Air Quality Model with Extensions (CAMx);
- Using MARGA data for model algorithm validation (e.g., gas-to-particle speciation and aerosol acidity); and
- Expanding the MARGA measurements and research to different types of ecosystems by partnering with new organizations.
Table 3 MARGA Datasets
| Location | Year | Instruments/Co-located Measurements | Type of Measurement | Operating Group |
|---|---|---|---|---|
| Beltsville, MD | 2013-2015 | AMoN, MARGA-EPA1 (2013-2015) MARGA-EPA2 (2013) MARGA-EPA3 (2013-2016) CASTNET Filter Pack Met, NTN, AMoN Enhanced NO/NOy (2016) AiRRmonia* (2016) |
Concentration | CASTNET |
| 2013 | MARGA-EPA1 (2013), MARGA-EPA2, CASTNET Filter Pack, Met, NTN, AMoN |
Concentration | CASTNET | |
| 2013-2016 | MARGA-EPA3, CASTNET Filter Pack, Met, NTN, AMoN, Enhanced NO/NOy, AiRRmonia* (2016) |
Concentration | CASTNET | |
| Charleston, SC | 2017 | MARGA-GRAD2, Met, Soil | Concentration, Flux | CASTNET |
| Bondville, IL | 2017 | MARGA-EPA3, CASTNET Filter Pack, AMoN, Met | Concentration | NADP/ISWS |
| Theodore Roosevelt National Park | 2013-2014 | MARGA-EPA2, Bakken Air Quality Study II (BAQS-II) | Concentration | Colorado State University |
| Rocky Mountain National Park | 2013-2014 | MARGA-EPA2, Front Range Air Pollution and Photochemistry Experiment (FRAPPE) | Concentration | Colorado State University |
| Duke Forest, NC | 2012 | MARGA-GRAD1 | Concentration, Flux | ORD |
| 2014 | MARGA-GRAD1 | Concentration | ORD | |
| 2017 | MARGA-GRAD3 | Concentration, Flux | ORD | |
| Coweeta, NC | 2016 | MARGA-GRAD3 | Concentration, Flux | ORD |
| Egbert, ON (Canada) | 2014-2015 | MARGA-ECCC, CAPMoN, AMoN, CASTNET Filter Pack | Concentration | ECCC |
Notes:
Met = meteorology measurements
* - collaboration with the University of Maryland Baltimore County (UMBC) C. J. Hennigan group
References
Byun, D. and Schere, K. L. 2006. Review of the Governing Equations, Computational Algorithms, and Other Components of the Models‐3 Community Multiscale Air Quality (CMAQ) Modeling System. Applied Mechanics Reviews, 59: 51‐77. doi:10.1115/1.2128636
Chen X., Walker J., Geron C. 2017. Chromatography Related Performance of the Monitor for AeRosols and GAses in Ambient Air (MARGA): Laboratory and Field-based Evaluation. Atmos. Meas. Tech. 10: 3893-3908. doi:10.5194/amt-10-3893-2017
Evanoski-Cole, A. R. 2017. Impacts of Unconventional Oil and Gas Development on Atmospheric Aerosol Particles. Doctoral Dissertation. Colorado State University, Fort Collins, CO.
Evanoski-Cole, A. R., Gebhart, K. A., Sive, B. C., Zhou, Y., Capps, S. L., Day, D. E., Prenni, A. .J., Shurman, M. I., Sullivan, A. P., Li, Y., Hand J. L., Schichtel, B. A., and Collett, J. L. 2017. Composition and Sources of Winter Haze in the Bakken Oil and Gas Extraction Region. Atmos. Environ. 156. 77-87. doi:10.1016/j.atmosenv.2017.02.019
International Organization for Standardization (ISO). 2005. Statistical Methods for the Use in Proficiency Testing by Interlaboratory Comparisons, Annex C, Robust Analysis, Section C.1: Algorithm A. Standard 13528. ISO 13528:2005(E).
Rumsey, I. C., Cowen, K. A., Walker, J. T., Kelly, T. J., Hanft, E. A., Mishoe, K., Rogers, C., Proost, R., Beachley, G. M., Lear, G., Frelink, T., and Otjes, R. P. 2014. An Assessment of the Performance of the Monitor for AeRosols and GAses in Ambient Air (MARGA): a Semi-continuous Method for Soluble Compounds, Atmos. Chem. Phys., 14, 5639–5658. doi:10.5194/acp-14-5639-2014
Rumsey, I. C. and Walker, J. T. 2016. Application of an Online Ion-chromatography-based Instrument for Gradient Flux Measurements of Speciated Nitrogen and Sulfur, Atmos. Meas. Tech., 9, 2581–2592. doi:10.5194/amt-9-2581-2016
Schwede, D. B. and Lear, G. G. 2014. A Novel Hybrid Approach for Estimating Total Deposition in the United States. Atmos. Environ., 92:207-220. doi:10.1016/j.atmosenv.2014.04.008
U. S. Environmental Protection Agency (EPA). 2011. Environmental Technology Verification Report: Applikon MARGA Semi-continuous Ambient Air Monitoring System. EPA Office of Research and Development, EPA/600/R11106VR.
Wood Environment & Infrastructure Solutions, Inc. (Wood). 2018. Clean Air Status and Trends Network (CASTNET) Quality Assurance Project Plan (QAPP) Revision 9.1. Prepared for U.S. Environmental Protection Agency (EPA), Office of Air and Radiation, Clean Air Markets Division, Washington, DC. Contract No. EP-W-09-028. Gainesville, FL. http://java.epa.gov/castnet/documents.do.