Assessing Outdoor Air Near Schools
Charles Russell Elementary, Crabbe School, and Hatcher School - Ashland, KY and Whitwell Elementary School - Ironton, OH
Results and Analysis of EPA’s monitoring
EPA selected these schools for monitoring because they are located close to each other and near a coke plant and steel manufacturing activities, which are sources of air toxics emissions. Computer models were used to determine which air toxics may be present at elevated levels in the outdoor air near these schools. The models showed that pollutants associated with coke plant operations, including benzene, arsenic, and benzo(a)pyrene, could be present in the air around Charles Russell Elementary School, Crabbe School, Hatcher School, and Whitwell Elementary School. The models also showed that manganese could be present in the air outside Whitwell Elementary School due to the nearby presence of steel manufacturing activities. This information prompted EPA to test to see if the levels present may be of concern.
| Primary Findings | Levels of pollutants associated with coke plant emissions, including benzene, arsenic, and benzo(a)pyrene and associated longer-term concentration estimates at all four schools were not as high as suggested by the information available prior to monitoring. Although they were below the levels of concern that had been suggested by the modeling information, these results indicate the influence of these pollutants of concern emitted from nearby sources. However, since this monitoring occurred, one of the sources, the coke plant, officially closed June 23, 2011. Levels of manganese and associated longer-term concentration estimates at Whitwell Elementary are below levels of concern. They are not as high as suggested by the information available prior to monitoring. |
| Key Pollutants Monitored | Benzene. Inhalation of benzene at high levels can affect the bone marrow and can cause anemia and leukemia. |
| Next Steps | Based on the analysis described here, EPA will not extend air toxics monitoring at this school. EPA remains concerned about emissions from sources of air toxics and continues to work to reduce those emissions across the country, through national rules and by providing information and suggestions to assist with reductions in local areas. The Kentucky Department for Environmental Protection (KYDEP) and the Ohio Environmental Protection Agency (OEPA) will continue to oversee industrial facilities in the area through air permits and other programs. |
Summary of Study Approach and Findings
Approach:
- Monitors collected air samples from July 30, 2009 through April 2, 2010 at Charles Russell Elementary, Crabbe, and Hatcher Schools located in Ashland, KY and at Whitwell Elementary School located in Ironton, OH.
- We posted individual air sample results on the websites for these schools (Charles Russell Elementary School, Crabbe School, Hatcher School, and Whitwell Elementary School) throughout the monitoring period to keep your community informed during the monitoring period.
- During the monitoring period, we evaluated the monitored concentrations to see if there was a concern from short-term exposures (up to several weeks).
- When the monitoring was complete, we analyzed the results to see if there was a concern from long-term exposures (over a lifetime).
- In addition, when the monitoring was complete, we evaluated all the air samples from the on-site monitors. We also evaluated information on wind speed and wind direction from a weather monitor at each of the schools, along with historical weather information and information about nearby sources of benzene, arsenic, benzo(a)pyrene, and manganese emissions.
Findings:
- Our analysis also found that measured levels of pollutants associated with coke plant emissions, including benzene, arsenic, and benzo(a)pyrene, and associated long-term concentration estimates were not as high as was suggested by modeling information available prior to monitoring. Although they were below the levels of concern for long-term exposure that had been suggested by the modeling, these results indicate the influence of these pollutants of concern emitted from nearby sources.
- Our analysis found that levels of manganese at Whitwell Elementary School (which has since closed) are below concentrations of concern; although they do indicate the influence from a source of manganese emissions.
- The process to identify schools for monitoring relied on emissions estimates and other information. Ambient air monitoring at the school allowed measurement of what was actually in the air.
- Production at the nearby coke plant in 2009 was reduced to approximately half of recent levels. Although production rose somewhat in 2010, the coke plant officially closed June 23, 2011.
- Production at the steel manufacturing facility in 2009 was reduced about 15% from the 2008 levels (72% of capacity) which were typical levels for the facility. Production rose again in 2010 (75% of capacity) which was slightly above the levels in 2008.
- Based on the analysis summarized here, EPA will not extend air toxics monitoring at this school.
- Click here for additional information
How We Analyzed the Information We Collected at these Schools
The analysis considered whether the information collected at these schools might raise concerns for the health of children or adults at these schools. We looked at the following types of information:
- Measured benzene, arsenic, benzo(a)pyrene, and manganese concentrations and information on benzene, arsenic, benzo(a)pyrene, and manganese
- Measured wind direction and wind speed at these schools
- Information about nearby sources of benzene, arsenic, benzo(a)pyrene, and manganese emissions
Analysis of Measured Concentrations of the Coke Oven Pollutants:
Levels of the multiple pollutants associated with coke plant emissions, including benzene, arsenic, and benzo(a)pyrene were not as high as suggested by the information available prior to monitoring. Although they were below the levels of significant concern that had been suggested by the modeling information, these results indicate the influence of these pollutants of concern emitted from nearby sources.
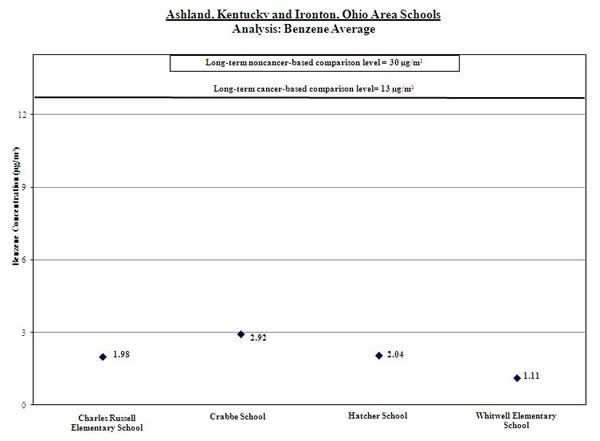
1a. Calculate the benzene average: We calculated the average of the benzene measurements (shown by the black diamond in the graph below). We compared this average to the long-term comparison level (thick line on the graph below).
Result: The average benzene level for the samples collected was below the long-term comparison level.
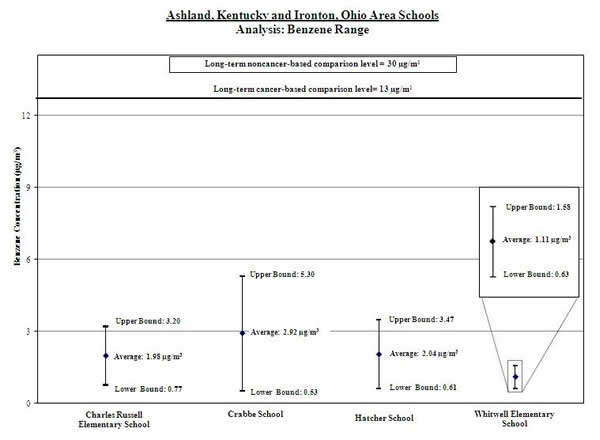
1b. Calculate a range for the benzene average: To account for varying air concentrations of benzene, we calculated a range around the average by estimating high and low values that the longer-term concentrations might reach using common statistical tools. We compared the highest point in the range (called the “upper bound”) to the long-term comparison level.
Result: The high end of the range is lower than the comparison level.
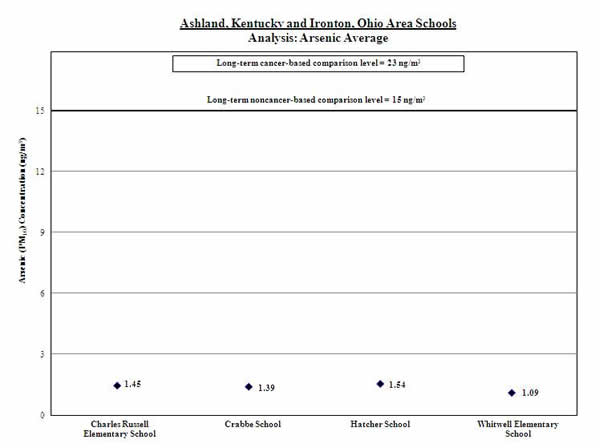
2a. Calculate the arsenic average: We calculated the average of the arsenic measurements (shown by the black diamond in the graph below). We compared this average to the long-term comparison level (thick line on the graph below).
Result: The average arsenic level for the samples collected was below the long-term comparison level.
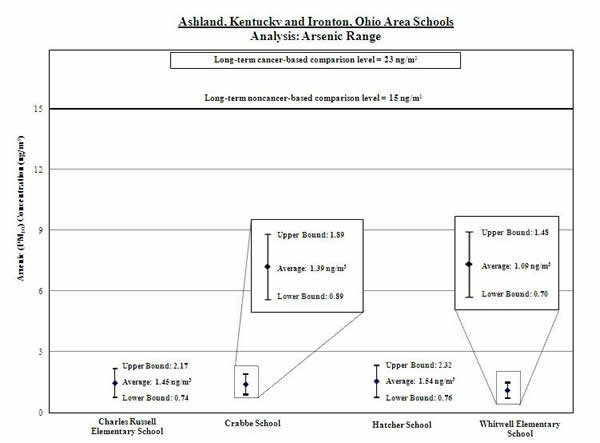
2b. Calculate a range for the arsenic average: To account for varying air concentrations of arsenic, we calculated a range around the average by estimating high and low values that the longer-term concentrations might reach using common statistical tools. We compared the highest point in the range (called the “upper bound”) to the long-term comparison level.
Result: The high end of the range is lower than the comparison level.
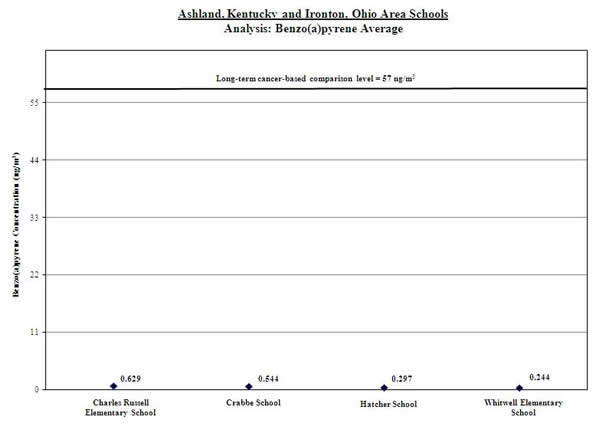
3a. Calculate the benzo(a)pyrene average: We calculated the average of the benzo(a)pyrene measurements (shown by the black diamond in the graph below). We compared this average to the long-term comparison level (thick line on the graph below).
Result: The average benzo(a)pyrene level for the samples collected was below the long-term comparison level.
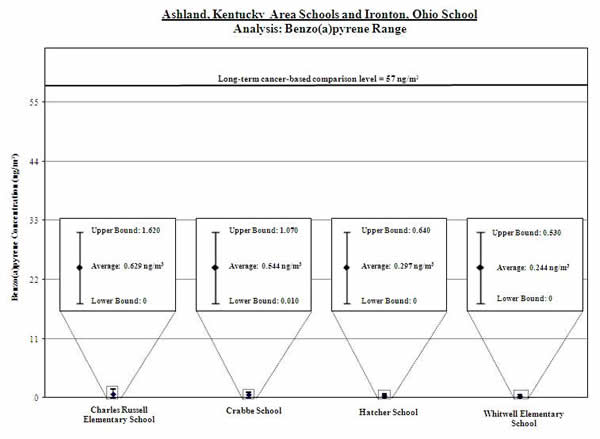
3b. Calculate a range for the benzo(a)pyrene average: To account for varying air concentrations of benzo(a)pyrene, we calculated a range around the average by estimating high and low values that the longer-term concentrations might reach using common statistical tools. We compared the highest point in the range (called the “upper bound”) to the long-term comparison level.
Result: The high end of the range is lower than the comparison level.
Analysis of Measured Manganese Concentrations:
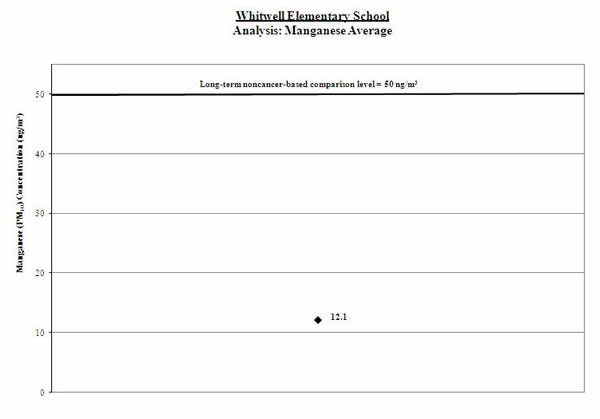
1. Calculate the average: We calculated the average of the manganese measurements (shown by the black diamond in the graph below). We compared this average to the long-term comparison level (thick line on the graph below). The long-term comparison level represents the level of manganese in the air that is below levels associated with health concerns, even if someone breathed air containing manganese at that level all day, every day over their lifetime.
Result: The average manganese level for the samples collected was well below the comparison level.
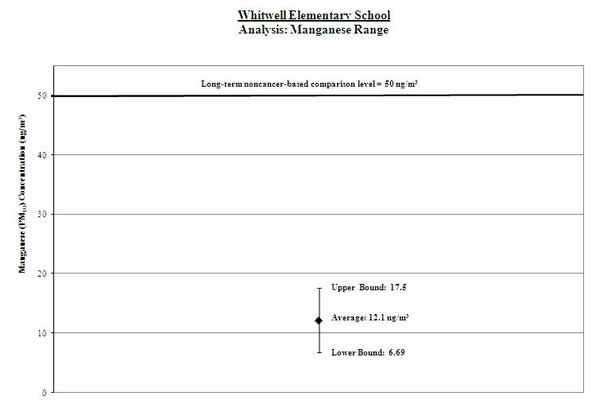
2. Calculate a range: To account for varying air concentrations of manganese, we calculated a range around the average. We did this by estimating high and low values that the longer-term concentrations might reach using common statistical tools. We compared the highest point in the range (called the “upper bound”) to the long-term comparison level.
Result: The high end of the range is lower than the comparison level.
Analysis of Measured Wind Direction and Wind Speed at Each School
We took measurements of wind direction and speed every day during the sample period. We took special note of the wind speed and direction on the days we took measurements of benzene, arsenic, benzo(a)pyrene, and manganese.
| What we looked at | What we found |
We looked at whether the wind data taken on the days we took measurements of benzene, arsenic, benzo(a)pyrene, and manganese are similar or different from the wind patterns during the entire sampling period. |
We found the wind patterns taken on the days we took measurements of benzene, arsenic, benzo(a)pyrene, and manganese to vary compared with those observed during the entire sampling period, probably due to the terrain and presence of the Ohio River affecting meteorological conditions. |
We looked at whether the wind pattern during the sampling period is reflective of regional wind pattern over the long term. |
Although we lack long-term wind data at the monitoring site, the wind pattern at the NWS station during the sampling period is generally similar to the historical long-term wind flow pattern at that same NWS station. |
Analysis of Information on Nearby Sources of Benzene, Arsenic, Benzo(a)pyrene, and Manganese Emissions
| What we looked at | What we found |
Whether we could determine if the sources were operating as usual during the sampling period. |
Production at the nearby coke plant in 2009 was reduced to approximately half of recent levels. Although production rose somewhat in 2010, the facility officially closed June 23, 2011. Production at the steel manufacturing facility in 2009 was reduced about 15% from the 2008 levels (72% of capacity) which were typical levels for the facility. Production rose again in 2010 (75% of capacity) which was slightly above the levels in 2008. |
The concentrations of benzene, arsenic, benzo(a)pyrene, and manganese measured at the school are lower than those suggested by the information that helped identify this school for monitoring. |
|
The nearby sources of benzene, arsenic, benzo(a)pyrene, and manganese have Title V operating air permits issued by KYDEP and OEPA that include operating requirements. |
Additional Information
Technical Report for School: Assessing Outdoor Air Near Schools: Charles Russell Elementary School, Crabbe School, and Hatcher School in Ashland, Kentucky and Whitwell Elementary School, Ironton, Ohio (PDF) (59pp, 928k). The technical report is geared toward risk assessors, risk managers, and other regulatory agencies.
Background on School Monitoring Effort
General Questions and Answers for School Monitoring Effort